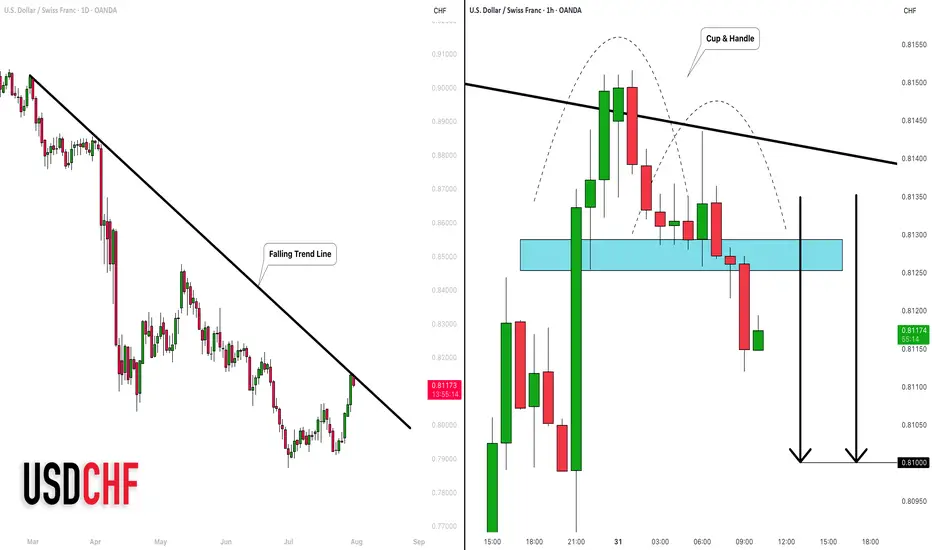
USDCHF: Correction Ahead! 🇺🇸🇨🇭
I think that USDCHF is going to retrace after a test
of a major falling trend line on a daily.
As a confirmation, I found an inverted cup & handle pattern
on an hourly time frame.
Closest support - 0.81
❤️Please, support my work with like, thank you!❤️
Trend Lines
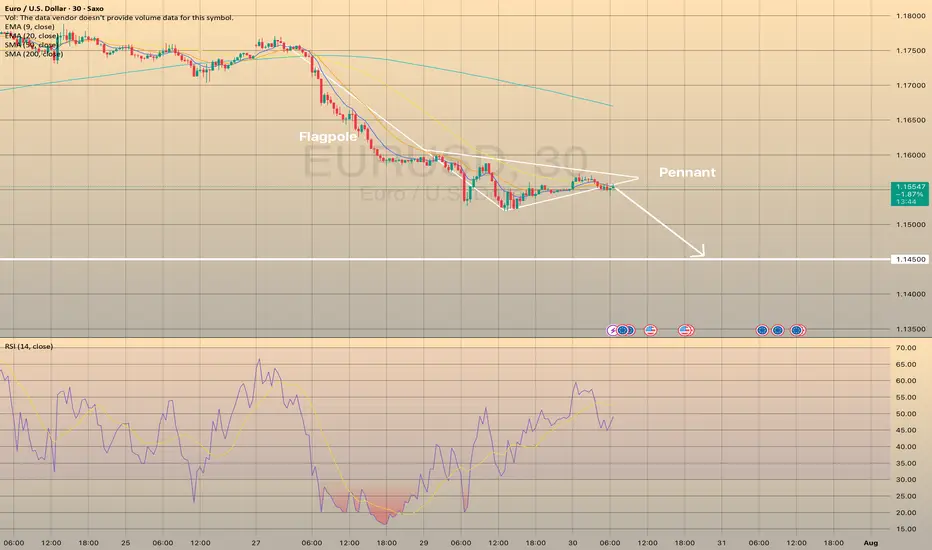
EURUSD FORMED BEARISH PENNANT. THE PRICE IS READY TO DROP.EURUSD FORMED BEARISH PENNANT. THE PRICE IS READY TO DROP.
EURUSD has been trading sideways within the last day, showing lower highs and higher lows. Eventually, the price has formed the pennant chart pattern.
What is a pennant?
A pennant chart pattern is a short-term continuation pattern in technical analysis, resembling a small symmetrical triangle, formed after a strong price movement (flagpole). It consists of converging trendlines, indicating a brief consolidation before the trend resumes. Bullish pennants form after an uptrend, bearish pennants after a downtrend.
The price is expected to decline towards 1.14500 support level
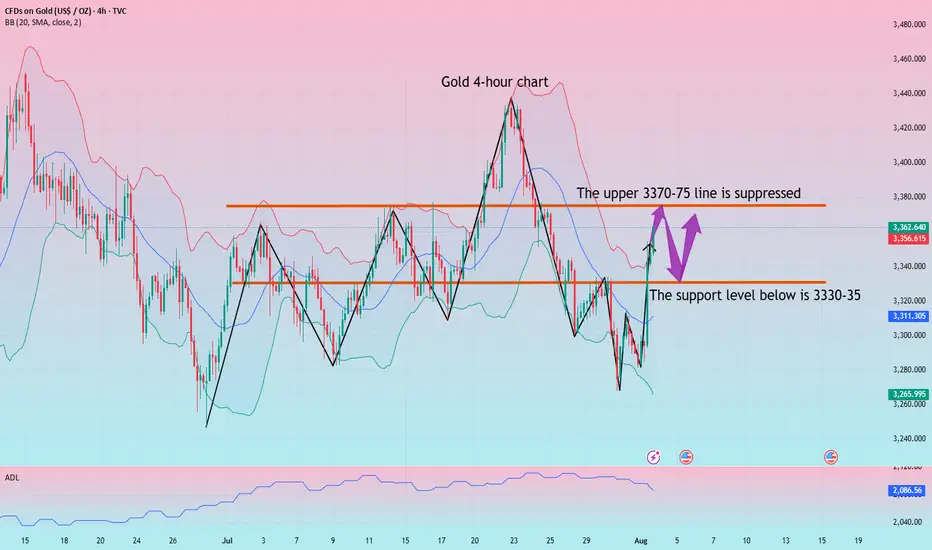
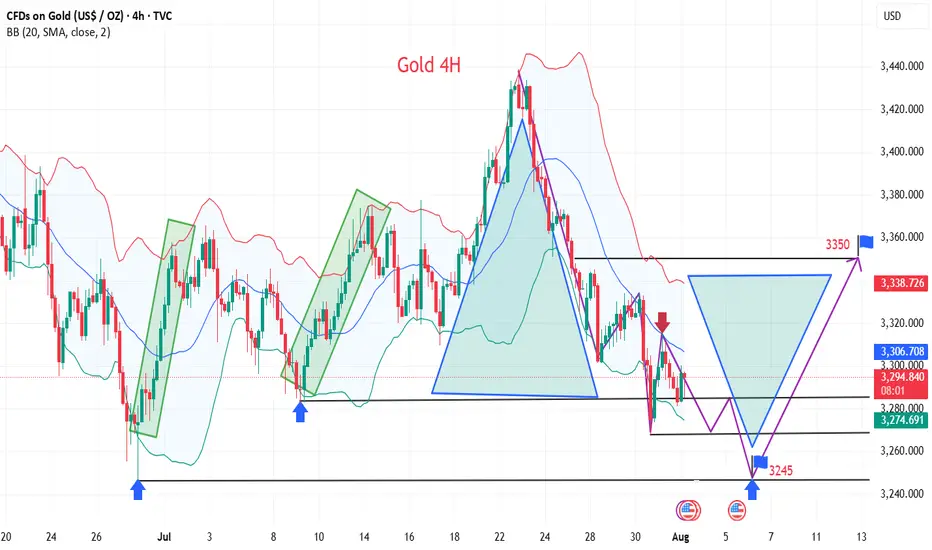
Gold Market Update: Major Support at and Supply atGold is recovering after a strong drop from the previous range high. Price is approaching a 4H Order Block near the 3300–3310 zone, which may act as a supply area. A minor liquidity zone has just been tapped, suggesting a potential short-term rejection.
The major support lies at 3269, which sparked the recent bullish move. If price rejects from the OB zone, a pullback toward this support is likely. However, a clean break and hold above the OB may signal further upside.
📌 Key Levels:
Supply Zone: 3300–3310
Support: 3269
🧠 Wait for clear confirmation before executing trades.

Silver on the path of growth and developmentAs I mentioned in the previous article, silver is moving towards the desired target, which is around $40 per ounce of silver. As you can see, this three-month chart and the uptrend drawn and reproduced shows the desired price target near the top of the channel.
If there is a change and an update is needed, I will definitely check and publish it again.
Good luck.
MJ .REZAEI

Analysis of gold market operation strategies and ideas next week
Gold rallied unilaterally on Friday following positive non-farm payroll data, reaching a new high for the week. This week's candlestick formed a hammer pattern, suggesting further upside potential next week. Bulls continued their push late Friday, closing at 3363. Next week, we will continue to monitor short-term resistance around 3370-3375. We will continue to buy on pullbacks. If your current trading is not satisfactory, I hope I can help you avoid investment setbacks. Welcome to discuss your options!
Based on a 4-hour analysis, short-term resistance will be seen around 3370-3375 next week, with a key resistance around 3395-3400. We will continue to buy on pullbacks. In the intermediate range, we recommend maintaining a cautious wait-and-see approach. I will provide detailed trading strategies during the trading session, so please stay tuned.
Gold Trading Strategy:
Go long on gold pullbacks to 3330-335, with a stop-loss at 3318 and a target at 3370-3375. Hold on if it breaks above this level.
BTC 108K - 112K ZONE Why 108k to 112k zone is important?
Bitcoin recently made a new all-time high and is now undergoing a healthy correction — nothing to worry about.
The $108,000 to $112,000 zone is a key support area due to three major factors:
1. Strong previous support level
2. A daily trendline aligning with this zone
3. 50% Fibonacci retracement of the recent impulse move
If this support holds, there's a strong possibility Bitcoin will form a new ATH around $130,000 to $140,000.
DON'T PANIC wait for confirmation and see the magic 🚀 🚀

The trend is clear, why do I choose to be firmly bullish on goldGold Trend Analysis: Yesterday, the gold market demonstrated strong upward momentum, opening near 3290 before falling slightly to a low of 3281 before fluctuating upward. Boosted by the non-farm payroll data, the gold market surged during the US trading session, reaching a single-day gain of 2.02%, reaching a high of 3363 and closing there. The daily chart formed a long bullish candlestick with a long lower shadow, forming a Morning Star pattern, reinforcing the bullish trend. From the perspective of the cycle structure, the daily level is clearly in the 5-wave upward stage, and the upward trend of the large cycle has not changed. At the indicator level, the daily MACD momentum column (the column below the zero axis) represents the short-selling momentum. Its "gradual shortening" means that the short-selling force is weakening and the downward momentum is gradually fading. It is a potential signal of stopping the decline or rebounding. KDJ is about to form a golden cross between 20-50, which is a signal that short-term bullish power is beginning to increase, and the overall trend is bullish.
The 4-hour level shows typical bullish characteristics: the moving average system is arranged in a bullish pattern, but there is a certain deviation between the short-term price and the moving average. The technical side needs to correct the deviation rate through a callback before continuing to rise. The short-term support below is focused on the line near 3330-3335. This position is both the relay support level in the previous rise and the intersection of the 4-hour moving averages MA10 and MA20, which has strong support strength; the short-term resistance above is focused on the line near 3370-3383. This area is a pressure-intensive area near the previous high point. If it can be effectively broken through, it will further open up upward space. A successful breakout would open up further upside potential. A breakout would further open up the 3400 mark.
For gold trading, the short-term strategy is to buy on dips. If the price pulls back to the 3330-3335 support level, consider entering a long position with a target of 3355-3365. If it reaches 3370-3380, consider a short-term short position with a target of 3350-3340.

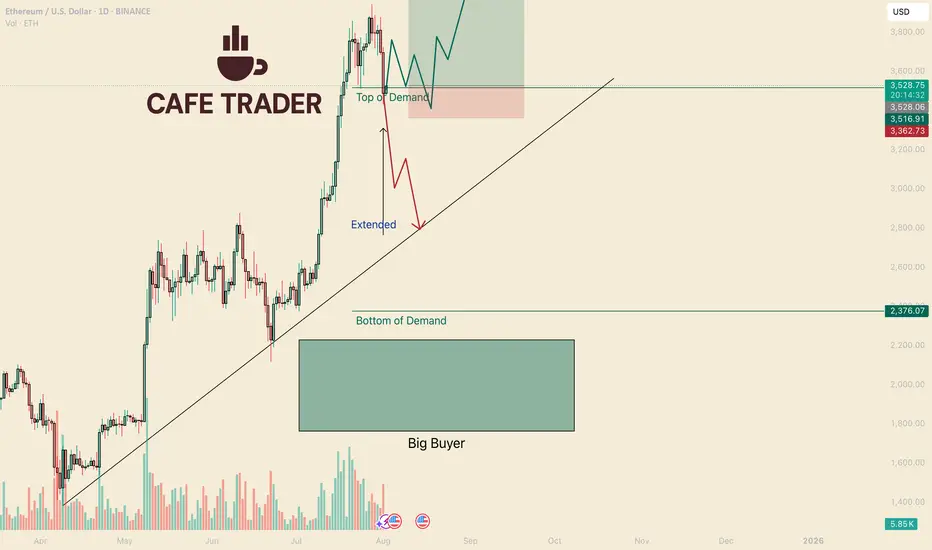
ETH Critical Next Few Days.Hello I am the Cafe Trader.
Today we are taking a close look at Ethereum.
After the Tariff news and the Jobs report, The market as a whole seems very bearish suddenly to many. Even though we do have aggressive sellers in the short term, The market is still bullish in the mid to long term. Let's take a look.
Sentiment has changed
A major catalyst (like the Tariffs news) can cause a change of terrain. Buyers may become more bashful, taking their foot off the gas (where the put it before). Reactions to kry levels (like "top of demand") will give us clues into how strong are they still.
Short Term
ETH had a huge rally, Whats does a healthy rally need for a continuation?
Consolidation
This brings us to the charts
Top of demand gives us evidence of how convicted these current buyers still are in a market. A hot reaction = Aggressive Demand. Cold Reaction = Hesitant or lack of Demand.
Todays close was a touch cold, but considering the recent bearish news and data, not terrible. Buyers are still active in this area, but since the terrain might have changed, I have given you two scenarios.
Green Scenario
For this to play out, we need to see buyers step in immediately. The longer ETH stays in this demand, the heavier they will become (and it's a long way down)
Wait for a second test minimum. Best to get a hot reaction. If it presses into the demand zone, Cut it early. (always good to wait for a close)
Entry 3,518
Stop 3,360
TP 1 3,990
TP 2 Breakout? Trailing stop?
Red Scenario
If we can't close above top of demand (Like tomorrow...) This is the likely scenario. I would be hard pressed to try and catch a knife this overextended. So until we identify where the new sellers are sitting, I can't give you any trades on this scenario. If you are short biased this could run all the way down to the bottom of demand.
I'll keep a close eye this over the weekend and keep updates.
Long Term
These prices should be according to your personal sentiment on ETH.
Aggressive = 3,500
Good price = on the trend roughly 2,900 - 3k
STEAL = 2,200 - 2,400
That's all for ETH! Enjoy your weekend, and Happy Trading!
@thecafetrader
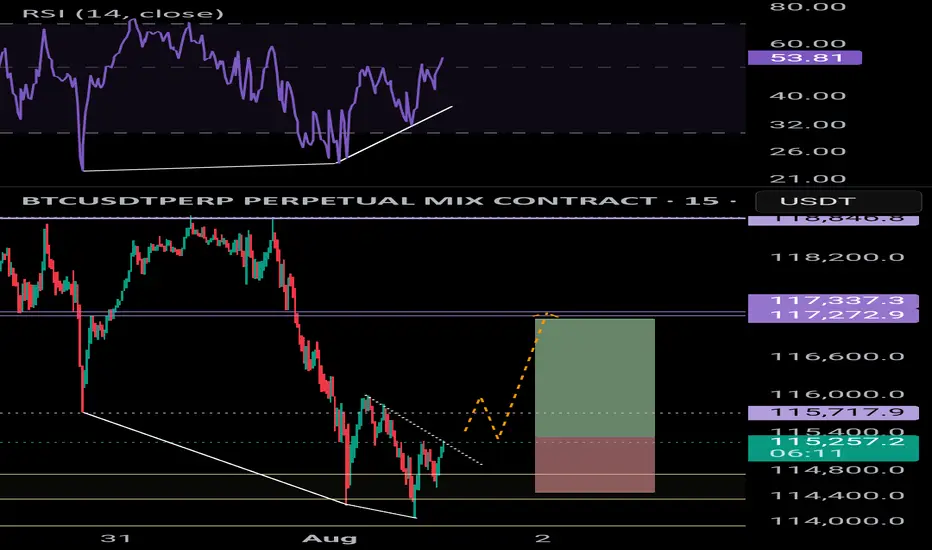
BTC bullish div.Bullish divergence on the 15m and 1H chart 📈
Liquidity grabbed 📈
Expecting a small move up = 1.6%
Long scalp trade if youre interested
Corning Inc. Quote | Chart & Forecast SummaryKey Indicators On Trade Set Up In General
1. Push Set Up
2. Range Set Up
3. Break & Retest Set Up
Notes On Session
# Corning Inc. Quote
- Double Formation
* (EMA Settings)) - *100 EMA Edit | Subdivision 1
* (Uptrend Argument)) | Completed Survey
- 172 bars, 240d | Date Range
- Triple Formation
* (P1)) / (P2)) & (P3)) | Subdivision 2
* Daily Time Frame | Trend Settings Condition | Subdivision 3
- (Hypothesis On Entry Bias)) | Regular Settings
* Stop Loss Feature Varies Regarding To Main Entry And Can Occur Unevenly
- Position On A 1.5RR
* Stop Loss At 58.00 USD
* Entry At 63.00 USD
* Take Profit At 71.00 USD
* (Uptrend Argument)) & No Pattern Confirmation
- Continuation Pattern | Not Valid
- Reversal Pattern | Not Valid
* Ongoing Entry & (Neutral Area))
Active Sessions On Relevant Range & Elemented Probabilities;
European-Session(Upwards) - East Coast-Session(Downwards) - Asian-Session(Ranging)
Conclusion | Trade Plan Execution & Risk Management On Demand;
Overall Consensus | Buy
Gold non-farm payroll layout strategy
💡Message Strategy
Gold prices (XAU/USD) remained under pressure in Asian trading on Friday, trading below $3,300, not far from the January low reached earlier this week. Gold failed to extend its modest overnight rebound, primarily due to the strong US dollar.
The Federal Reserve's latest hawkish tone has prompted a reassessment of the timeline for interest rate cuts, boosting demand for the US dollar and weighing on the non-interest-bearing asset of gold.
The US dollar index rose for the seventh consecutive day, reaching a new high since late May, further weakening gold's appeal. Key to driving the dollar was the latest inflation data: the US PCE price index rose to 2.6% year-on-year in June, while the core index remained stable at 2.8%, exceeding market expectations and reinforcing the view that inflation is persistent.
The U.S. July non-farm payroll report, due on Friday, is seen as a key indicator for assessing economic resilience and the outlook for interest rates. It is expected that employment will increase by 110,000 and the unemployment rate will rise slightly to 4.2%.
📊Technical aspects
From the current technical perspective:
1: The technical pattern suggests a weak rebound and weak continuation.
2: The weak sideways trend is expected to trigger a third phase of bottoming out, stimulated by data.
To summarize: Technically, based on the data, the pattern suggests a downward trend, driven by negative data, leading to a bottoming-out and rebound. Therefore, caution must be exercised against this type of bottoming-out and rebound after the data has been released.
💰Strategy Package
Strategy: Fall first, then rise
Short Position:3310-3315,SL:3325,Target: 3245-3250
Long Position:3240-3250,SL:3220,Target: 3300-3320
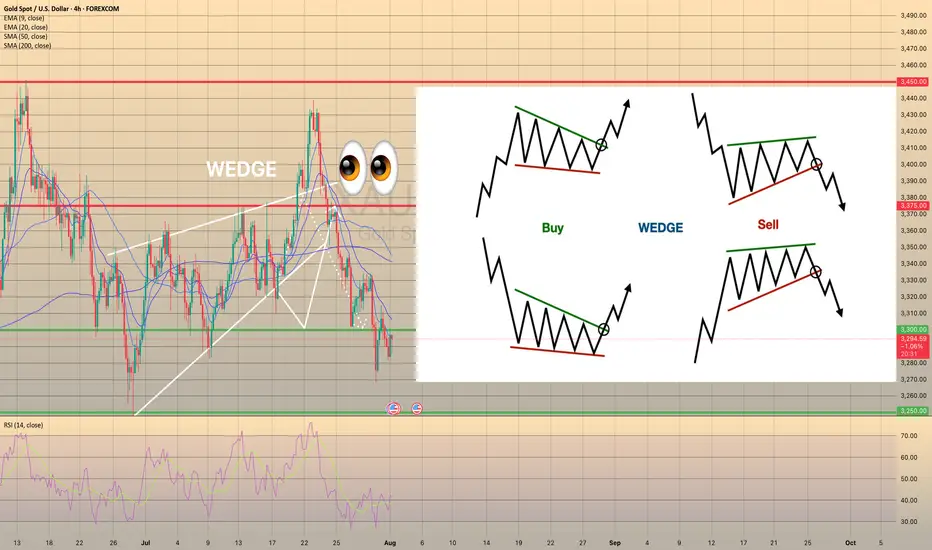
Wedge Pattern: A Key to Trend Reversals and Continuations📈 Wedge Pattern: A Key to Trend Reversals and Continuations
A wedge pattern is a technical chart formation that signals a potential reversal or continuation in the market. It’s formed when price moves between two converging trendlines — either sloping upward or downward — creating a narrowing range over time.
There are two main types of wedge patterns:
🔻 Falling Wedge (Bullish)
Formed during a downtrend or as a correction in an uptrend.
Characterized by lower highs and lower lows, with the slope of the support line steeper than the resistance line.
Typically signals a bullish reversal as momentum builds for a breakout to the upside.
✅ Confirmation: Break above the resistance line with volume surge.
🔺 Rising Wedge (Bearish)
Appears during an uptrend or as a correction in a downtrend.
Shows higher highs and higher lows, but the support line is steeper than the resistance line.
Often leads to a bearish reversal, especially when volume declines into the pattern.
⚠️ Confirmation: Break below the support line with increasing volume.
🧠 Key Characteristics
Volume tends to decrease as the pattern forms, indicating a pause in momentum.
The breakout direction (up or down) determines whether it’s a continuation or reversal signal.
Wedges can appear on any time frame and are useful for both day traders and long-term investors.
📊 Trading Tip
Always wait for confirmation of the breakout before entering a trade. False breakouts can be common, especially in low-volume environments
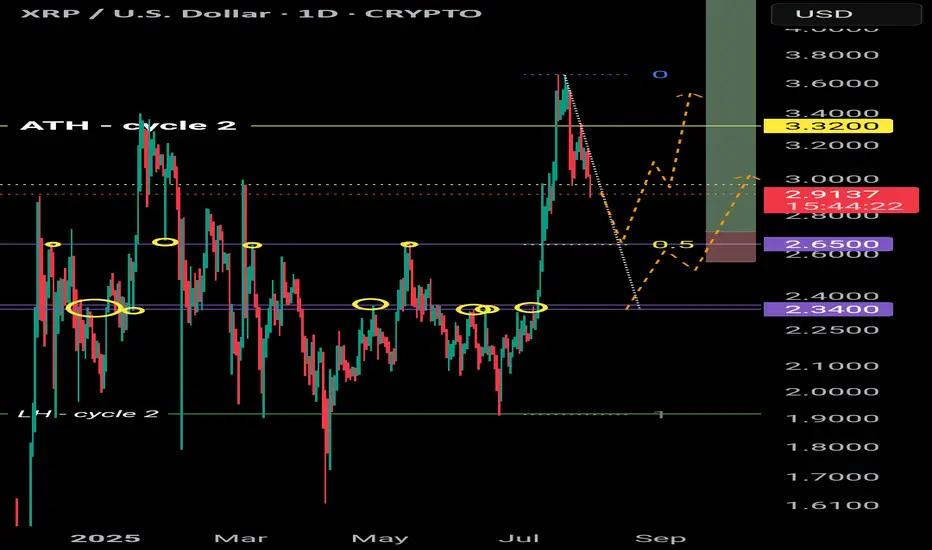
XRP retracement levelsWhere is XRP next likely to head next?
$2.65 is the next price level down with 4 points of contact. This level was also a weekly high as well as the 0.5 fibbonachi.
Next level down is $2.34 with 6 points of contact.
There is a downtrend forming so a breakout of this trend could be bullish for XRP 📈
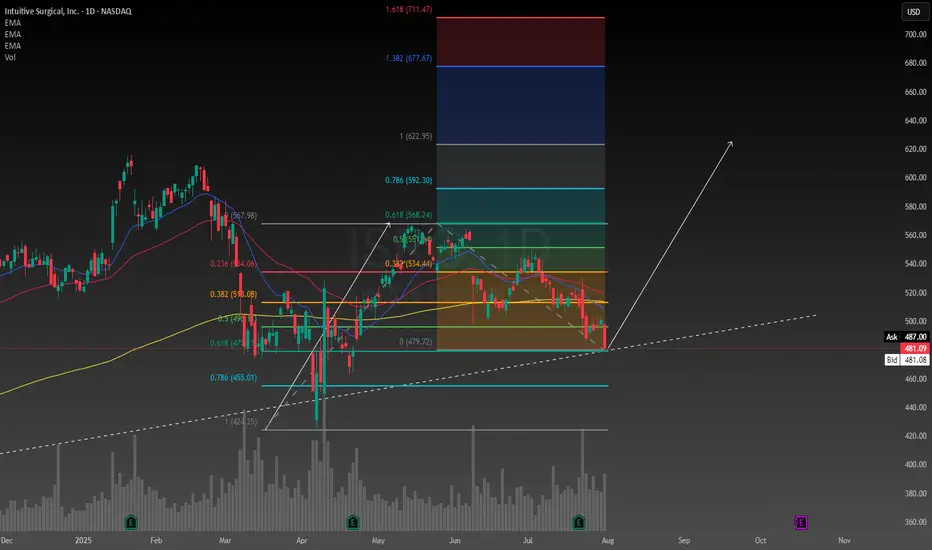
Technically Intuitive Surgical looks like it has found supportBecause I don't know much about the healthcare industry I have been avoiding it thus far. However I have done some research on Intuitive Surgical and was surprised to learn about what they do. The company is a mix between technology and healthcare, there's nobody to compete with them either which was something I found to be valuable at this time.
I have conducted a technical analysis using a trendline and a Fibonacci measurement. The risk is high, fundamentally the stock is very overvalued, but I believe this may be because of the potential the company has to grow. Every hospital is saying the same thing, they are understaffed. I feel like this company might have a positive influence to healthcare and hospitals in the future.
I have calculated the intrinsic value using the discounted cash flow model. Assuming a discount rate of 6.4%, with a 5 year exit the intrinsic value is $365. After running the numbers with a discount rate between 5.8% and 7.0% the range of the intrinsic value is between $235 and $1070 so there is clearly a potential for a significant upside. But I am taking a cautious approach because like I mentioned it is still looking over valued. I want to take the risk of owning this stock but I will monitor the company closely to make sure the fundamentals do not change as to why I decided to buy it in the first place.
I think the technical analysis I have drawn on the chart speaks for itself no need to explain much I think most people know technical analysis. I want to buy it tomorrow but I might wait a week or so to see how the tariff drama plays out and whether I can get a better deal or not I will probably enter with a stop order because I want to enter when the price is going up maybe above the next green bar on the daily we shall see I am being very cautious this time. I will start by allocating 5% of my portfolio to ISRG but that's always subject to change in the future.
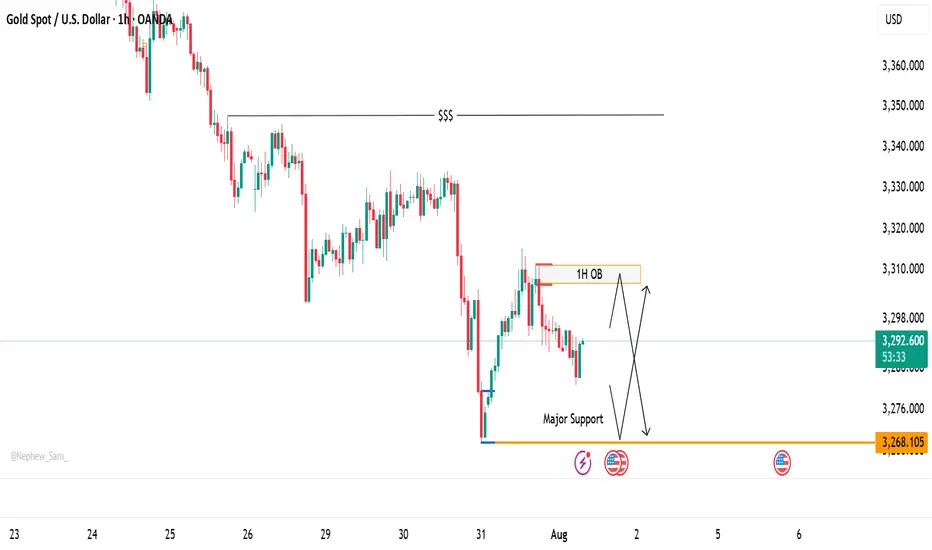
XAUUSD Price at Decision Point – Bounce or Breakdown?Gold (XAUUSD) is currently trading between two significant zones — a ⏫ 1H Order Block above and a 🛑 Major Support level at 3268.
At this stage, price action remains undecided, and we have a few key scenarios to monitor:
🔄 Potential Scenarios:
📌 Price taps into the 1H OB, then shows signs of rejection — this could trigger a move back down toward support.
⬇️ Price drops directly to 3268, where buyers may step in for a potential bounce.
🚀 If the price breaks through the OB, it may continue pushing up toward the liquidity area around 3248.
⚠️ If support fails, we could see a deeper bearish continuation.
These zones are crucial for both intraday and swing setups. Be patient and wait for a clean reaction to catch a high-probability move.
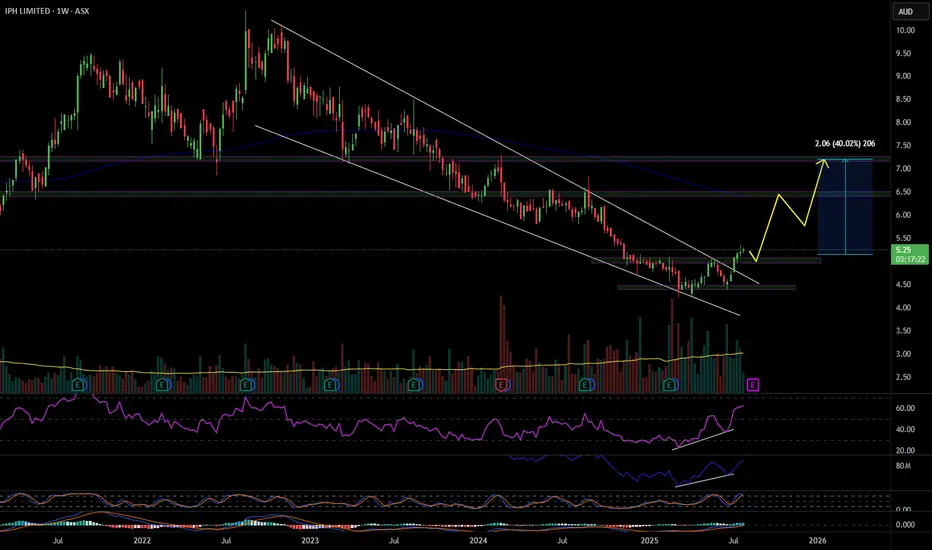
IPH 40% move coming?IPH has recently emerged from a descending wedge pattern, supported by bullish divergences in both the RSI and OBV, along with several divergences observed in shorter time frames. A pullback to the $5 level is anticipated, as the stock appears weaker on these smaller time frames. If IPH can maintain its position above the recent low of $4.40, it will indicate a structural shift, establishing higher highs and higher lows. My initial target is in the $6.50 range, followed by a potential move just above $7, representing a 40% increase. Good luck and happy trading 🍀
Oil prices rebound, maintain bullish attitude
💡Message Strategy
International oil prices continued their upward trend on Thursday, closing higher for the fourth consecutive day, as concerns about growing global supply tightness abounded. Brent crude for September delivery rose 0.4% to $73.51 a barrel, while West Texas Intermediate (WTI) crude for September delivery rose 0.5% to $70.37 a barrel, while the more active Brent October contract rose 0.4% to $72.76 a barrel.
Recently, the market has focused on the statement of US President Trump, who demanded that Russia make "substantial progress" on the situation in Ukraine within 10-12 days, otherwise he would impose 100% secondary tariffs on its trading partners, significantly bringing forward the previous 50-day deadline.
Inventory data suggests a continued struggle between supply and demand. Data from the U.S. Energy Information Administration (EIA) showed that U.S. crude oil inventories unexpectedly rose by 7.7 million barrels to 426.7 million barrels in the week ending July 25, far exceeding expectations for a 1.3 million barrel drop. However, gasoline inventories fell by 2.7 million barrels to 228.4 million barrels, exceeding market expectations for a 600,000 barrel drop.
📊Technical aspects
From a daily perspective, WTI crude oil prices have closed higher for four consecutive days since rebounding from the $66 level. It is currently running stably above the integer mark of $70 per barrel. The short-term moving average system is in a bullish arrangement, and the MACD indicator remains above the zero axis, indicating that the bullish momentum is still strong.
From an hourly perspective, if the price breaks through the previous high of $70.50, it is expected to further rise to the $73.50-$75 range. Conversely, if it continues to fall below the $70 mark, it may trigger short-term profit-taking, and further support will focus on the $68.50 level. Overall, the short-term trend remains bullish.
💰Strategy Package
Long Position:68.00-68.50,SL:67.50,Target:70.50-73.00

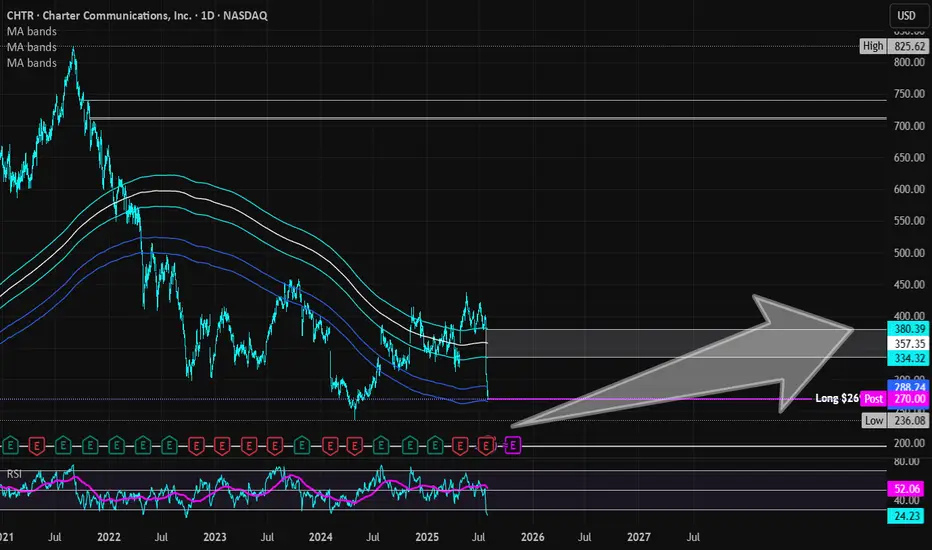
Charter Communications (Revised) | CHTR | Long at $269.50 **This is a revised analysis from December 26, 2024: . My stop was triggered in that original trade after the recent price drop (some gains were taken at 13%, as noted).**
Charter Communications NASDAQ:CHTR stock recently dropped due to a disappointing Q2 2025 earnings report, with earnings per share of $9.18 missing estimates of $9.58 and a larger-than-expected loss of 111,000 residential internet customers. Despite the recent subscriber losses and increased competition, the following factors suggest long-term growth potential:
Network Expansion: Launch of 2x1 Gbps service in eight markets in 2025, boosting competitiveness.
Rural Growth: Rural revenue projected to reach 10–15% of total revenue by 2025.
Cox Acquisition: $34.5B merger expected to close by mid-2026, yielding $500M in annual cost savings by 2028 and enhancing market share.
Mobile and AI Strategies: Strong mobile growth and AI-driven customer service tools to improve retention and efficiency.
Lower Interest Rates: Reduced bowering costs to help with profit margins.
Charter's President/CEO recently grabbed $2.5 million in shares under $300. From a technical analysis perspective, there is an open price gap near $195 that could be of concern in the near-term. I foresee that being closed if the whole market flips or more bad news for the company arises. But, with a P/E of 7x and the industry average being near 13x, I believe NASDAQ:CHTR is a good value at the moment.
Thus, at $269.50, NASDAQ:CHTR is in a personal buy zone with a note of "risk" of a drop near $195 (a second personal entry point if it hits that level before targets are reached).
Targets into 2028:
$330.00 (+22.4%)
$375.00 (+39.1%)
LKQ Corporation Quote | Chart & Forecast SummaryKey Indicators On Trade Set Up In General
1. Push Set Up
2. Range Set Up
3. Break & Retest Set Up
Notes On Session
# LKQ Corporation Quote
- Double Formation
* (Downtrend Argument)) At 45.00 USD | Subdivision 1
* (Diagonal Shift)) | Completed Survey
- Lower Band & Upper Band
- Triple Formation
* (P1)) / (P2)) & (P3)) | Subdivision 2
* Daily Time Frame | Trend Settings Condition | Subdivision 3
- (Hypothesis On Entry Bias)) | Regular Settings
* Stop Loss Feature Varies Regarding To Main Entry And Can Occur Unevenly
- Position On A 1.5RR
* Stop Loss At 32.00 USD
* Entry At 30.00 USD
* Take Profit At 24.00 USD
* (Downtrend Argument)) & No Pattern Confirmation
- Continuation Pattern | Not Valid
- Reversal Pattern | Not Valid
* Ongoing Entry & (Neutral Area))
Active Sessions On Relevant Range & Elemented Probabilities;
European-Session(Upwards) - East Coast-Session(Downwards) - Asian-Session(Ranging)
Conclusion | Trade Plan Execution & Risk Management On Demand;
Overall Consensus | Sell
MAMO Buying Opportunity🤑 CRYPTO:MAMOUSD did 3 waves pullback into extreme area $0.099 - $0.077 and as long as it holds the trendline from May low then Bulls will be looking for more upside to take place from here!

SPX500 AnalysisThis analysis is based on the 4-Hour timeframe, reversal trading, and trend formation.
If the price breaks below the white line (H&S breakout point) and closes, then my H&S pattern is complete, and I will short on its retest. I will post updates about this trade soon!

SPX500 Buy analysis/ideaThis trade is based on the 4-hour chart and executed using reversal trading, trend formation and an update on the analysis I posted on this instrument yesterday.
Complete explanation in the video!

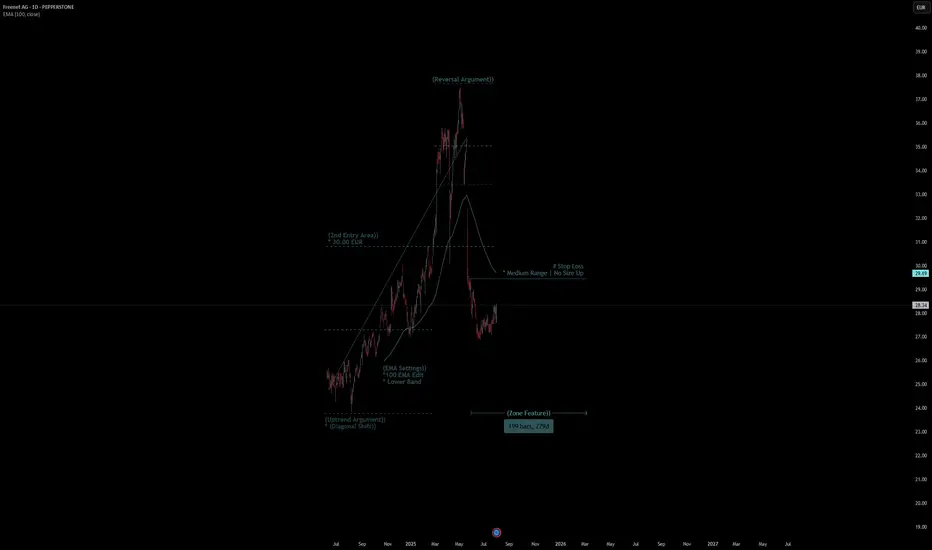
Freenet AG Quote | Chart & Forecast SummaryKey Indicators On Trade Set Up In General
1. Push Set Up
2. Range Set Up
3. Break & Retest Set Up
Notes On Session
# Freenet AG Quote
- Double Formation
* (Uptrend Argument)) - *(Diagonal Shift)) | Completed Survey
* Stop Loss - *Medium Range | No Size Up | Subdivision 1
- 199 bars, 279d | Date Range Method
- Triple Formation
* (P1)) / (P2)) & (P3)) | Subdivision 2
* Daily Time Frame | Trend Settings Condition | Subdivision 3
- (Hypothesis On Entry Bias)) | Regular Settings
- Position On A 1.5RR
* Stop Loss At 30.00 EUR
* Entry At 28.00 EUR
* Take Profit At 24.00 EUR
* (Downtrend Argument)) & No Pattern Confirmation
- Continuation Pattern | Not Valid
- Reversal Pattern | Not Valid
* Ongoing Entry & (Neutral Area))
Active Sessions On Relevant Range & Elemented Probabilities;
European-Session(Upwards) - East Coast-Session(Downwards) - Asian-Session(Ranging)
Conclusion | Trade Plan Execution & Risk Management On Demand;
Overall Consensus | Sell