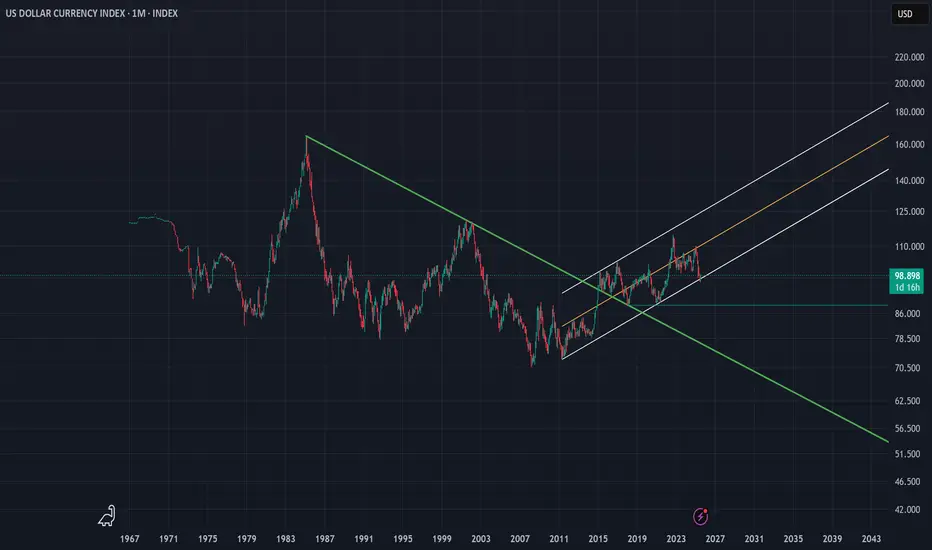
DXY | Timeframe: 1MWith the breakout of the downtrend line drawn since 1985 and its breach in late 2014, the DXY index officially entered a relatively stable upward trend and is currently oscillating within a parallel channel. Although, on the monthly timeframe, it has recently touched the lower boundary of the channel, we can expect at least a rise toward the channel’s midline. However, if the lower support of the channel is broken, a static support around the approximate rate of 88 can be considered a notable support level. Should this support also fail, the long-term downtrend dating back to 1985 would be regarded as the most important support for the DXY index. Meanwhile, moving averages such as the MA50, MA100, and other longer-period moving averages serve as dynamic supports along the way.
It is also worth mentioning that currently reaching the 120 level is considered an ideal target for the DXY index, and ultimately, it is by breaking this resistance zone that the index can reach its “Utopia”.
---------
I will try to continuously update this analysis of the TOTAL symbol according to market changes and developments. Also, I welcome reading your critiques and comments, so don’t forget to leave a comment!
Trend Lines
HSI dipping, traders are flipping,stay Zen - Index is yoga-ing!Hello everyone!
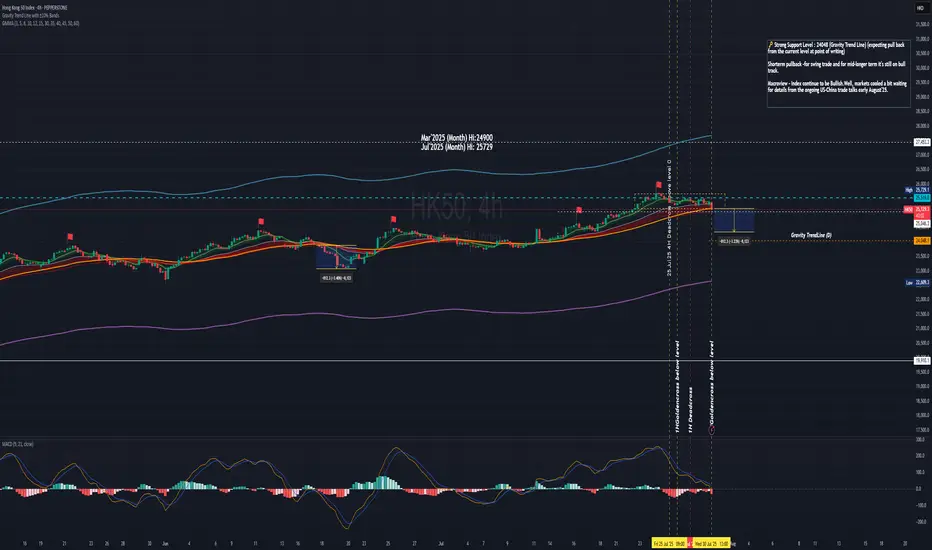
Today HK50 PEPPERSTONE:HK50 D open at 25350, Hi:25446 Lo:25164
IMO: Deep retracement is happening with profit taking from futures expiring tomorrow for traders & waiting for catalysts for talks next week.
For 4H - Index moving closer to Gravity Trend Line - look out for entry for swing (using shorter tf to entry).
At point of writing ✍️: the HK50 $PEPPERSTONE uptrend mode is on track and now in the retracing mode.
currently on D Chart -
🗝️ Resistance Level : 25300
Support Level : 24950
Support level 24558 (MA30)
🗝️ Strong Support Level : 24048 (Gravity Trend Line)
1H Chart HK50 $PEPPERSTONE
If today not able to close 25304 (25335 HSI), it's likely a deep retracement.
Shor term pullback -for swing trade and for mid-longer term it's still on bull track. Most likely people profit taking before the HSI futures expires tomorrow.
Macro view - Index continue to be Bullish. Well, markets cooled a bit waiting for details from the ongoing US-China trade talks early August'25.
Higher Hi🚩point marked in Chart HK50 $PEPPERSTONE
21May2025 -23909
11June2025 -24430
25June2025 -24531
16Jul2025 - 24842
18Jul2025 - 25052
24Jul2025 - 25729
?? ??2025 - 26163 Revised Target
The HSI Index HSI:HSI
At point of writing ✍️ Index is being sucked towards to D GravityLine - 24085; it fall below the sideway box.
If it doesn't close above the key support level this week, the deep retracement is happening.
🧨🧨🧨Pay attention and cautious.
🗝️ Next Resistance Level : 25350
🗝️ Next Support Level : 24900-25200
🗝️ Strong Support Level : 24300-24750
Let's follow your own zentradingstrategy , continue to trade; Observe your emotions as you would the clouds—passing, shifting, never you.— Mindfulness helps you respond, not react, in volatile markets and moments.
Be ease at trading!
** Please Boost 🚀, FOLLOW ✅, SHARE 🙌 and COMMENT ✍ if you enjoy this idea!
Share your trading journey here to encourage the community and friends who pursing the same journey.
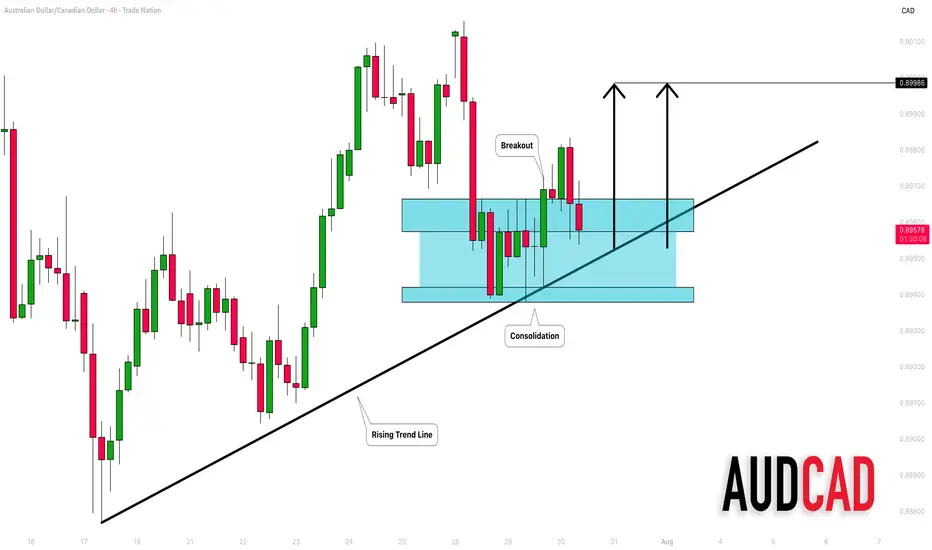
AUDCAD: Bullish Move From Trend Line 🇦🇺🇨🇦
AUDCAD may bounce from a solid rising trend line on a 4H.
The price started to consolidate on that after its test.
A breakout of a minor horizontal resistance is a strong bullish confirmation.
Goal - 0.8999
❤️Please, support my work with like, thank you!❤️
I am part of Trade Nation's Influencer program and receive a monthly fee for using their TradingView charts in my analysis.
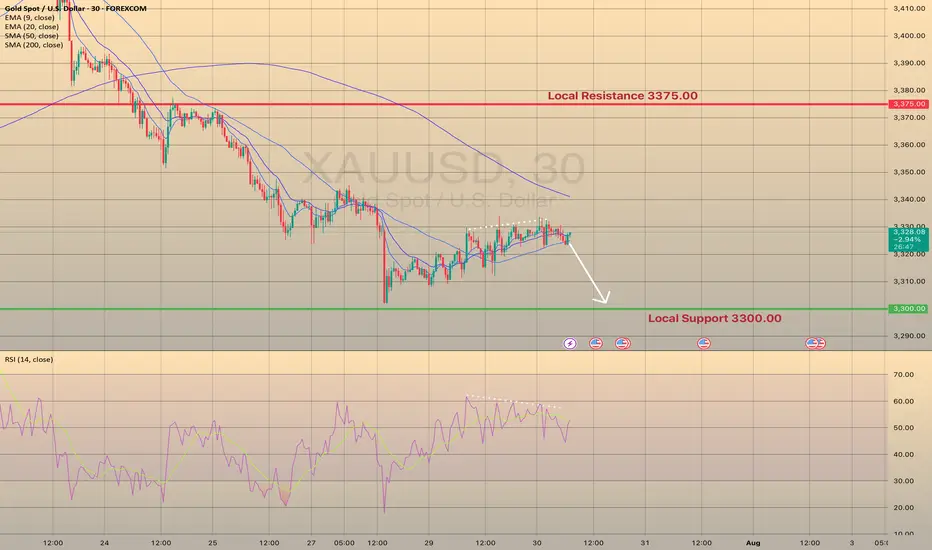
XAUUSD. MINOR UPWARDS CONSOLIDATION BEFORE THE NEXT MOVE.XAUUSD. MINOR UPWARDS CONSOLIDATION BEFORE THE NEXT MOVE.
XAUUSD rebounded from local support level of 3,300.00 and attempted to develop some bullish momentum here yesterday. However, the price went into consolidation, showing us the weakness of this short-term bullish rebound. RSI shows the bearish divergence, the price is ready to drop. Of course, fundamentals of last couple of days don't favor this asset either. The decline towards support level of 3,300.00 is expected.
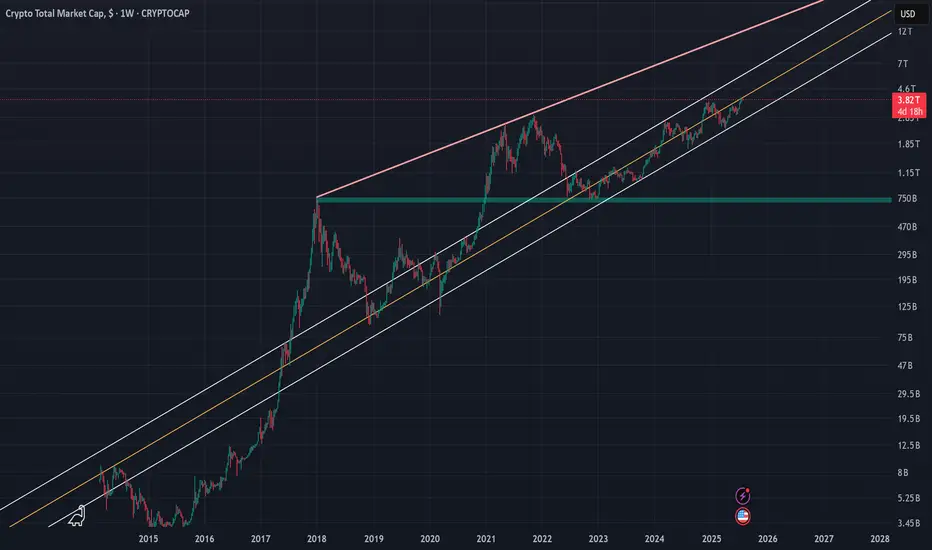
Crypto Total Market Cap (TOTAL) | 1WThe crypto market cap represented by the symbol TOTAL can be considered the most important index for analyzing the cryptocurrency market, although I believe that analyzing Bitcoin itself, given its strong positive correlation with the TOTAL index, would yield similar results. In the attached image, the red line actually indicates the overall resistance level of the symbol, and the drawn parallel channel illustrates the current upward trend of the TOTAL symbol, which is now on the verge of encountering its round resistance at 4 trillion dollars. While we should expect a correction around this level, breaking through the 4 trillion dollar resistance could likely lead to a market cap of 6 to 7 trillion dollars in the next phase. On the other hand, with support at 2.4 trillion dollars based on the 100-week SMA on the weekly timeframe, the 750 billion dollar level—marked by a green zone in the image—can still be considered the most important long-term market support, even before the fifth halving.
I will try to continuously update this analysis of the TOTAL symbol according to market changes and developments. Also, I welcome reading your critiques and comments, so don’t forget to leave a comment!
could continue to trendI am still fairly new to trading. It took my quite some time to analyze this chart, it was a trend, then it became a ranged market. I had difficulty finding a support, however, i did find my middle support, it is the black line, it could possible drop there, or, it would stay in my green support

AUDUSD InsightHello to all subscribers.
Please share your personal opinions in the comments. Don’t forget to like and subscribe!
Key Points
- According to the U.S. June Job Openings and Labor Turnover Survey (JOLTS), the seasonally adjusted number of job openings was 7.437 million, a decrease of 275,000 from the previous month, falling short of the market expectation of 7.55 million.
- During high-level talks between the U.S. and China held in Stockholm, Sweden, both sides reportedly agreed to extend the tariff suspension measure for an additional 90 days.
- While the Federal Reserve is expected to hold rates steady in the July FOMC meeting, there is growing anticipation for a dovish stance suggesting a possible rate cut in September.
This Week's Major Economic Events
+ July 30: Germany Q2 GDP, U.S. ADP Nonfarm Employment Change (July), U.S. Q2 GDP, Bank of Canada rate decision, FOMC meeting results announcement
+ July 31: Bank of Japan rate decision, Germany July Consumer Price Index (CPI), U.S. June Personal Consumption Expenditures (PCE) Price Index
+ August 1: Eurozone July CPI, U.S. July Nonfarm Payrolls, U.S. July Unemployment Rate
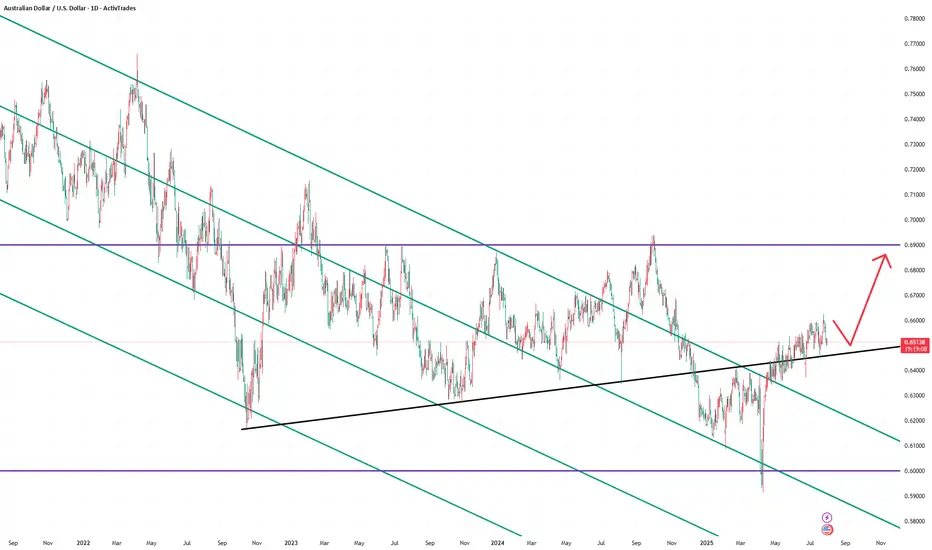
AUDUSD Chart Analysis
The pair recently climbed above the 0.66000 level but has since reversed, giving back gains. However, both higher highs and higher lows are being established, suggesting the current pullback is part of a gradual uptrend. A continued bullish outlook is expected over the long term, with a projected high around the 0.69000 level.
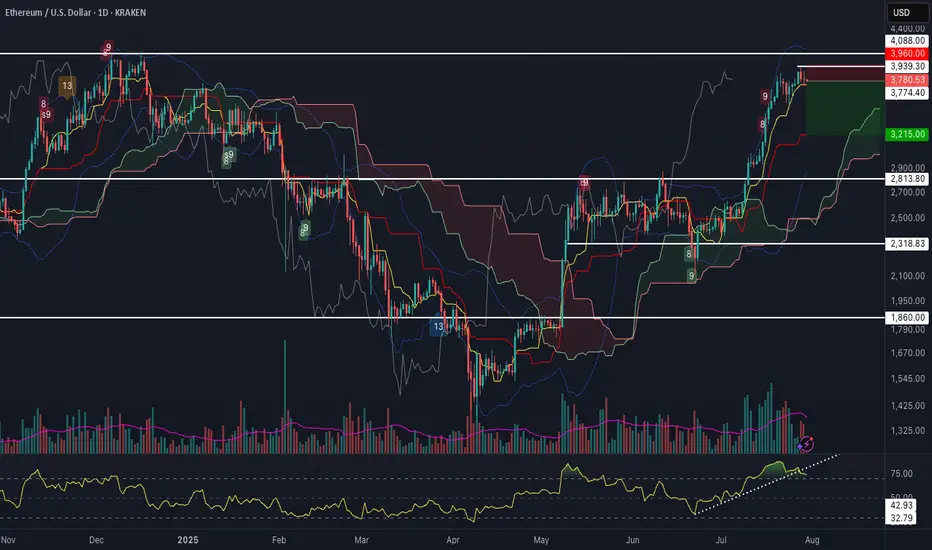
ETH Potential Swing ReversalAfter a strong leg higher, Ethereum is flashing a confluence of short-term reversal signals:
1. RSI trendline break on the daily, with bearish divergence building
2. %B Bollinger Band divergence, following three consecutive upper band taps during this move
3. Demark 9
4. Formation of a Doji candle at resistance, showing indecision near a key level
A clean break here opens room towards Ichimoku cloud support at $3,215.
🧠 Thoughts welcome!
Crude oil starts to rise, are you ready?
💡Message Strategy
Oil prices continued their upward trend amid rising geopolitical risks. US President Trump recently issued a tough statement, demanding Russia end the conflict with Ukraine within 10 to 12 days or face secondary sanctions.
Fears that Russian crude oil exports might be disrupted pushed Brent crude oil prices close to $70 per barrel, marking their largest single-day gain in two weeks at 2.3%. Meanwhile, US West Texas Intermediate (WTI) crude oil prices also remained stable around $67.
The intertwined uncertainties of geopolitics and trade policy have complicated market sentiment. Besides the situation between Russia and Ukraine, investors are closely watching the August 1st trade policy deadline set by the United States and the upcoming OPEC+ meeting in early August, which will determine its September crude oil production increase plan.
The industry generally expects that despite tight crude oil inventories in some parts of the world and strong peak season consumption in the Northern Hemisphere, if OPEC+ continues to increase production, oversupply pressure will gradually emerge by the end of the year.
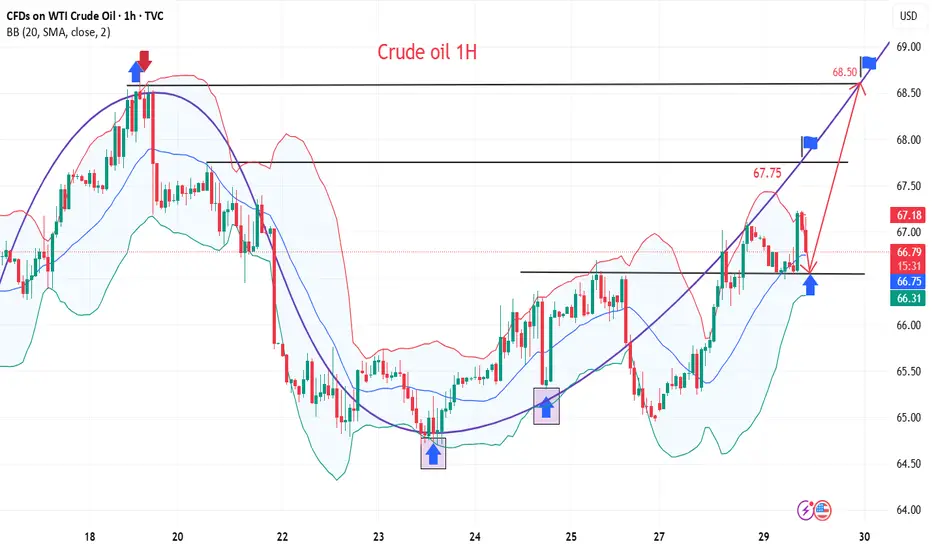
📊Technical aspects
From a technical perspective, the daily chart of US crude oil (WTI) shows a modest upward trend. The current price is trading steadily above its 100-day moving average, indicating continued bullish momentum.
The Relative Strength Index (RSI) remains between 55 and 60, remaining within overbought territory, suggesting further upside potential. A successful break above the key resistance level of $68.50 would open up opportunities towards $70.
💰Strategy Package
Long Position:66.50-67.00,SL:65.50,Target:68.50-69.00
XAGUSD | Silver Rebounds from 37.50 After 39.50 RejectionSilver pulled back sharply after failing at the 39.50 resistance zone. Price is currently consolidating just above the 37.50 support area, which has held firm on the initial retest.
Support at: 37.50 / 37.00 🔽
Resistance at: 39.50 🔼
🔎 Bias:
🔼 Bullish: A clean breakout above 39.50 could resume the uptrend.
🔽 Bearish: A break below 37.50 opens room toward 37.00 and 36.00.
📛 Disclaimer: This is not financial advice. Trade at your own risk.

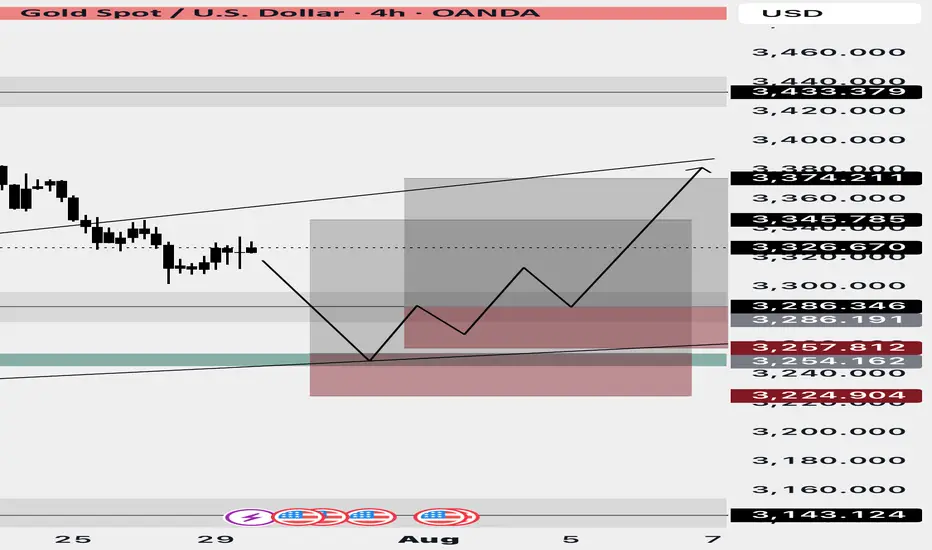
XAUUSD BUYS PROJECTION Hey everyone wow is been long since I posted here I can say for sure trading has never been so tougher for me cuz am tryna refine my edge and I miss posting and sharing my ideas here so this is my analysis on Gold after seeing Gold rejected a strong resistance zone and price keeps pushing down tho I missed the sells but market is always full of opportunity and here are my zones to take buys from,mind you these zone are very strong support zones that mostly buyers get in the market so I will be waiting for price to get to the first zone which is the green and the second is for scaling in after placing the first on breakeven and yes I will update you guys…..
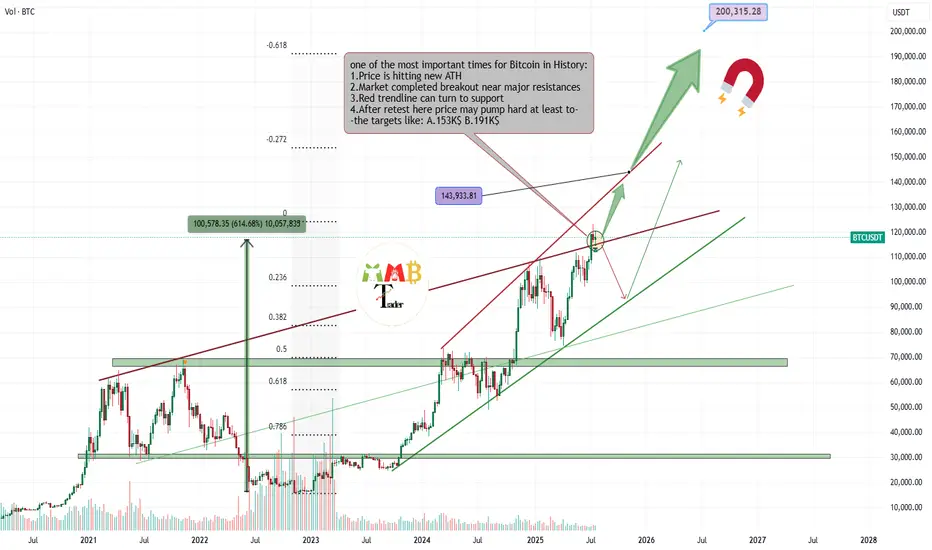
Bitcoin is getting Ready for 143K$ nowMajor red resistance trendline is now broken also last week the retest is completed now price is range for a while for new week to start and fresh volume and buys that make path easier to reach above 140K$.
Get ready and take a look at important zones at chart and possible scenarios which are all mentioned.
DISCLAIMER: ((trade based on your own decision))
<<press like👍 if you enjoy💚
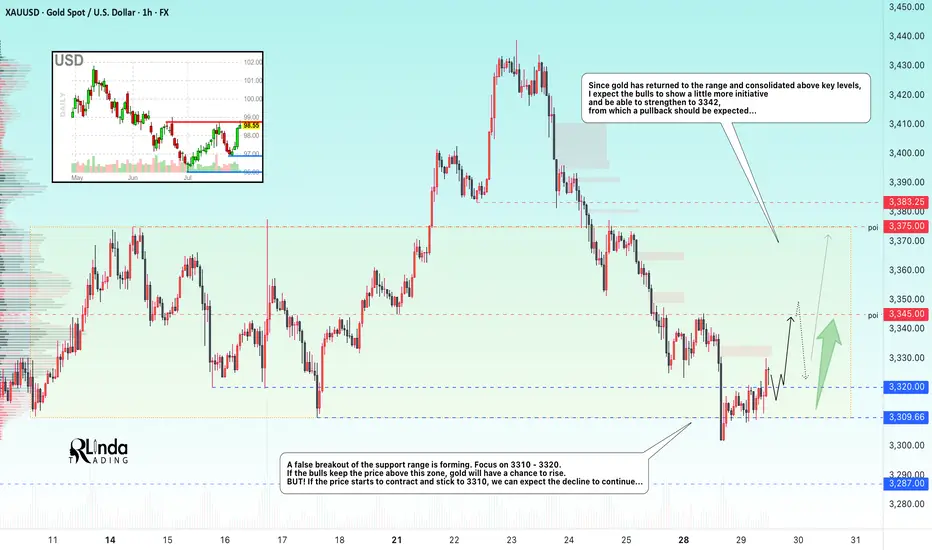
GOLD → Formation of a trading range. 3345?FX:XAUUSD confirms support for the local range. A false breakdown has formed and the price has returned to the buying zone. We are waiting for the bulls to take the initiative...
Gold is trying to recover after falling to $3302, remaining under pressure ahead of key events in the US: the publication of GDP data and the Fed's decision on interest rates. Support is provided by a pause in the dollar's growth, expectations of an extension of the US-China trade truce, and growing demand for safe-haven assets amid a surge in oil prices due to the threat of new sanctions against Russia. However, the sustainability of growth is in question: the dollar may strengthen thanks to optimism about the US economy and progress in negotiations.
A false breakdown of the support range is forming. Focus on 3310-3320. If the bulls keep the price above this zone, gold will have a chance to grow. BUT! If the price starts to contract and stick to 3310, we can expect the decline to continue...
Resistance levels: 3345, 3375
Support levels: 3320, 3310, 3287
The two-day movement has most likely exhausted its potential, or the market has decided to recover slightly due to the unpredictability factor. A false breakdown of support could trigger a pullback to the strong level of 3345, from which a rebound could form (either before growth or before the continuation of the decline; it is necessary to monitor the reaction and the market background...).
Best regards, R. Linda!
Intel looks to want $13Intel looks to be waiting below $24 resistance for $13 support. I wouldn't short it at it's current price, but I would be patient and wait for $13 if you're looking to buy. Good luck!

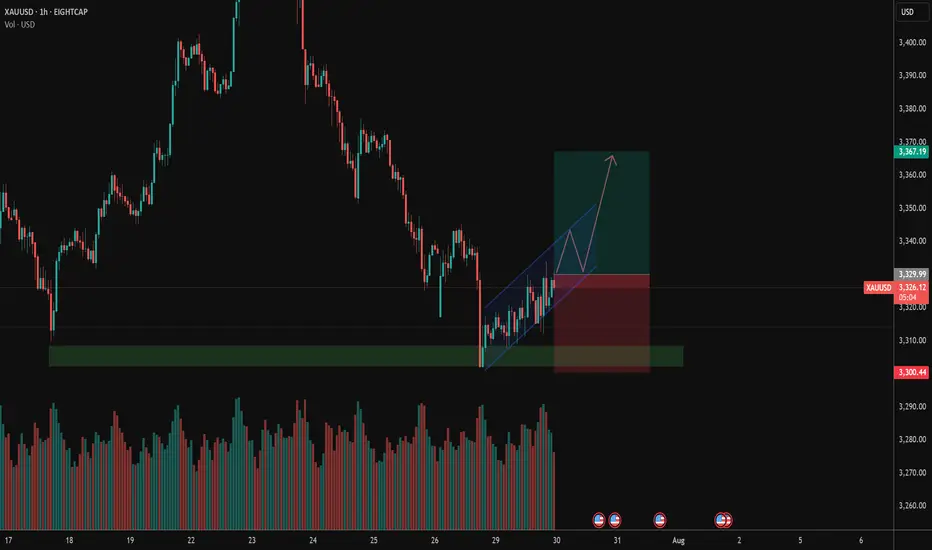
XAUUSD go for long!Hi all
After hitting the support zone its quite obvious that XAUUSD will increase! and we can go for long!!
Currently its double bottom, but it may go for third!
Note: am new trader and not an expert!! Please stick with your thoughts and analysis if its against mine!
Am sharing my thoughts and all depend on my analysis!
Please let me know if you agree or disagree with me!
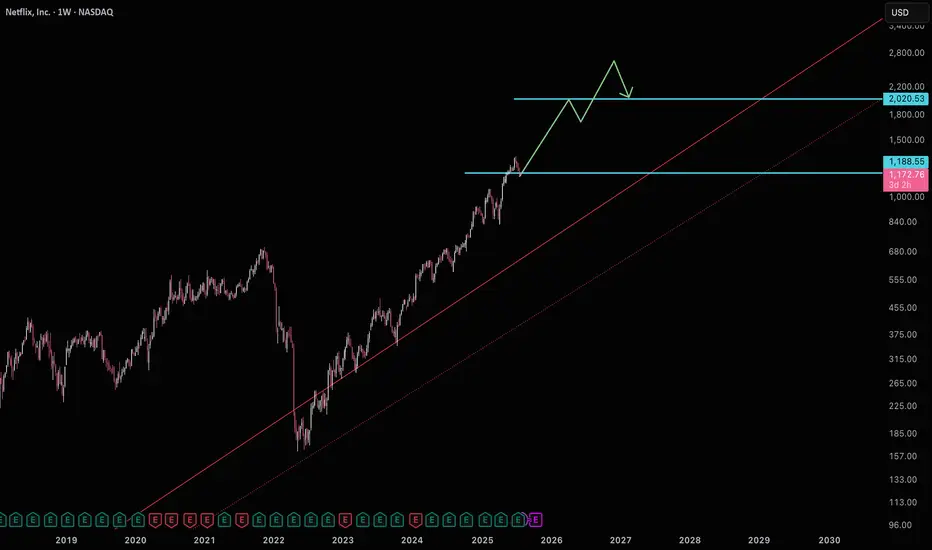
Netflix building support for $2000Netflix is currently sitting on support getting ready for a move to $2000.
Good luck!
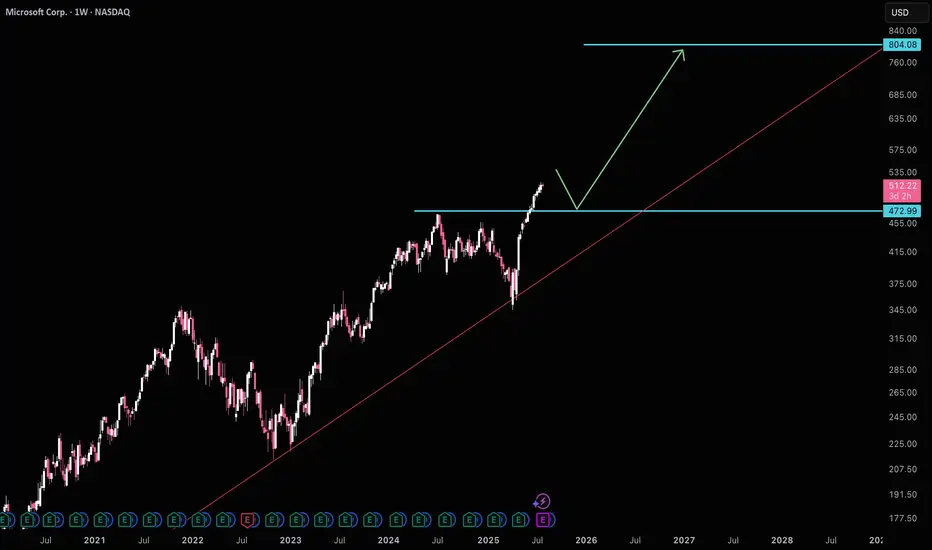
Mircrosoft wants to pullback to $470MSFT is likely to test $470 support before making it's move to $800. Another thing to be weary about is ratio MSFT/AAPL is at historical avg highs, which usually signals a bias towards AAPL. Waiting for $470 is a good idea before getting long again.
Good luck!
GRTUSDT Triangle Coil Tension Builds Bullish Breakout in FocusGRTUSDT is forming a clean symmetrical triangle with price rebounding from the lower trendline which brings an encouraging signal for potential continuation to the upside.
As long as the structure holds, we anticipate a breakout above the triangle, which could ignite strong bullish momentum. The external demand zone remains ideal for strategic accumulation, while the internal supply area should be monitored for signs of short-term rejection.
If buyers absorb pressure at that level, GRT could rally toward the crucial upper supply zone, which marks the next major area for distribution. Let’s see how this unfolds, feel free to share your perspective.

BTC's latest trading strategy and analysis layout#BTCUSD
BTC's current technical signals show a bull-bear tug-of-war situation.If a golden cross is formed near the zero axis, it may indicate a new wave of rise; if it falls below the zero axis, we need to be wary of a deep correction.
There are certain opportunities for both bulls and bears in the current market, but global regulatory policies have not yet been unified. Policies such as the US "GENIUS Act" may affect BTC and require continued attention. BTC is currently facing significant buying support around 117,500, but the hourly chart shows that there is still potential for a continued pullback. The current trend has not yet finished. Pay attention to the support level of 116,000 below. If it falls below, it may fall into the consolidation range of 116,000-114,000. For aggressive traders, consider going long at 117,500-116,500, with a target of 118,500-119,500. A break above this level could lead to 120,000.
🚀 117500-116500
🚀 118500-119500

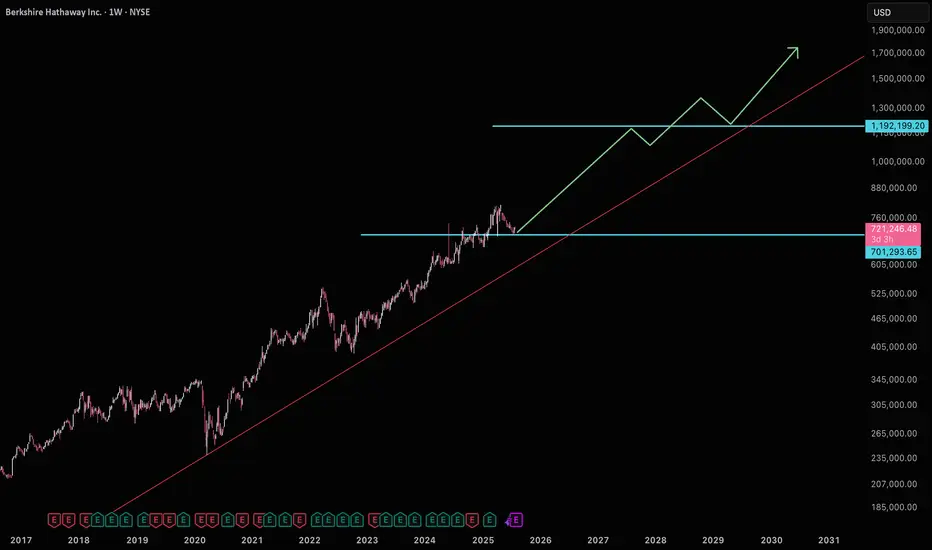
BRK.A on it's way to $1.2mm sitting on strong supportBerkshire is not far off it's long term trend sitting near major support. It's poised to start it's move to $1.2mm where next resistance is. Good luck!
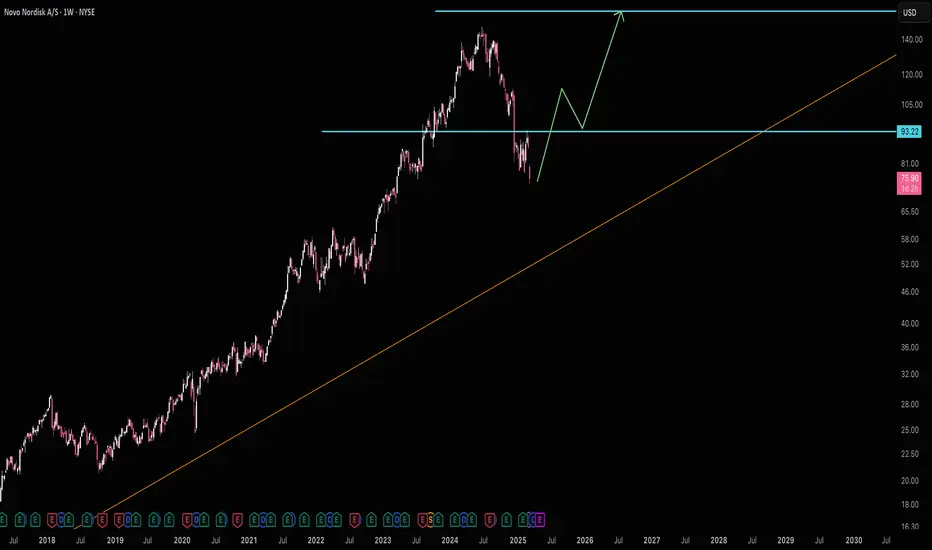
Novo Nordisk on Fire Sale!This megaphone pattern below support makes me think this 20pe ratio stock is looking to reclaim support and run back up to $158.
Good luck!
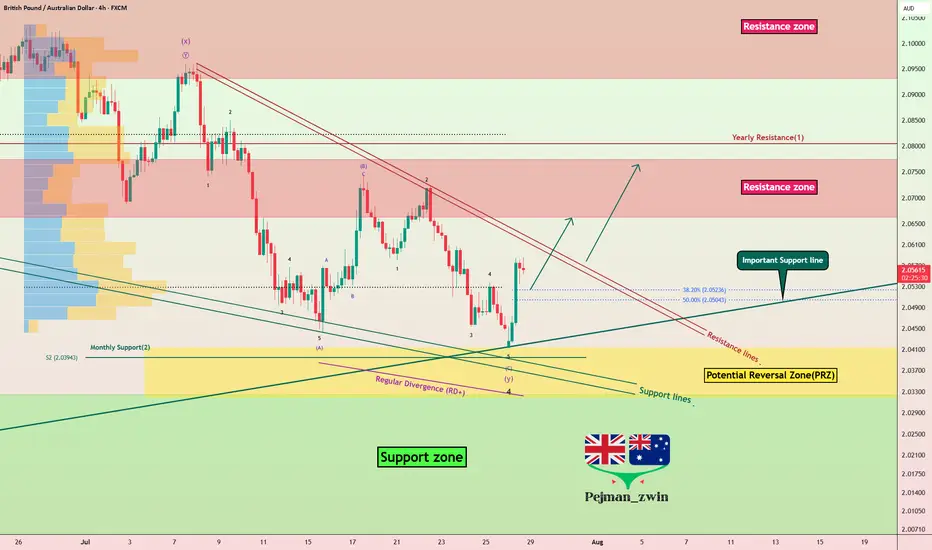
GBPAUD Reverses from Key Zone – Long Setup in Play!Today I want to share with you a Long position on GBPAUD ( OANDA:GBPAUD ).
GBPAUD started to rise well from the Important Support line , Support zone(2.032 AUD-1.987 AUD) , and Potential Reversal Zone(PRZ) and managed to close the 4-hour candle above 2.053 AUD (important) .
In terms of Elliott wave theory , GBPAUD seems to have completed the main wave 4 . The main wave 4 structure was a Double Three Correction(WXY) .
Also, along the way, we can see a Bullish Marubozu candle , which could indicate a continuation of the uptrend .
I expect GBPAUD to break the Resistance lines soon and attack the Resistance zone(2.078 AUD-2.066 AUD) .
First Target: 2.065 AUD
Second Target: 2.076 AUD
Note: Stop Loss(SL): 2.040 =Worst SL
Please respect each other's ideas and express them politely if you agree or disagree.
British Pound/ Australian Dollar Analyze (GBPAUD), 4-hour time frame.
Be sure to follow the updated ideas.
Do not forget to put a Stop loss for your positions (For every position you want to open).
Please follow your strategy and updates; this is just my Idea, and I will gladly see your ideas in this post.
Please do not forget the ✅' like '✅ button 🙏😊 & Share it with your friends; thanks, and Trade safe.
ACET TOKEN (ACTBUSD): Bullish Outlook ExplainedThe ACET TOKEN appears to be gearing up for a bullish trend, making it an ideal time to invest.
Upon examining the daily chart, I identified a symmetric triangle pattern and a confirmed breakout above the resistance line.
The final hurdle for buyers lies within the 0.10155 - 0.09256 resistance range.
If the bulls manage to break and close above this level, it will signal a significant bullish indication, likely leading to a continuation towards at least 0.14000.
