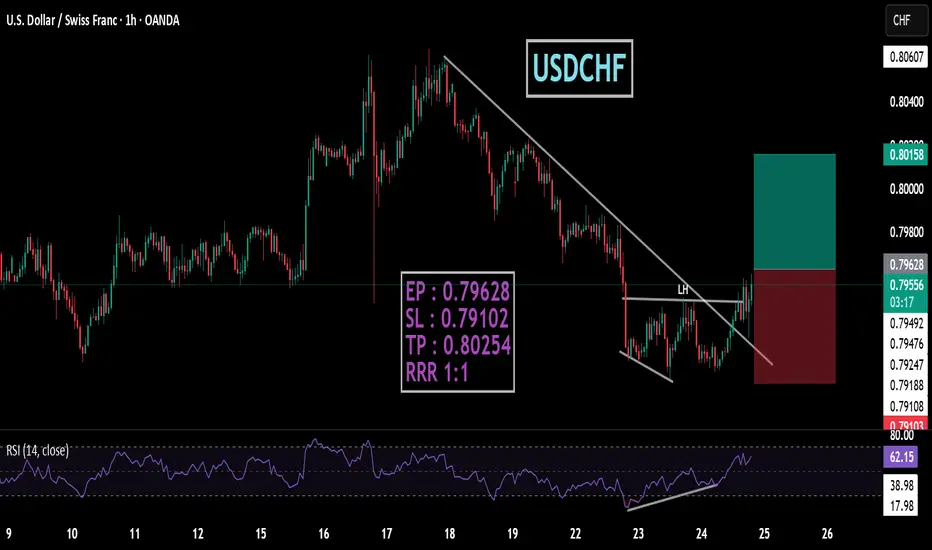
USDCHFtrendline breakout also divergence break last LH
EP : 0.79628
SL : 0.79102
TP : 0.80254
RRR 1:1
Trend Lines
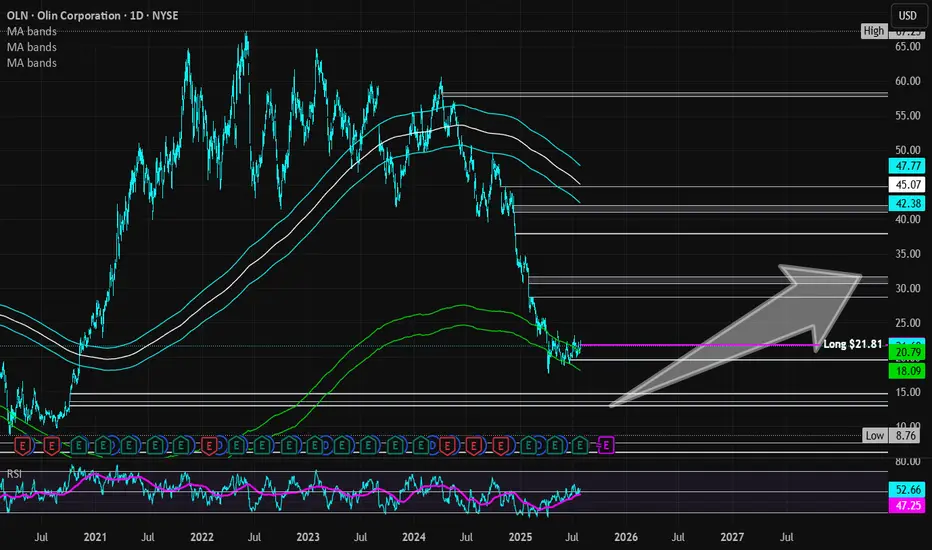
Olin Corporation | OLIN | Long at $21.81Olin Corp NYSE:OLN is currently trading within my "crash" simple moving average area (green lines on the chart). Historically, the price trades within this area for the company, consolidates, and then moves up. After today's earnings, which were relatively positive, the stock may gain some traction and move up. However, I am cautious a media-heightened economic downturn could send NYSE:OLN (a global manufacturer of chemical products and ammunition) to $13 to close the existing price gaps on the daily chart. Regardless, it's a strong company that has been trading on the US stock exchange since the mid-1970s - it's seen rough times before. While 2025 is likely to be a tough year, future earnings projections predict robust earnings growth. Time will tell...
Thus, at $21.81, NYSE:OLN is in a personal buy-zone with noted caution if there is an economic downturn down to $13 a share. The price gap around $19 may also be closed in the near-term.
Targets into 2028:
$28.00 (+28.4%)
$31.50 (+44.4%)
European session under pressure 3321 continue to shortI reminded everyone last night that if gold holds the 3300 mark, it will consolidate in the 3300-3345 range in the short term. The current gold price basically fluctuates narrowly between 3320-3310. Judging from the daily chart, the short-term upper pressure is at 3330. Only if the daily line stands firmly above 3330, there is a possibility of a rebound upward in the short term. Judging from the hourly chart, gold is still in a downward trend, and the hourly line is blocked near 3321. In the short term, if it cannot break through 3320-3330, gold will continue to fall. You can consider shorting, with the target at 3310-3300. If the European session is still volatile, maintain high shorts and low longs to participate in the cycle.
My premium privileges are about to expire, and subsequent trading strategies and analysis will be published in the group.

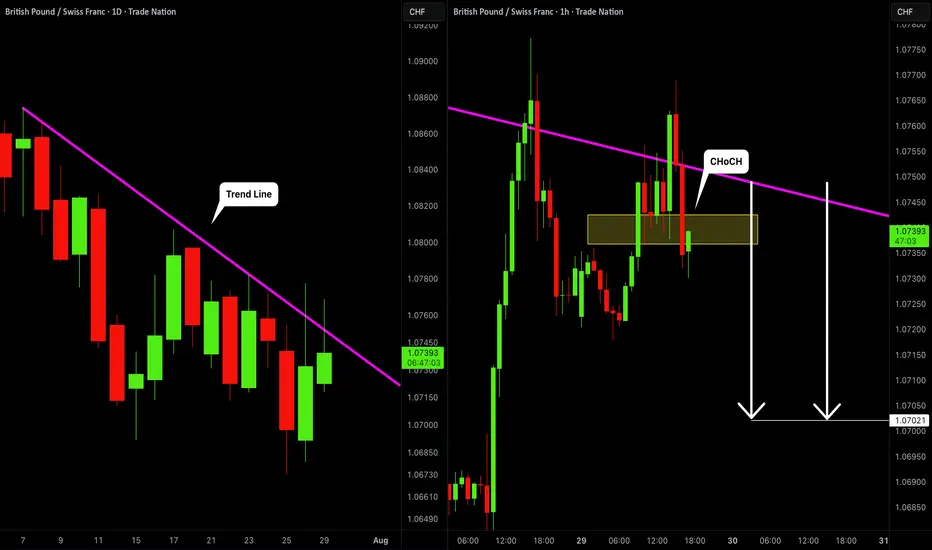
GBPCHF: Bearish Movement Confirmed 🇬🇧🇨🇭
GBPCHF looks bearish after the news today.
The price tested a solid rising trend line on a daily
and formed a confirmed bearish Change of Character
on an hourly time frame.
I think that the price will continue falling and reach 1.0702 level.
❤️Please, support my work with like, thank you!❤️
I am part of Trade Nation's Influencer program and receive a monthly fee for using their TradingView charts in my analysis.
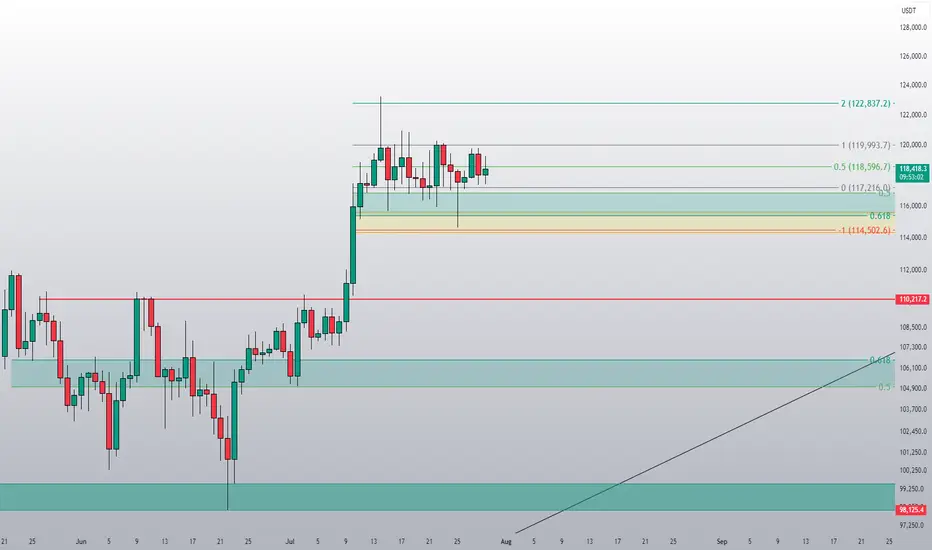
The trend is your friend...BTC is moving within a clear range on the daily timeframe. Since we are in an underlying uptrend, the current range is bullish. A downside fakeout would be typical and could potentially fill the CME gap, but we would remain bullish.
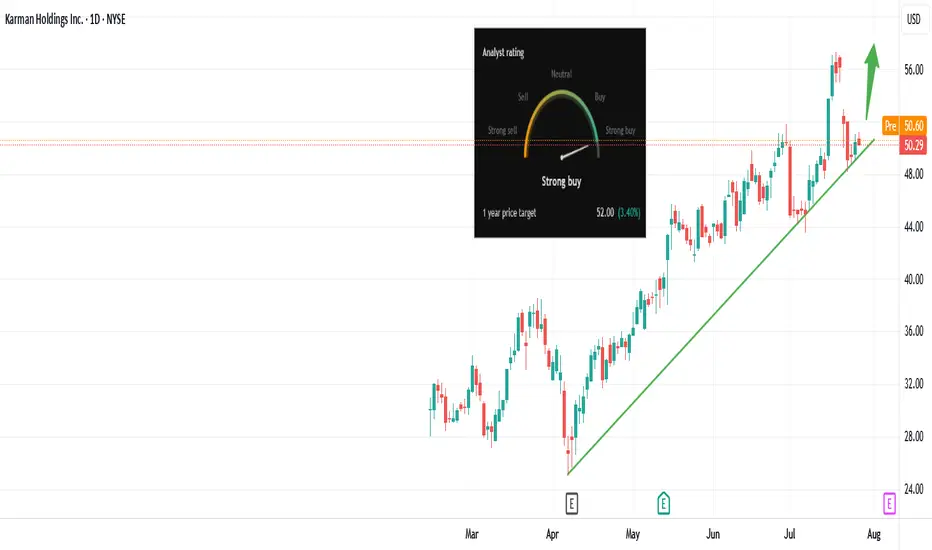
Bullish Momentum Building: KARMAN Eyes Powerful Upside Break!Trade Summary
Setup: Bullish trendline support + “Strong Buy” analyst rating + Eyeing breakout above recent high
Entry: Buy on breakout above $52.05 (Wednesday’s high)
Stop-loss: Below trendline support at $49.80
Targets: Gap fill at $55.00
Risk/Reward: ~1:1.9
Technical Rationale
📈 Uptrend Intact: Price holding higher lows above rising trendline since April
⭐ Strong Buy Rating: Analysts set 1-year target at $52.00 (+3.4%), signaling upside confidence
🔍 Pattern: Ascending triangle, breakout trigger at $52.05 on daily timeframe
Catalysts & Context
📰 “Strong Buy” consensus, price target upgrade by analysts
🔔 Sector strength in large-cap holding companies
📊 Macro backdrop: Market rotation into value/growth names, risk appetite rising
Trade Management Plan
Entry: Triggered on daily close above $52.05
Stop-loss: Hard stop at $49.80; trail to breakeven if price closes above $53
Scaling: Take 50% profit at $54.00, hold rest for full gap fill at $55.00
Poll
What’s your view? Are you watching KARMAN? Comment below or vote:
🔼 Bullish
🔽 Bearish
🔄 Waiting for confirmation
Follow us for more high-conviction trade ideas & daily setups! 🚨
Disclaimer: Not financial advice. Trade at your own risk.
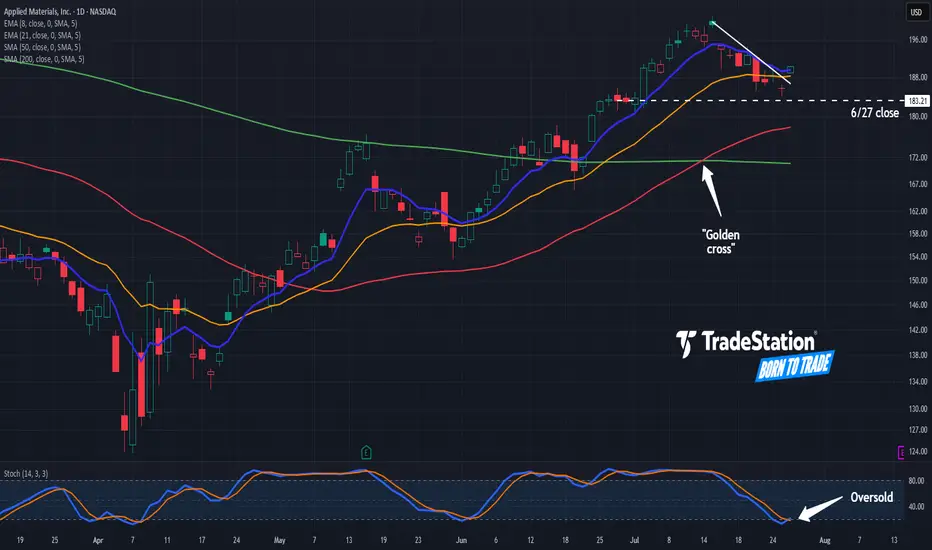
Applied Materials: Trendline Breakout?Applied Materials recently hit a nine-month high, and now it’s pulled back.
The first pattern on today’s chart is June 27's weekly close of $183.21. The chip-equipment company has bounced above that level, which may suggest new support is in place.
Second is the series of lower highs since mid-July. AMAT began this week by jumping above that trendline. Could the move be viewed as a breakout?
Third, stochastics are rebounding from an oversold condition.
Fourth, the 8-day exponential moving average (EMA) has remained above the 21-day EMA. The 50-day simple moving average (SMA) also had a “golden cross” above the 200-day SMA about two weeks ago. Those patterns may be consistent with bullish trends in the short and long terms.
TradeStation has, for decades, advanced the trading industry, providing access to stocks, options and futures. If you're born to trade, we could be for you. See our Overview for more.
Past performance, whether actual or indicated by historical tests of strategies, is no guarantee of future performance or success. There is a possibility that you may sustain a loss equal to or greater than your entire investment regardless of which asset class you trade (equities, options or futures); therefore, you should not invest or risk money that you cannot afford to lose. Online trading is not suitable for all investors. View the document titled Characteristics and Risks of Standardized Options at www.TradeStation.com . Before trading any asset class, customers must read the relevant risk disclosure statements on www.TradeStation.com . System access and trade placement and execution may be delayed or fail due to market volatility and volume, quote delays, system and software errors, Internet traffic, outages and other factors.
Securities and futures trading is offered to self-directed customers by TradeStation Securities, Inc., a broker-dealer registered with the Securities and Exchange Commission and a futures commission merchant licensed with the Commodity Futures Trading Commission). TradeStation Securities is a member of the Financial Industry Regulatory Authority, the National Futures Association, and a number of exchanges.
TradeStation Securities, Inc. and TradeStation Technologies, Inc. are each wholly owned subsidiaries of TradeStation Group, Inc., both operating, and providing products and services, under the TradeStation brand and trademark. When applying for, or purchasing, accounts, subscriptions, products and services, it is important that you know which company you will be dealing with. Visit www.TradeStation.com for further important information explaining what this means.
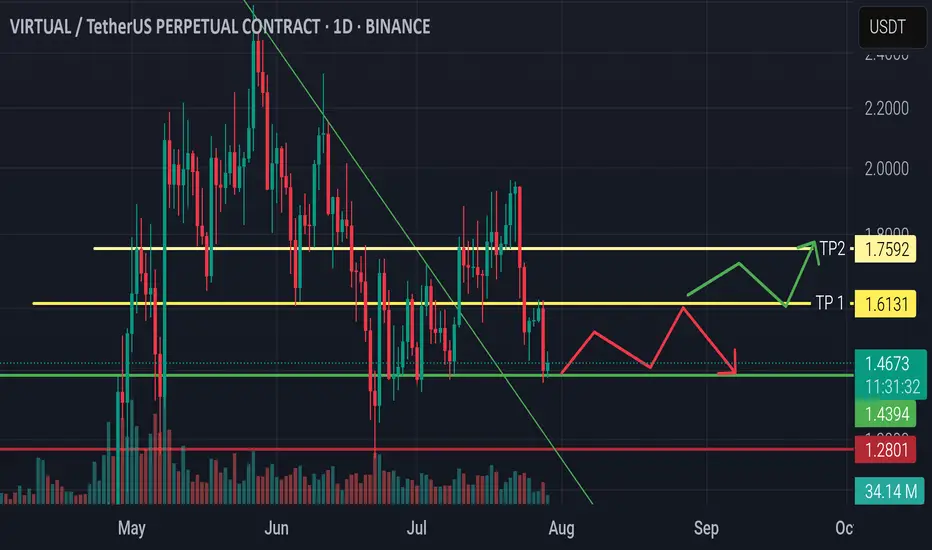
VIRTUAL/USDT – Daily Technical AnalysisThe current price is 1.4578 USDT, showing a slight increase of +0.52%. Here’s what we’re watching:
✅ Potential Entry Point: Near the previous support level at 1.2801 USDT.
🎯 Target Levels: ▪ TP1: 1.6131 ▪ TP2: 1.7592
🔄 Expected Scenarios: If the price holds above the support level, an upward move is anticipated (green path). In case of a drop, a corrective move could follow (red path).
📊 Volume remains steady, and technical indicators suggest a bullish outlook—provided the next resistance is breached.
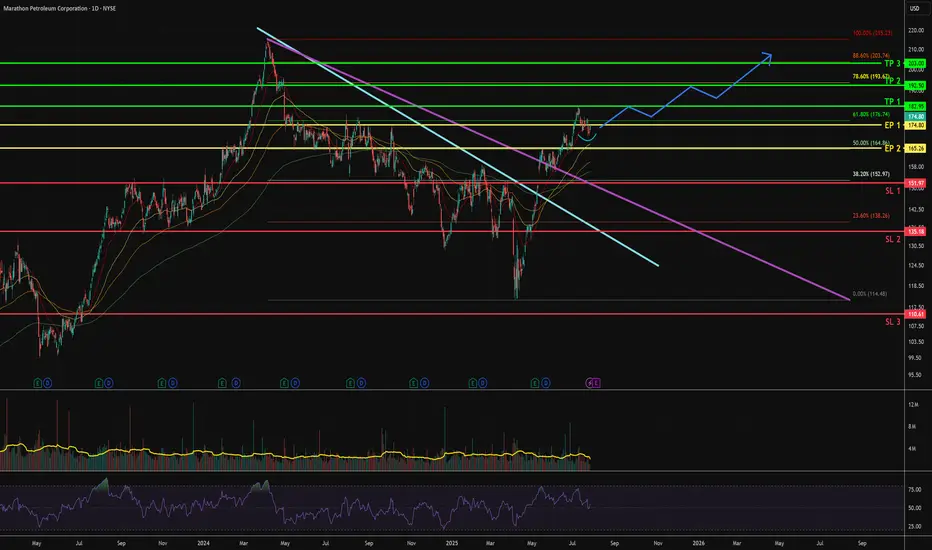
MPC - Upside swing [ 1 to 3 months ]1. Downtrend line of 11 months is broken
- Price gapped up, and sustained above Fib 38.2% and 50%.
- This concludes the end of bear trap and the switch from bear to bull trend.
2. In the last month, weak selling pressure is noticed.
- Rounding bottom above previous 1D resistance at $171.50
- Closes are creeping near to Fib 61.8%
- Flipping to bullish stance
3. Entry points
EP 1 - buy spot with 1 or 0.5 size
EP 2 - Enter another 1 or 0.5 size if closing prices stay above Fib 50% at $164.8
The latest trend analysis and layout of the day,flexible adoptio#XAUUSD
⚠️News focus on the Sino-US trade talks, which may affect the gold trend.
Since the opening of the market today, gold has been fluctuating in a narrow range in the short term, without giving a clear trading direction🤔, and the short-term trend has not changed much.📊
🚦It remains constrained by resistance and a downward trend. In the short term, we need to pay attention to the 3300 mark below and the support of 3295-3285📈. On the upside, we should pay attention to the short-term suppression level of 3321-3333 and yesterday's high of 3345-3350.📉
In the short term, as long as it does not break through yesterday's high point, the volatile downward trend will not change. 🐂Once it breaks through, the short-term decline will stop, and the market will continue the bull rebound to test 3370~3380 or even 3400 before falling again.
Therefore, short-term trading focuses on the 3300 mark below and the long trading opportunities at 3295-3285. On the upside, defend the 3345-3350 highs and establish short positions.🎯
🚀 BUY 3310-3330
🚀 TP 3321-3333
🚀 BUY 3295-3285
🚀 TP 3310-3330
🚀 SELL 3320-3330
🚀 TP 3310-3300
🚀 SELL 3345-3350
🚀 TP 3330-3285

XAUUSD Eyeing Liquidity Grab – M30 OB Zone in PlayPrice is respecting the ascending trendline and consolidating near a key resistance level. A bullish breakout is expected, with a potential retest of the trendline and the M30 Order Block (OB) zone acting as a key demand area.
📈 Trade Plan:
Wait for a minor pullback into the OB and trendline confluence
Look for bullish confirmation to go long
Target the liquidity zone above (around 3347)
📌 A clean structure and bullish order flow hint at a continuation to the upside.

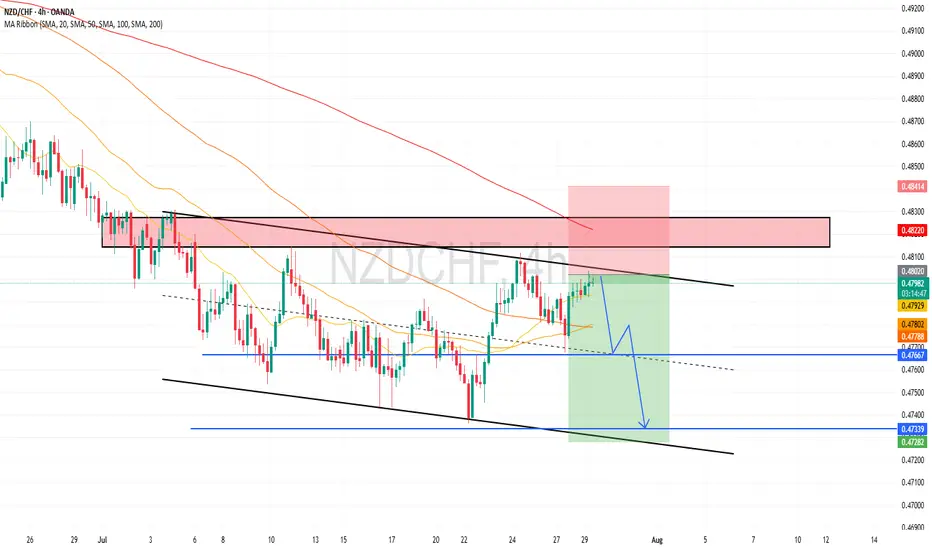
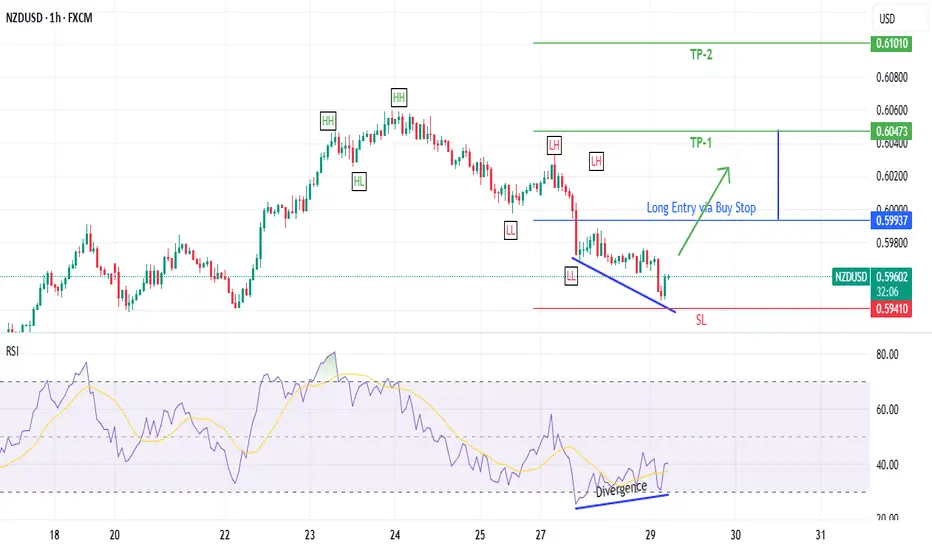
NZDCHF is in the Bearish Side due to Bearish TrendHello Traders
In This Chart NZDCHF HOURLY Forex Forecast By FOREX PLANET
today NZDCHF analysis 👆
🟢This Chart includes_ (NZDCHF market update)
🟢What is The Next Opportunity on NZDCHF Market
🟢how to Enter to the Valid Entry With Assurance Profit
This CHART is For Trader's that Want to Improve Their Technical Analysis Skills and Their Trading By Understanding How To Analyze The Market Using Multiple Timeframes and Understanding The Bigger Picture on the Chart
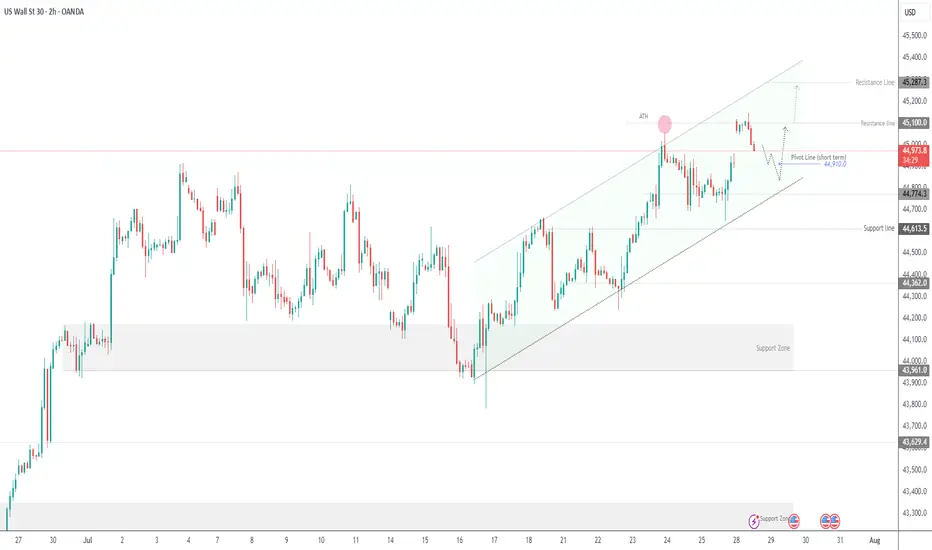
OVERVIEW The price is currently undergoing a bearish correctionUS30 OVERVIEW
The price is currently undergoing a bearish correction, targeting 44910. To confirm a bearish trend continuation, the price must break below 44770, which would likely lead to a move toward 44610.
However, if the price stabilizes above 44910 on the 4H timeframe, a bullish reversal may begin. A confirmed break above 45100 would strengthen bullish momentum and open the path toward 45290.
Key Levels:
• Pivot Line: 45045
• Support: 44910 – 44770 – 44610
• Resistance: 45100 – 45290
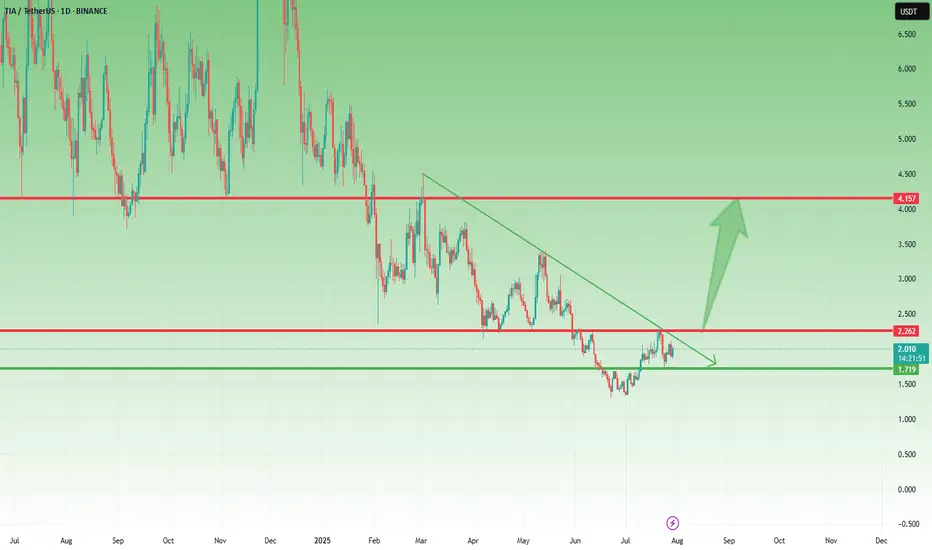
TIA Holding Support – Break Above $2.20 Could Trigger Big MoveLast week, I mentioned that TIA could be preparing for a move and that buying dips around $1.75 might be a good opportunity.
Well, price dropped exactly into that support zone, bounced slightly, and is now consolidating, which could be the calm before the next wave.
________________________________________
📌 Here’s what I’m watching:
• The $2.10–$2.20 zone is now a confluence resistance area (horizontal + descending pressure)
• A break and daily close above this level could trigger a strong leg up, with the next major target around $4.00
________________________________________
📈 Bias remains bullish
As long as $1.70 holds, this setup stays valid, and dips continue to be buyable.
________________________________________
🎯 Trading Plan:
• Looking to buy dips toward $1.80–1.85
• Acceleration expected only above $2.20
• Bearish invalidation only below $1.70
________________________________________
Conclusion:
TIA is respecting structure perfectly. If it breaks above $2.20, we could be looking at a potential double in price toward $4.
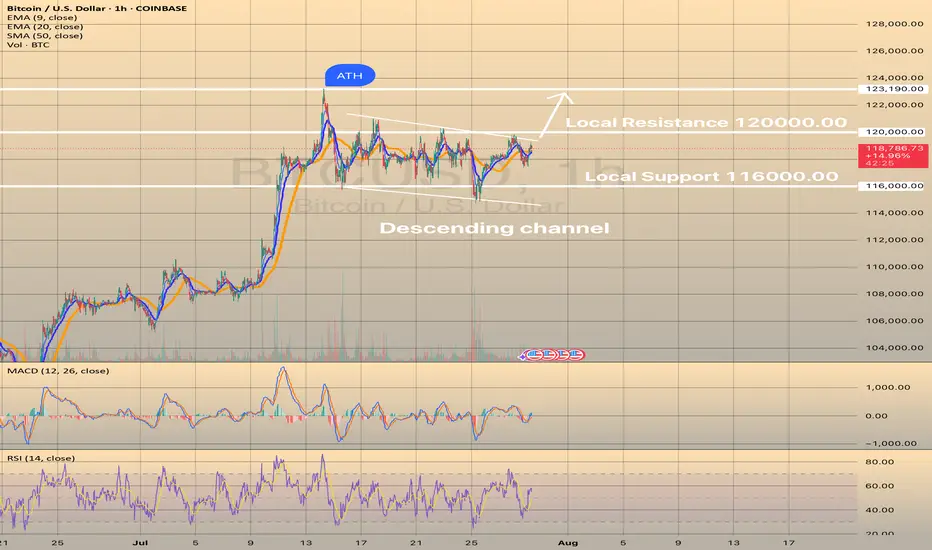
BTCUSD CONSOLIDATES BELOW RESISTANCE OF 120,000.00BTCUSD CONSOLIDATES BELOW RESISTANCE OF 120,000.00
Today the price rebounded from the SMA50 on 4-h chart and continues to consolidate below the resistance level of 120,000.00. Yesterday there was a minor pullback from this level, still the price is pretty much at the same levels as yesterday. The recommendation is still the same: would be safer for long trade to wait for a breakout of the resistance (120,000.00) with first target of 123,190.30 (ATH). However, the asset shows nice bullish set up: RSI started to show some strength with price consolidation below resistance.
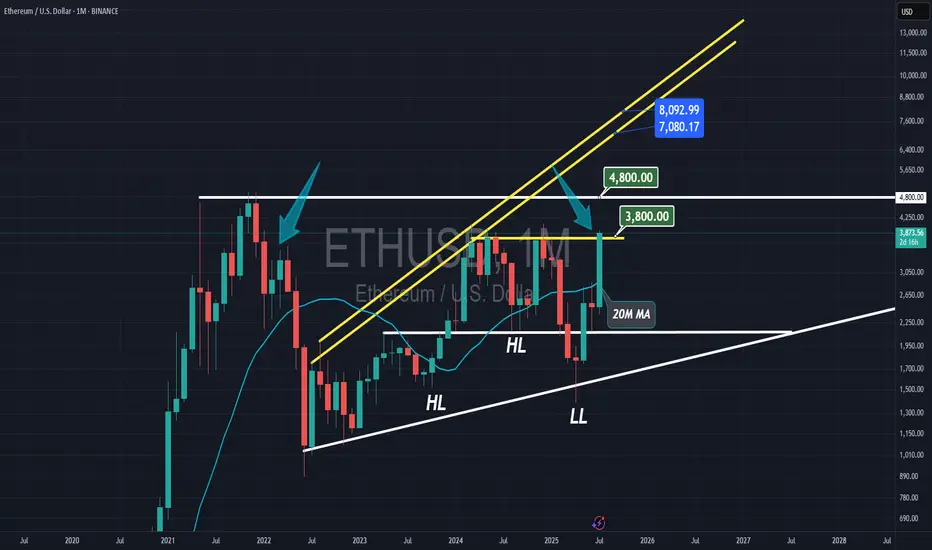
Ethereum the HIGHEST MONTHLY CANDLEEthereum is closing its highest monthly candle since 2021, signaling very bullish months ahead, with $8,000 as the resistance.
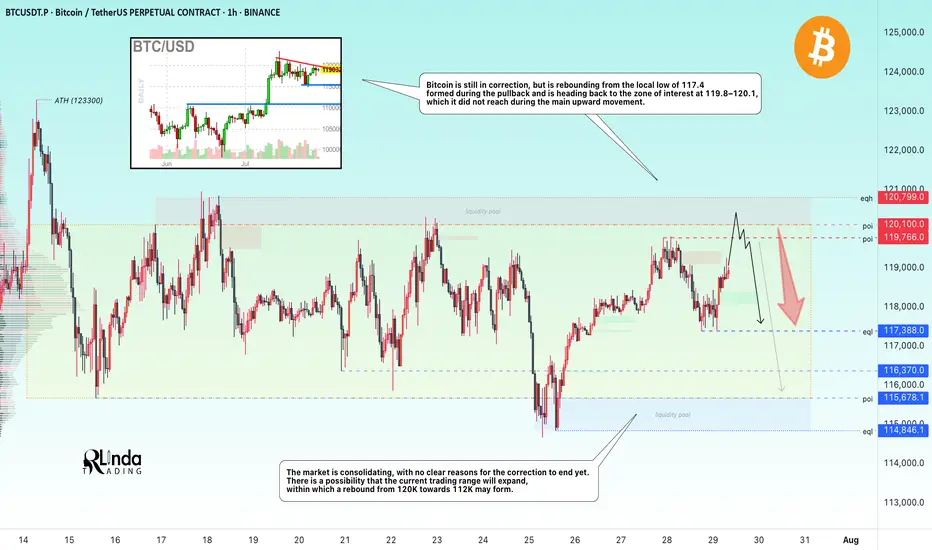
BITCOIN → Hunting for liquidity. Retest resistance before a fallBINANCE:BTCUSDT.P continues to consolidate after a strong rally. There is no strong driver yet, and Bitcoin is reacting weakly to economic data. There is a possibility of a continued correction...
Bitcoin is still in correction, but is rebounding from the local low of 117.4, formed during the pullback, and is heading back up towards the zone of interest at 119.8-120.1, which it did not reach during the main upward movement. I see no fundamental or technical reasons for the correction to end and for growth beyond 121K. I expect a rebound from the resistance zone towards 115-114K. However, in the medium term, I expect the market to attempt to close half or all of the gap between 112K and 114.8K, thereby expanding the key trading range.
Resistance levels: 119.77, 120.1K, 120.8K
Support levels: 117.4, 116.37, 115.68
Technically, a false breakout (liquidity capture) of key resistance and price consolidation in the selling zone could trigger bearish pressure on the market, which in turn would lead to a correction.
Best regards, R. Linda!
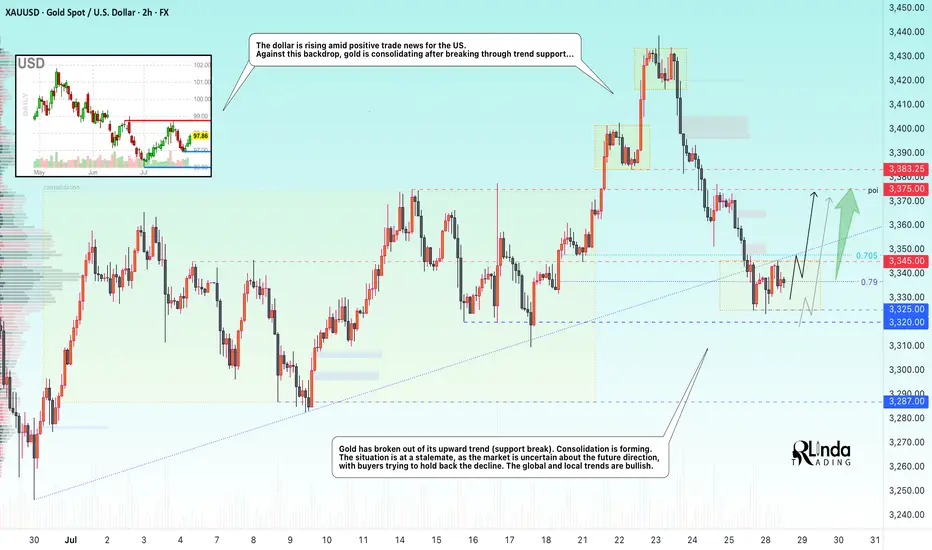
GOLD → Retest of trend support. Consolidation...GOLD is consolidating below the previously broken trend support. On Sunday, Trump announced a trade deal with the EU, which is putting pressure on the market along with the rising dollar...
Gold rebounded from support at $3310 after a week-long low, interrupting a three-day decline amid profit-taking. However, the overall downtrend remains intact as markets brace for a busy week with the release of US GDP data and the Fed's decision. Optimism surrounding US-China trade talks and the US-EU framework agreement is reducing demand for safe-haven assets. Additional pressure on gold is coming from easing geopolitical tensions: Thailand and Cambodia have agreed to ceasefire talks. The metal's recovery may be short-lived.
Technically, we have global and local bullish trends, against which gold is testing support, but as we can see, buyers are trying to hold back the decline due to uncertainty over interest rates. There is a chance that we will see active action by the Fed, behind which lies a rate cut, this week...
Resistance levels: 3345, 3375
Support levels: 3320, 3287
At the moment, I do not see a proper reaction to the support breakout. The price is consolidating after confirming the key trigger at 3345. Thus, if the price starts to return to 3345, test and consolidate above the level, we will have a chance for growth. I do not rule out a liquidity grab from 3325 (false breakout) before the rise.
BUT! The structure will be broken if the price breaks 3325 - 3320 and begins to consolidate below this zone. In this case, gold may fall to 3287
Best regards, R. Linda!
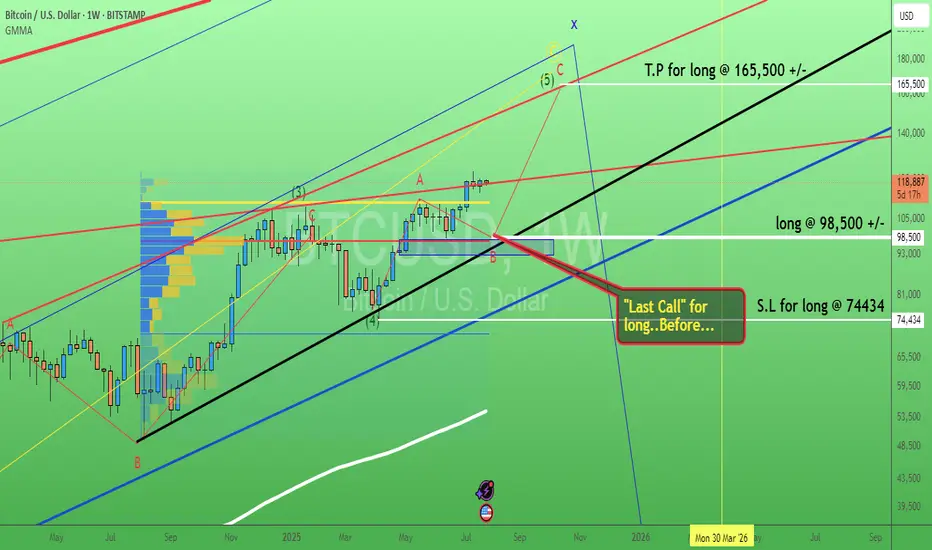
Bitcoin. Last call buy level? 29/July/25BTCUSD probably will have pullback toward confluence zone of 1) Trendline Support 2) Order Block 3) POC of volume before hitting ATH again
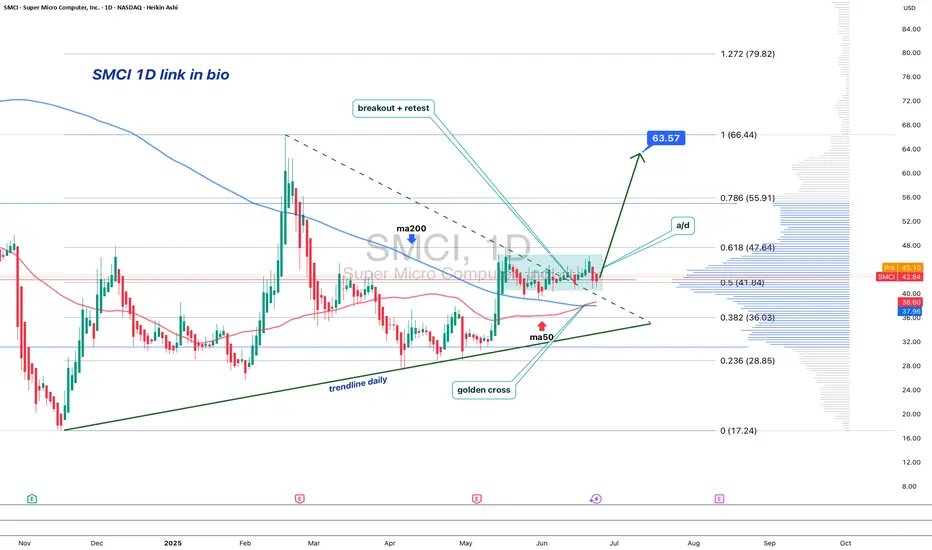
SMCI: When a chart says it’s time to reconnect with the AI hypeOn the daily chart, Super Micro Computer Inc. (SMCI) is showing a clean bullish setup. Price broke out of a descending trendline (green dashed), confirmed it with a retest, and is now consolidating above the breakout zone. The golden cross — where the MA50 crossed above the MA200 — confirms a long-term trend reversal.
Volume profile indicates strong accumulation near $41–43. The 0.5 Fibonacci level at $41.84 acted as support. Above the current range, there’s low volume resistance up to $63.57 (0.786), followed by $66.44 and a final extension target at $79.82 (1.272).
Fundamentals: SMCI is a leading server hardware manufacturer. Demand for their systems has soared with the explosion of AI infrastructure. The company maintains solid financials, with rising quarterly revenue and growing presence in the cloud sector. Institutional investors have been actively increasing their positions since late 2023 — a sign of strong long-term conviction.
Tactical plan:
— Entry: market $42–43
— Target 1: $55.91
— Target 2: $63.57
When technicals scream textbook breakout and fundamentals bring AI momentum to the table — it might just be one of the best late entries in the AI wave this summer.
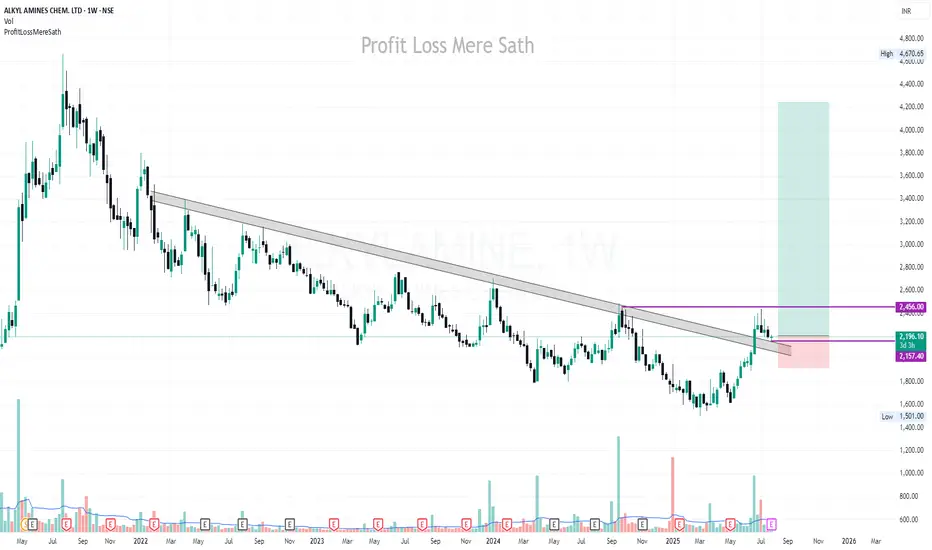
ALKYLAMINE | Buy @2200 | Strict SL below 1900 | Target 4240Disclaimer:
This is not financial advice. Please do your own research or consult with a financial advisor before making any investment decisions. Investments in stocks can be risky and may result in loss of capital.
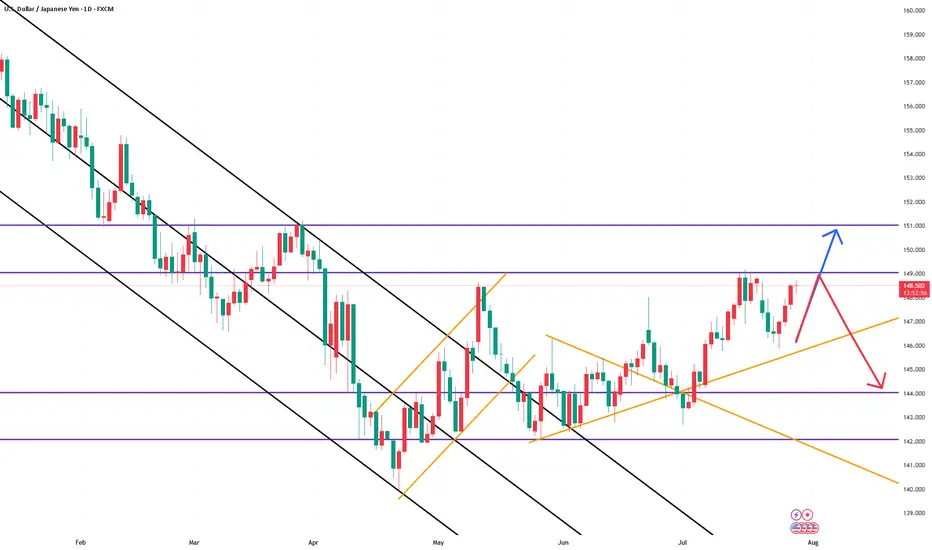
USDJPY InsightHello to all our subscribers.
Please feel free to share your personal thoughts in the comments. Don’t forget to hit the boost and subscribe buttons!
Key Points
- Prime Minister Shigeru Ishiba reaffirmed during a party meeting held at the LDP headquarters that he has no intention of resigning, stating, "I will do my utmost to ensure there is no political vacuum for the nation and the people."
- Following the U.S.-EU trade agreement, concerns have arisen that it could negatively impact the EU economy, with negative sentiment spreading across Europe.
- On July 28, the third high-level meeting between the U.S. and China began in Stockholm, Sweden. The market widely expects the current “tariff truce” to be extended by another 90 days.
Major Economic Events This Week
+ July 29: U.S. Department of Labor – JOLTS
+ July 30: Germany Q2 GDP, U.S. July ADP Nonfarm Employment Change, U.S. Q2 GDP, Bank of Canada rate decision, FOMC meeting results
+ July 31: Bank of Japan rate decision, Germany July CPI, U.S. June PCE Price Index
+ August 1: Eurozone July CPI, U.S. July Nonfarm Payrolls, U.S. July Unemployment Rate
USDJPY Chart Analysis
After facing resistance near the 149 level, USD/JPY pulled back but found support around 146, and is now climbing again toward 149. In the long term, a rise toward 151 seems possible. Two potential scenarios are in play:
- The pair hits resistance again at 149, finds support at 146, and then moves up toward 151.
- The pair maintains its current upward momentum and continues climbing directly to 151.
We will determine our strategy based on the price action near the 149 level.