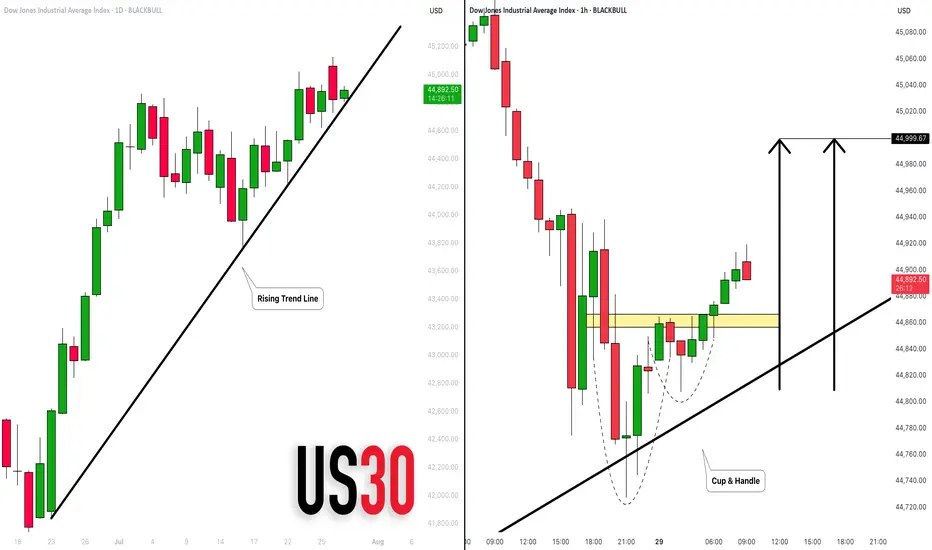
DOW JONES INDEX (US30): Bullish Move From Trend Line
There is a high probability that US30 will continue rising today,
following a test of a solid rising trend line on a daily.
As a confirmation, I see a cup & handle on that after its test
on an hourly time frame.
Goal - 45000
❤️Please, support my work with like, thank you!❤️
Trend Lines
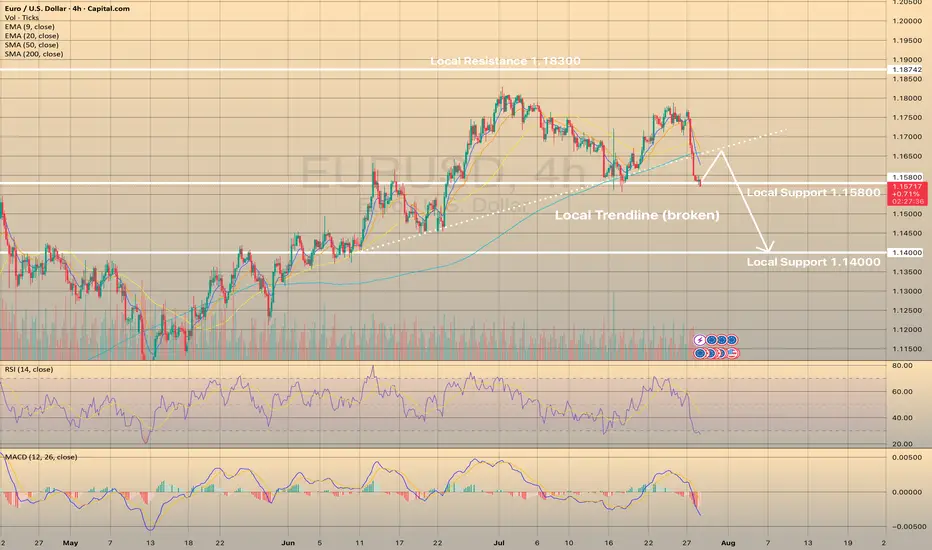
EURUSD - STRONGEST DECLINE FOR THE LAST COUPLE OF MONTHSEURUSD - STRONGEST DECLINE FOR THE LAST COUPLE OF MONTHS
EURUSD has lost 1.32% yesterday on the U.S. - E.U. trade deal. Experts suggest that the relief felt by the United States and the European Union upon reaching a trade agreement has been overshadowed by worries about the potential economic harm caused by a 15% tariff on EU imports. The dollar has recently experienced a positive trend, and this trend could continue if U.S. economic data, including Friday's employment figures, indicates a strong economy. The investors who had previously made substantial bets on the euro's appreciation are now reversing their positions, causing the euro to weaken.
Technically, the asset broke down the local trendline and is currently trying to rebound from the local support level of 1.15800. RSI tells us that the asset is oversold, so the most possible outcome here is the EURUSD to rebound from current level, retest former trendline and continues downwards movement.
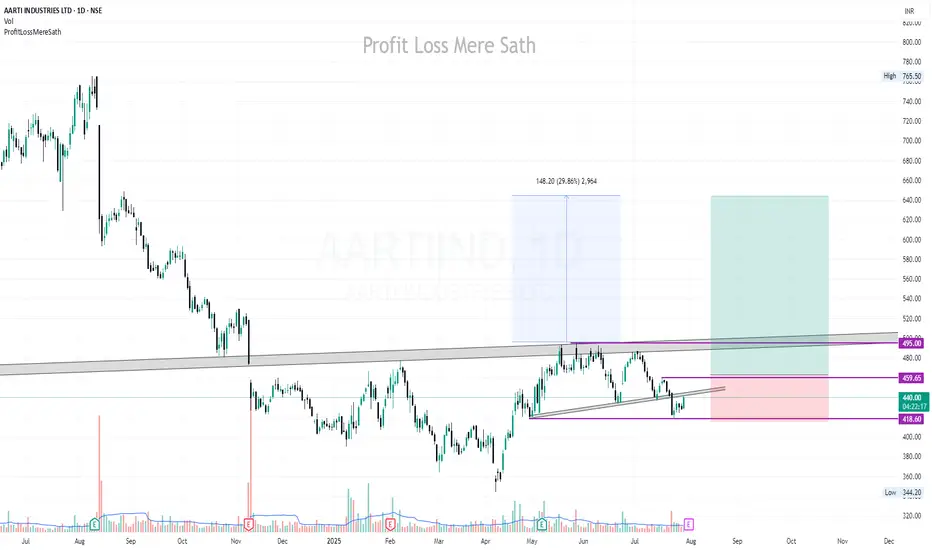
AARTIIND | Buy above 460 | Strict SL below 415 | Target 640, 760Disclaimer:
This is not financial advice. Please do your own research or consult with a financial advisor before making any investment decisions. Investments in stocks can be risky and may result in loss of capital.
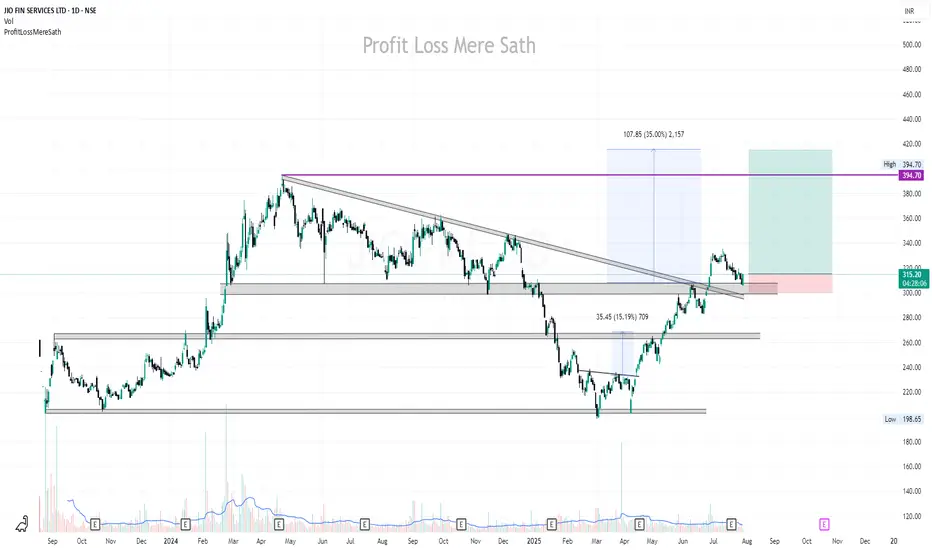
JIOFIN | Buy @315 | Strict SL below 300 | Target 400Disclaimer:
This is not financial advice. Please do your own research or consult with a financial advisor before making any investment decisions. Investments in stocks can be risky and may result in loss of capital.
Japan 225 Unwind Pauses at Known SupportThe Japan 225 contract has spent the past three sessions partially unwinding the sharp rally sparked by Japan’s trade agreement with the United States last week, leaving price resting on a known support level. Near-term price action may determine whether bullish or bearish setups hold the upper hand.
If price holds 40162, longs could be established above with a stop beneath for protection, targeting a move back to last week’s high of 42070. Alternatively, a break and hold beneath 40162 would flip the setup, allowing shorts to be established below with a stop above for protection. Uptrend support sits today at 40000, making that an obvious target.
Momentum indicators remain mildly bullish despite the pullback, favouring upside over downside. However, with this setup, price action should carry more weight.
Good luck!
DS

SHOP has one more seller to BuyHello I am the Cafe Trader.
Today we are going to be looking at Shopify, Thanks to a request from a follower.
Couple things to note here. This is a Massive range for a decent stock.
With a bottom of 23.61, and a high of 176.34 some may wonder if we might see some more downside before testing the highs (rightfully so).
Today we are going to look at some long term prices I think are suitable for your personal risk tolerance. as well as two possible short term scenarios and how you can navigate them.
Enough talking let's get into the charts.
Long Term
These prices are chosen from current market participants. I've measured them in order of your own conviction.
Aggressive = 122 (Top of Demand)
Fair Price = 99-102 (Concentrated demand)
Steal = 70-81 (Top of Strong Buyers)
Short Term
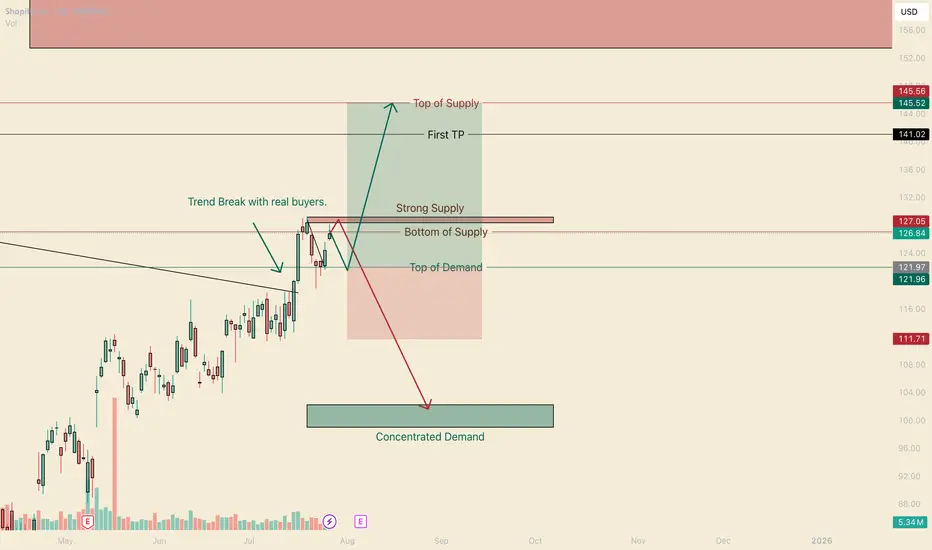
I'm going to be honest here, I don't particularly like the positioning of the range to go long here. That Strong Supply area is still very active, and we may have to hit that concentrated demand before having enough strength to get through that supply.
As this stands though, Bulls are in control. We have that trend break with real buyers, this is looking to hit top of supply in it's current context.
If at all we close above that strong supply (especially on friday) This is a great case to have a continuation.
If we cannot get above this strong supply after a test or two more, this is going to put pressure on the buyers.
Green Scenario
Entry 122
Stop 111.50
1st TP 141
Final TP 145.50
Red Scenario
If bulls make a big push and fail back below the strong supply, Bulls will be trapped, and This will put alot of pressure on the "Top of Demand".
Entry = close of the candle that is the false breakout.
Stop = Depends on how big the wick was on the false breakout. I'll assume about 131.50. but if its a huge wick, it will need to be higher. I'll update this depending.
1st TP = 106
Final = 102.5
That's all for SHOP Stay tuned for updates and more charts!
Happy Trading!
@thecafetrader
@livelclark
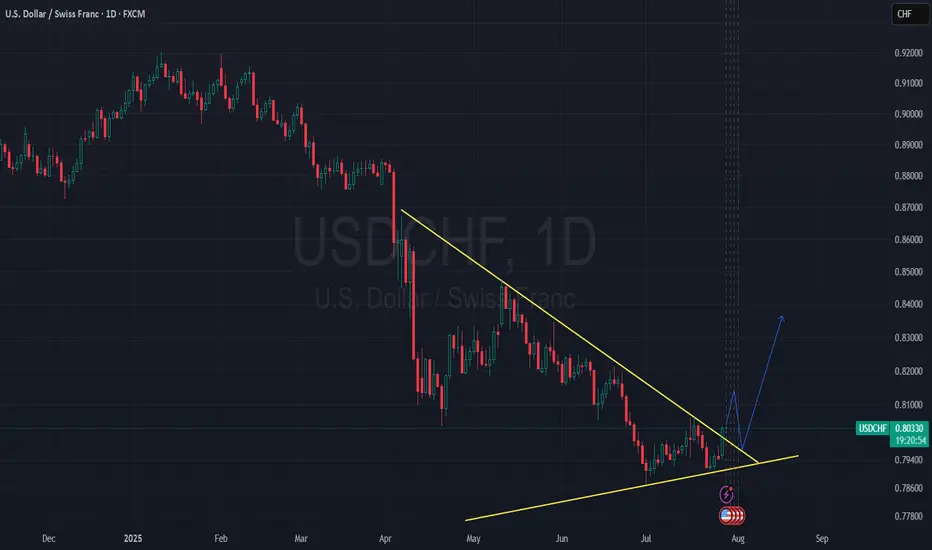
USD/CHF Just Broke Out of an Ascending Triangle - LONG📈 Price has just broken out of an ascending triangle pattern.
I’m now patiently waiting for a retest of the breakout zone to explore a potential long opportunity.
Let’s see if the market gives us a clean entry! 💹🧠
Dollar General | DG | Long at $90.00Dollar General NYSE:DG took a massive hit this morning after revising their future earnings guidance. The economy is showing many signs of a recession, and this is a clear warning. From a technical analysis perspective, it has retouched my "crash" simple moving average and may dip further into the $80's in the near-term. But, like many overall strong companies that suddenly plummet, I view this as a future opportunity given the strength of NYSE:DG as a business (holistically). Dollar General is the only grocery and home goods store around in many rural locations. So, while there is doom and gloom in the near-term, Dollar General is in a personal buy zone at $90.00. I view this as a starter position, though, with the potential for future declines/opportunities for additional share accumulation in the near-term.
Target #1 = $100.00
Target #2 = $122.00
Target #3 = $200.00+ (very-long term outlook...)

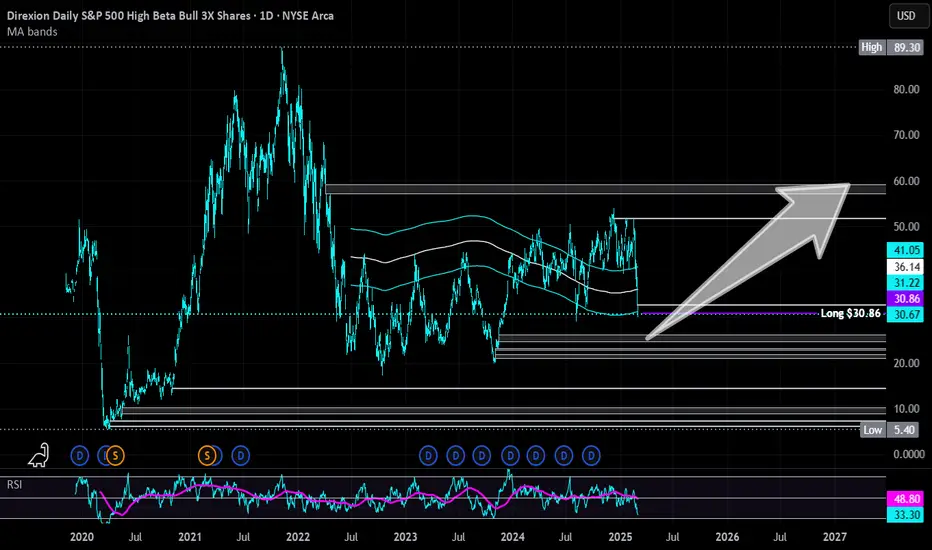
Direxion High Beta Bull S&P 500 3X | HIBL | Long at $30.86Contrarian view, despite tariffs. I don't think this rodeo is over - but I could always be wrong. Even if individual consumption drops (which I think it has for some time now), rising prices will continue to mask it. Many, but not all, companies will profit and until there is a "bigger" catalyst... bullish.
AMEX:HIBL is a personal buy at $30.86 (also noting the possibility of it going into the FWB:20S in the near-term)
Targets:
$40.00
$45.00
$50.00
GE Healthcare Technology | GEHC | Long at $62.25GE Healthcare Technology $NASDAQ:GEHC. An aging and unhealthy population will only create an increased need for healthcare imaging services. Add AI to the diagnostic mix, and imaging will be imperative for routine health maintenance and screening. With a P/E of 15x, debt-to equity of 1x, earnings forecast growth of 8.36% per year, and bullish analyst ratings, this could be a good value play for the patient.
Thus, at $62.25, NASDAQ:GEHC is in a personal buy zone. Further drops are possible if trade wars make imaging materials/technology difficult to obtain, but that general statement applies to the whole market at this time...
Targets:
$70.00
$78.00

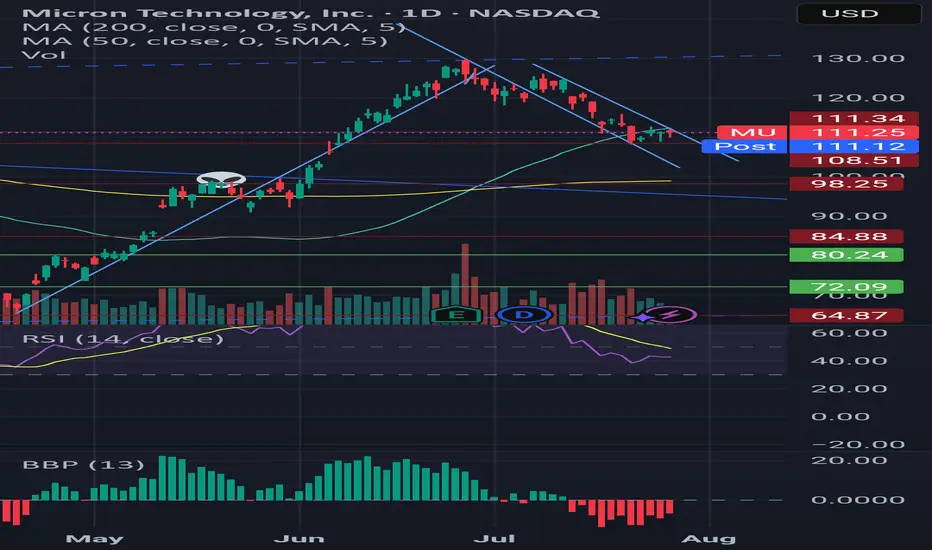
BearishI have a feeling that Micron's gonna retest $109 or blow through it and run for the 200 moving average. Waiting to see a bullish divergence in the RSI, or for it to get out of this little downtrend it's forming
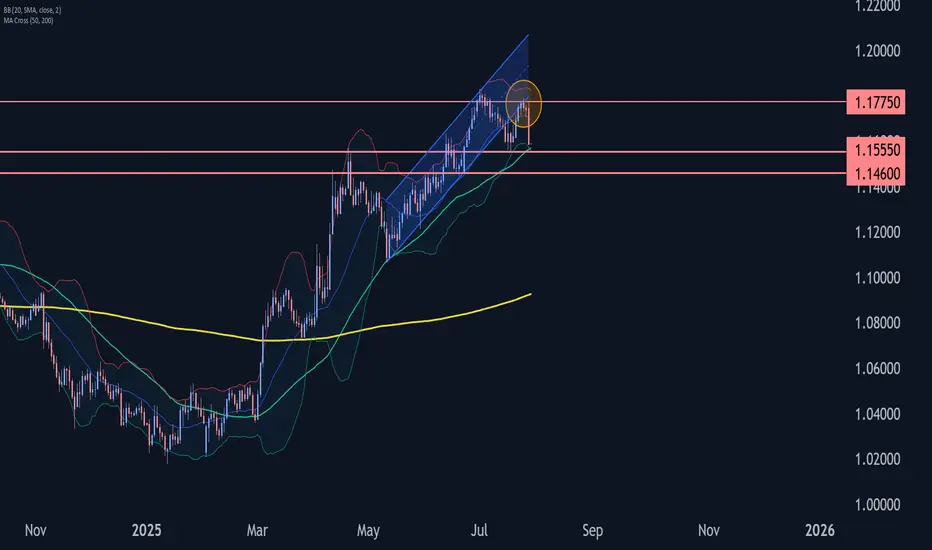
EURUSD Wave Analysis – 28 July 2025- EURUSD reversed from the resistance level 1.1775
- Likely to fall to support levels 1.1555 and 1.1460
EURUSD recently reversed down from the resistance zone between the resistance level 1.1775 (which stopped the previous impulse wave 3 at the start of July, as can be seen below) and the upper daily Bollinger Band.
This resistance zone was further strengthened by the lower trendline of the recently broken up channel from May (acting as resistance after it was broken earlier).
Given the strongly bullish US dollar sentiment, EURUSD can be expected to fall to the next support levels 1.1555 and 1.1460 – the low of waves 4 and iv.
Update: Bull or Bear?I optimized and updated my trend lines. We have a fake breakout on there
What's your Idea? Bull or Bear?

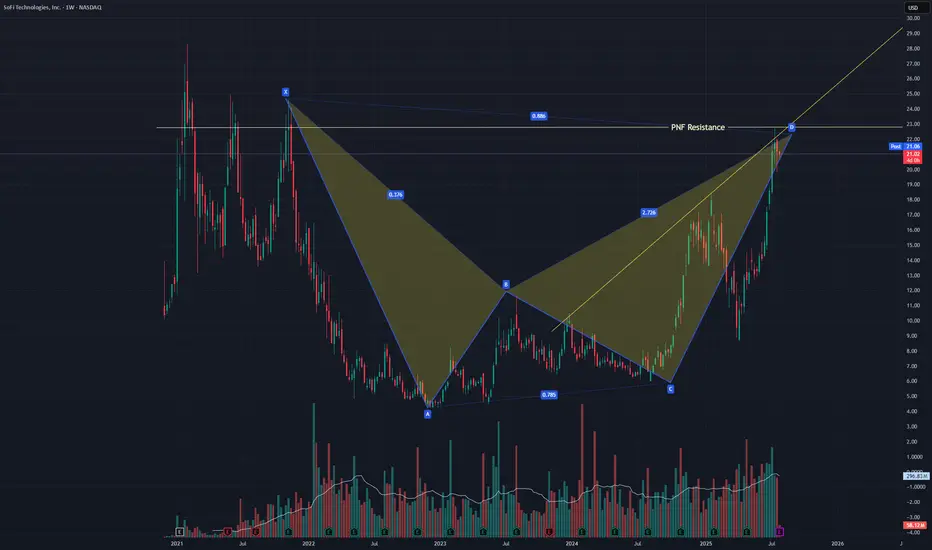
SOFI Pullback most likely comingNASDAQ:SOFI just finished a bearish bat harmonic and failed to break a resistance line I have from a PNF chart. It also failed a back test of a trendline of resistance in this uptrend. A pullback is likely but in this irrational market any thing could happen. I did a strangle +-5% just in case. I would not be surprised if I can close both with 20%+ profit.
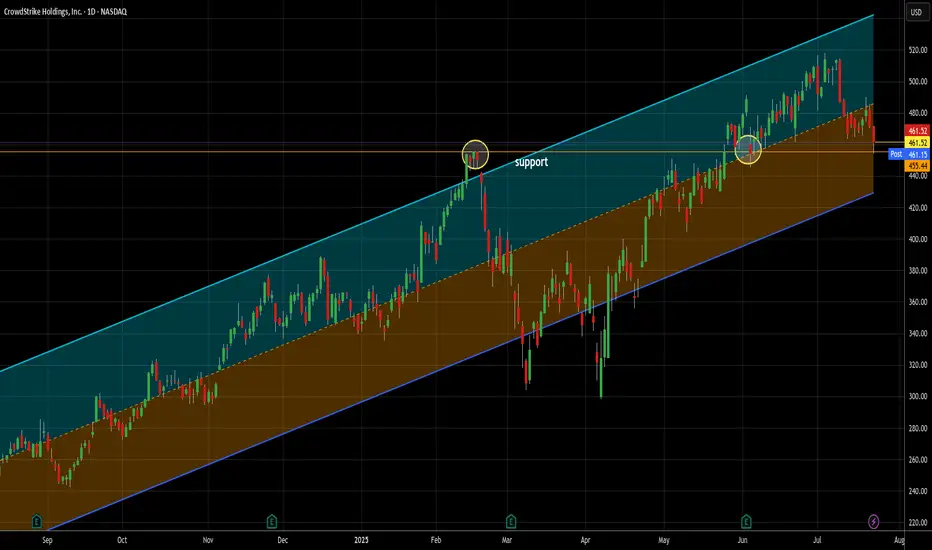
The only way to fight AI is with AI -- long at 461.52I love cybersecurity stocks generally. As our lives become ever more embedded in the electronic world, their necessity increases. As AI driven threats are sure to rise (Sam Altman, founder of OpenAI, spoke to a financial conference this week about the rising threat of AI driven banking fraud), the only way to combat it effectively is with AI. Crowdstrike, along with Palo Alto, are leading the charge in this area and I think will be another great example of AI ultimately being better than humans at the job they need to do here.
Yes, it's a story stock, but you know me - the story is the trading data. So here it is. In the last 12 months, 21 signals. 21 wins, 0 losses. Average trade length = 6.7 days (though that's misleading since all but 4 trades closed in less than that and 20 of 21 were 10 days or less). Average gain was 4.46% - that's an average of .67% per day held. That's almost 16x the long term daily rate of return of SPX and almost 10x the daily return of the Nasdaq 100 in the last year.
Additionally, it bounced off support near today's low and finished stronger. That's always good to see. I will happily add more if my signals suggest it, but of the 21 signals, only once did it produce 2 open lots at once. Nornally, it was one lot paying quickly. 2/3 of the trades closed in less than one week.
As always - this is intended as "edutainment" and my perspective on what I am or would be doing, not a recommendation for you to buy or sell. Act accordingly and invest at your own risk. DYOR and only make investments that make good financial sense for you in your current situation.
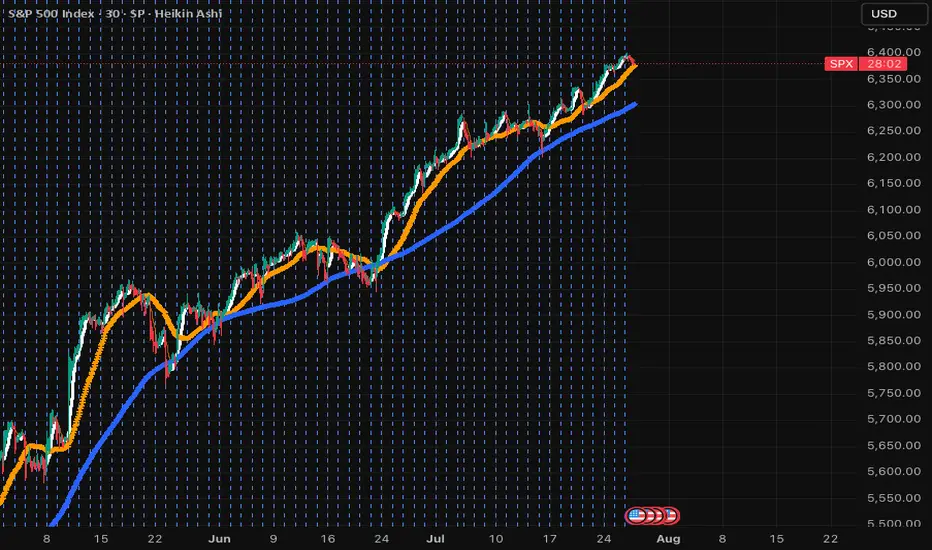
SPX500USD | Bulls Lose Steam at 6,424.5 ResistanceThe S&P 500 Index showed strong bullish momentum but is now pulling back after tagging resistance at 6,424.5. Price is currently hovering near 6,374.6, where previous structure may act as support.
Support at: 6,374.6 / 6,340.0 🔽
Resistance at: 6,424.5 🔼
🔎 Bias:
🔼 Bullish: Bounce from 6,374.6 and reclaim of 6,424.5 signals continuation.
🔽 Bearish: Break below 6,374.6 exposes 6,340.0 and lower zones.
📛 Disclaimer: This is not financial advice. Trade at your own risk.

SPX....what goes up, must go downThis is long overdue. SPX has just crossed 9SMA, next 50SMA then 200SMA. Won't be surprised if it knocks each very soon. This will be a big week and tariffs are going to start hitting; even though this was mostly artificial and Americans are paying 90% of it! When in doubt, sell and park in money market! The next dip will hit hard and deep. Don't let the small wins overshadow the deep issues in the economy. Overpriced market and many lagging indicators will soon hit and default rates that are coming out are scary! Stay safe and don't get emotional over any stock. If it dips, you can always buy it cheaper.
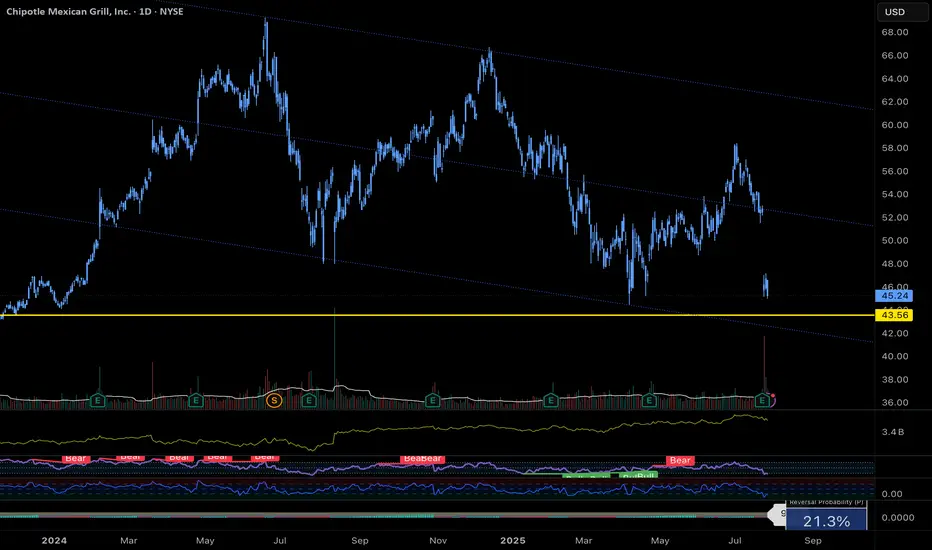
$CMG Approaching Major Support – Buy the Dip or Breakdown?Chipotle ( NYSE:CMG ) just reported earnings and missed on both revenue and same-store sales. Transactions fell 4.9%, and the company lowered its full-year outlook — triggering a sharp decline on elevated volume.
Technically, we’re approaching a major confluence of support near the $43 area (both diagonal trendline support and historical horizontal level).
🔻 Indicators currently suggest continued selling pressure, so traders looking to buy the dip should remain cautious.
Trade Setup Idea:
- Watch for bullish reversal patterns (engulfing, double bottom, trend shift) on 15min–1hr charts
- Avoid premature entries; trend reversals often take time
- NYSE:CMG Confirmation > prediction
📌 Keep alerts set. This one’s worth watching closely.
#CMG #Chipotle #TradingView #TechnicalAnalysis #SupportAndResistance #DipBuy #StocksToWatch
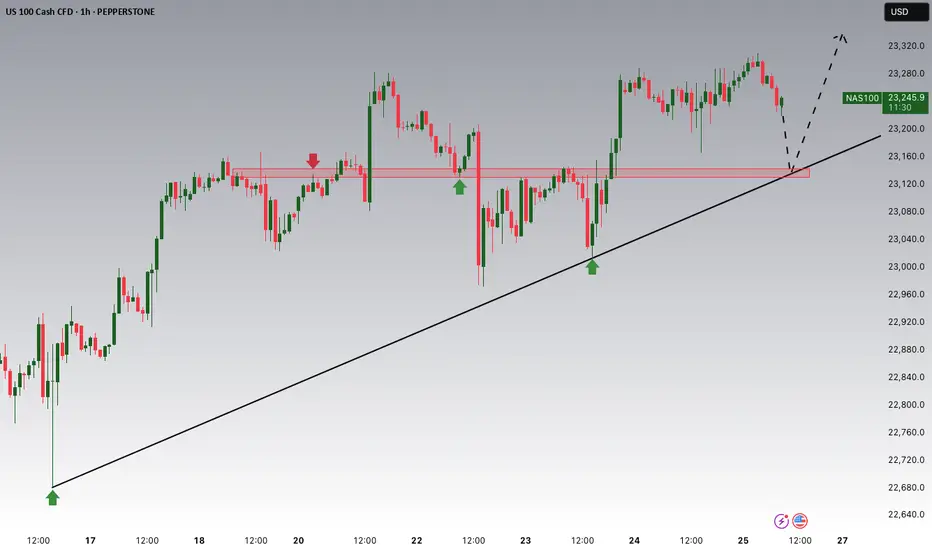
NASDAQ Potential UpsidesHey Traders, in today's trading session we are monitoring NAS100 for a buying opportunity around 23,140 zone, NASDAQ is trading in an uptrend and currently is in a correction phase in which it is approaching the trend 23,140 support and resistance area.
Trade safe, Joe.
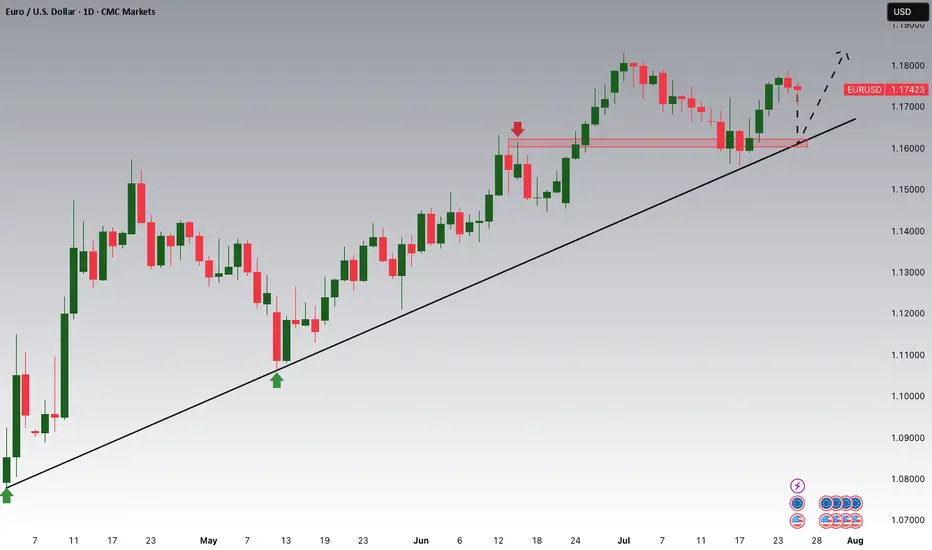
EURUSD Potential UpsidesHey Traders, in today's trading session we are monitoring EURUSD for a buying opportunity around 1.16 zone, EURUSD is trading in an uptrend and currently is in a correction phase in which it is approaching the trend at 1.16 support and resistance area.
Trade safe, Joe.
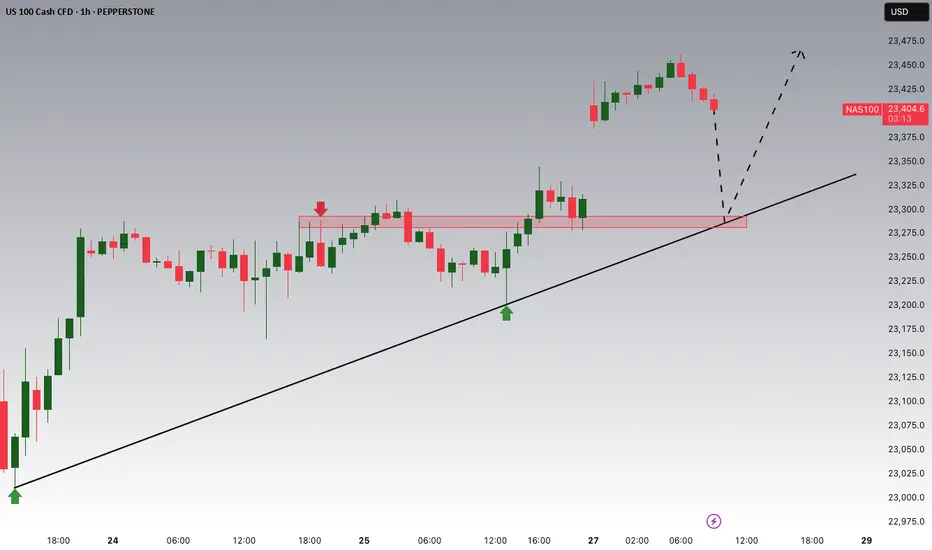
NASDAQ Potential UpsidesHey Traders, in today's trading session we are monitoring NAS100 for a buying opportunity around 23,300 zone, NASDAQ is trading in an uptrend and currently is in a correction phase in which it is approaching the trend at 23,300 support and resistance area.
Trade safe, Joe.
UK100 | Price Pulls Back After Testing 9,179.72 ResistanceThe FTSE 100 recently tagged 9,179.72, a fresh high, before pulling back slightly. Price remains above the 21-period SMA (blue), indicating the uptrend is still intact, though short-term weakness is surfacing. Immediate support sits at 9,036.17.
Support at: 9,036.17 / 8,889.95 🔽
Resistance at: 9,179.72 🔼
🔎 Bias:
🔼 Bullish: Bounce off the 21 SMA and reclaim 9,179.72 confirms continuation.
🔽 Bearish: Break below 9,036.17 opens room to 8,889.95.
📛 Disclaimer: This is not financial advice. Trade at your own risk.

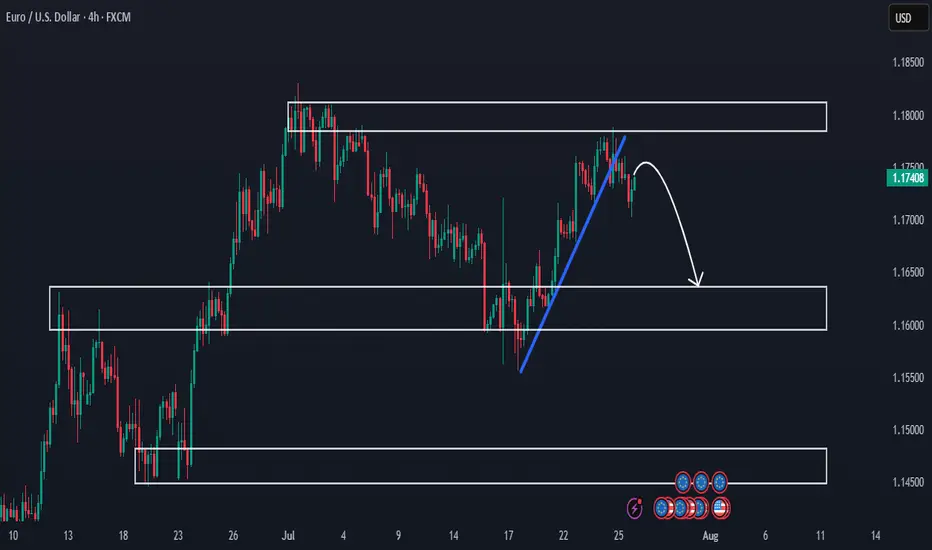
Premarket Analysis - Will Price Head Lower?Hello everybody!
We’re looking at three key areas on the chart.
Price has been rejected from a supply zone.
The clean upward trendline has been broken, and we expect the price to move lower this week.
If the drop continues, we’ll look to sell and aim for the more likely target around 1.16400.
Then we’ll see whether this first demand/support area holds or not.
Have a good trading week ahead!