Meta Platforms - This stock tastes sooo good!Meta Platforms - NASDAQ:META - will print a new all time high:
(click chart above to see the in depth analysis👆🏻)
Over the course of the past two months, Meta has been rallying +40%. This recent behaviour was not unexpected at all but rather the consequence of the all time high break and retest. Now - back at the previous all time high - Meta will most likely break out higher again.
Levels to watch: $700, $900
Keep your long term vision!
Philip (BasicTrading)
Trendlineanalysis

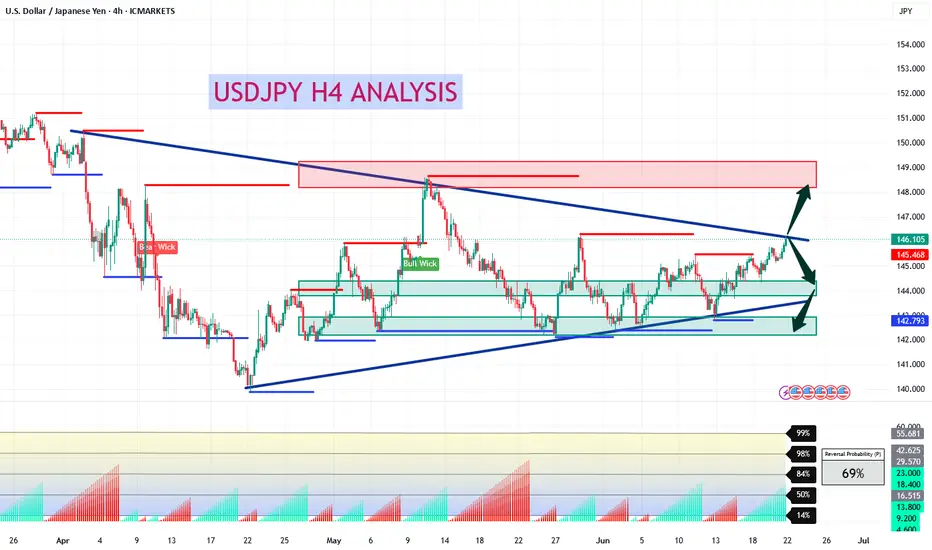
USDJPY H4 AnalysisUSDJPY Showing a Bearish Flag. If it breaks this zone above, Most probably can fly up to 148.668 and higher to 150.538. If no, Can rally between 143.981 or even lower to 142.410. Trading Analysis from 23-06-25 to 27-06-25. Take your risk under control and wait for market to break support or resistance on smaller time frame. Best of luck everyone and happy trading.🤗
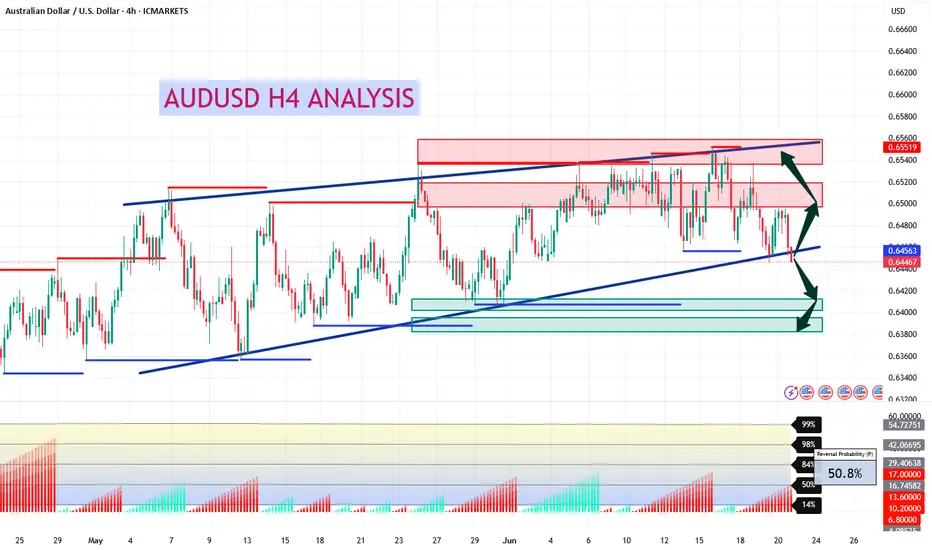
AUDUSD H4 AnalysisAUDUSD Showing a Bearish Flag. If it breaks this zone above, Most probably can fly up to 0.65018 and higher to 0.65379. If no, Can rally between 0.64068 or even lower to 0.63878. Trading Analysis from 23-06-25 to 27-06-25. Take your risk under control and wait for market to break support or resistance on smaller time frame. Best of luck everyone and happy trading.🤗
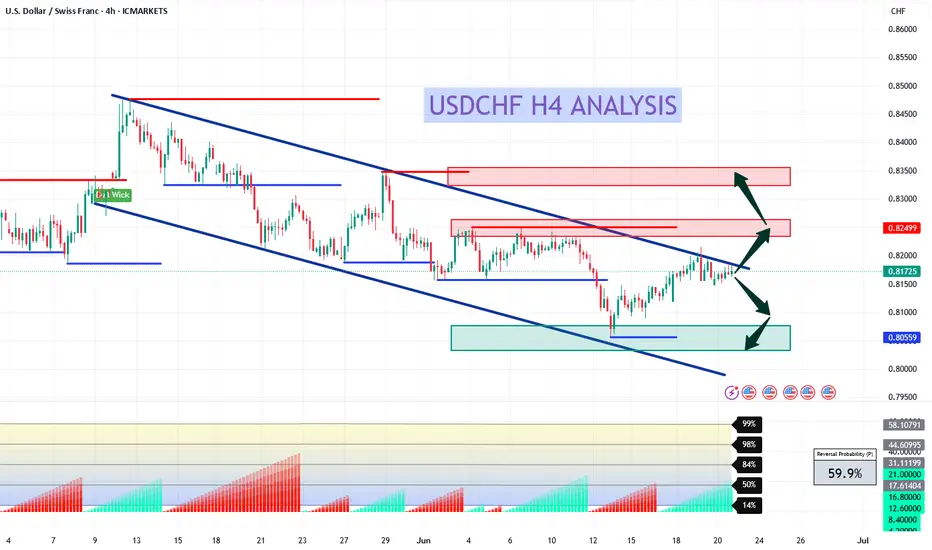
USDCHF H4 AnalysisUSDCHF Showing a Bearish Flag. If it breaks this zone above, Most probably can fly up to 0.82512 and higher to 0.83491. If no, Can rally between 0.80552 or even lower. Trading Analysis from 23-06-25 to 27-06-25. Take your risk under control and wait for market to break support or resistance on smaller time frame. Best of luck everyone and happy trading.🤗
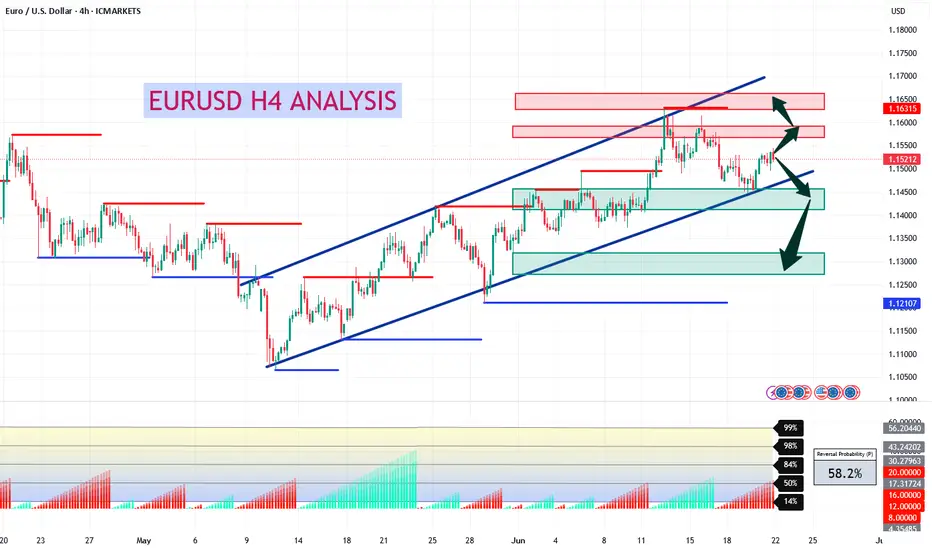
EURUSD H4 AnalysisEURUSD Showing a bullish Flag. If it breaks this zone above, Most probably can fly up to 1.15818 and higher to 1.16322. If no, Can rally between 1.14320, 1.13067 or even lower. Trading Analysis from 23-06-25 to 27-06-25. Take your risk under control and wait for market to break support or resistance on smaller time frame. Best of luck everyone and happy trading.🤗
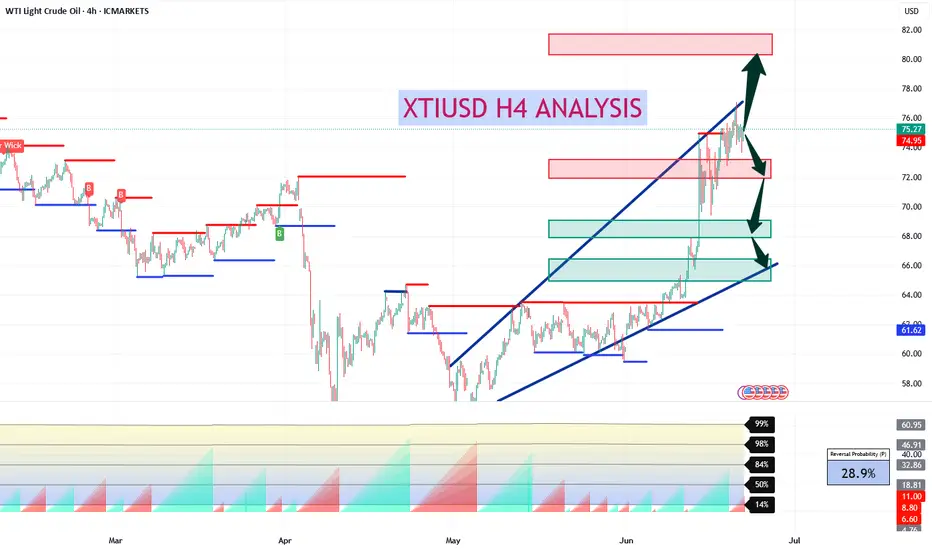
XTIUSD H4 AnalysisXTIUSD Showing a bearish Flag. If it breaks this zone above, Most probably can fly upto 81.00 and higher. If no, Can rally between 72, 68 or even 66. Trading Analysis from 23-06-25 to 27-06-25. Take your risk under control and wait for market to break support or resistance on smaller time frame. Best of luck everyone and happy trading.🤗
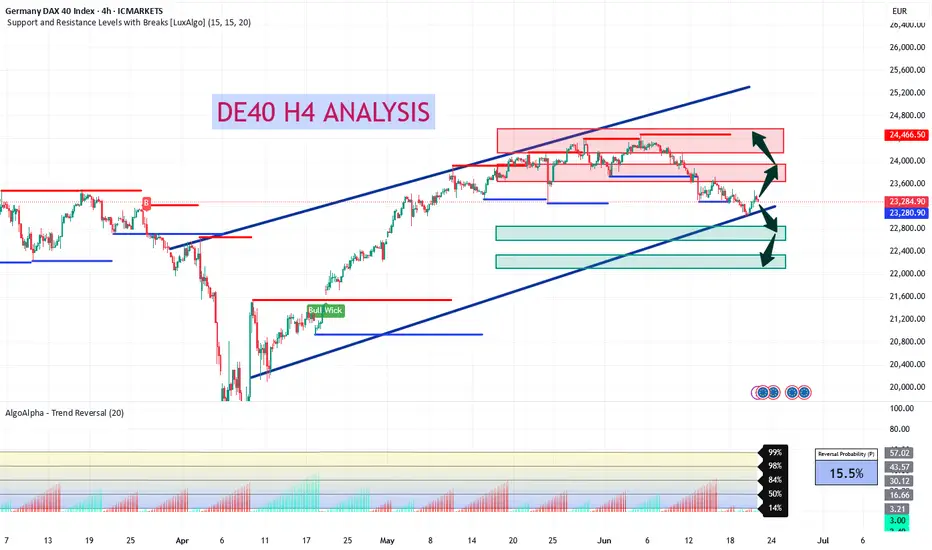
DE40 H4 Analysis 23 Jul to 27 Jul - Bullish FlagDE40 Showing a bullish Flag 23,735 - 23,800. If it breaks this zone, Most probably can fly upto 24,466 and higher. Take your risk under control and wait for market to break support or resistance on smaller time frame. Best of luck everyone and happy trading.🤗
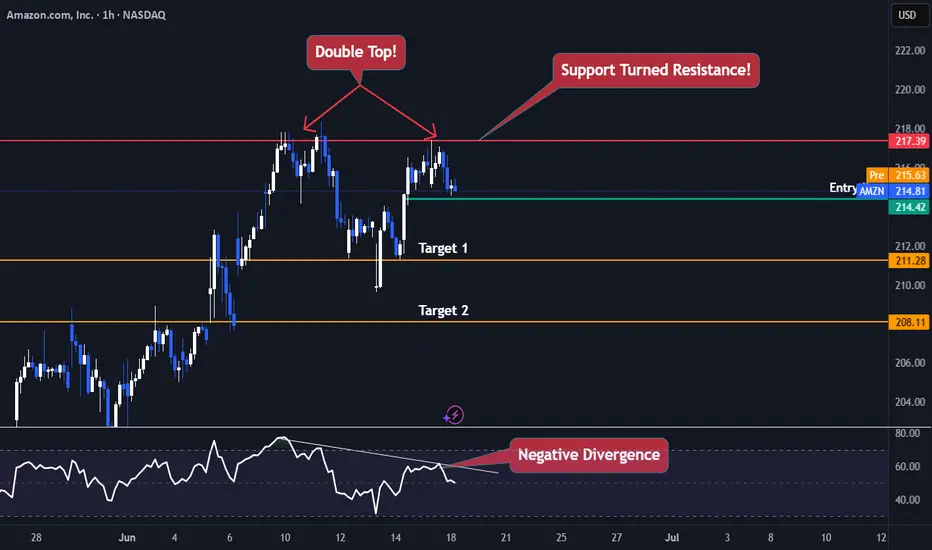
AMAZON TROUBLENASDAQ:AMZN Is currently trading Just 11% below its all time high and currently Facing exhaustion.
Amazon is currently trading 217$ range which was previous support now turned resistance (Daily Timeframe) , making a double top pattern and a negative divergence on the RSI.
The best Trades are the ones with multiple confirmations
- Trading at a resistance (1D chart)✅
- Negative Price Action at the resistance (Double Top Pattern)✅
- RSI negative divergence✅
- Market Structure ✅
Entry Criteria
- A Red candle at the entry Line Marked
- Stoploss Above the Entry Candle
Target 1- 211$
Target 2- 208$
Keep Your Risk Reward Intact! Not An investment Advice
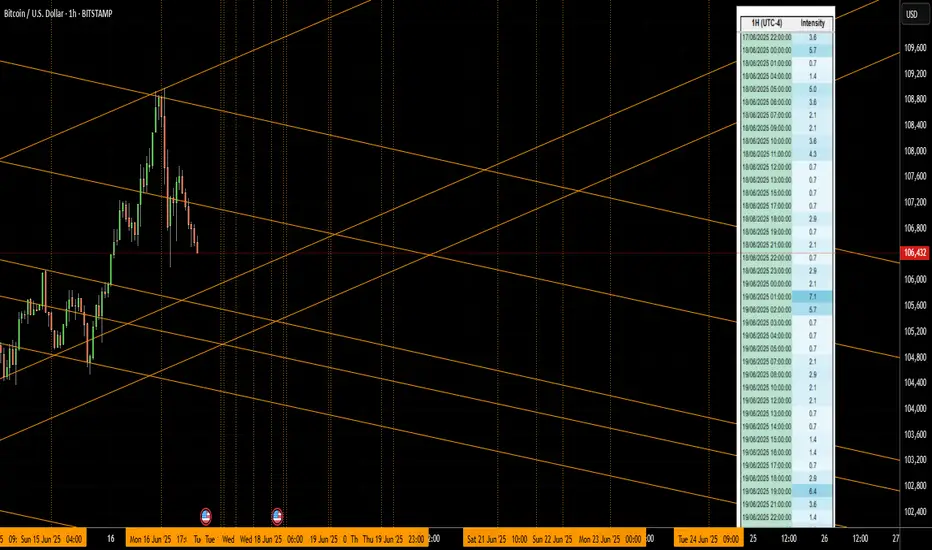
TIME and PRICE Structure for BTC (Intraday)Vertical lines represent cycle clusters.
The price tends to change direction or breakout/accelerate around these timelines.
The right-hand table shows cycle intensity for the next days.
Nasdaq - This starts the next +50% rally!Nasdaq - TVC:NDQ - might break out soon:
(click chart above to see the in depth analysis👆🏻)
Despite the quite harsh correction of about -25% which we saw in the beginning of 2025, the Nasdaq is clearly heading for new all time highs. It sounds almost incredible but if the Nasdaq breaks above the current confluence of resistance, a breakout rally of +50% will follow thereafter.
Levels to watch: $21.500, $33.000
Keep your long term vision!
Philip (BasicTrading)

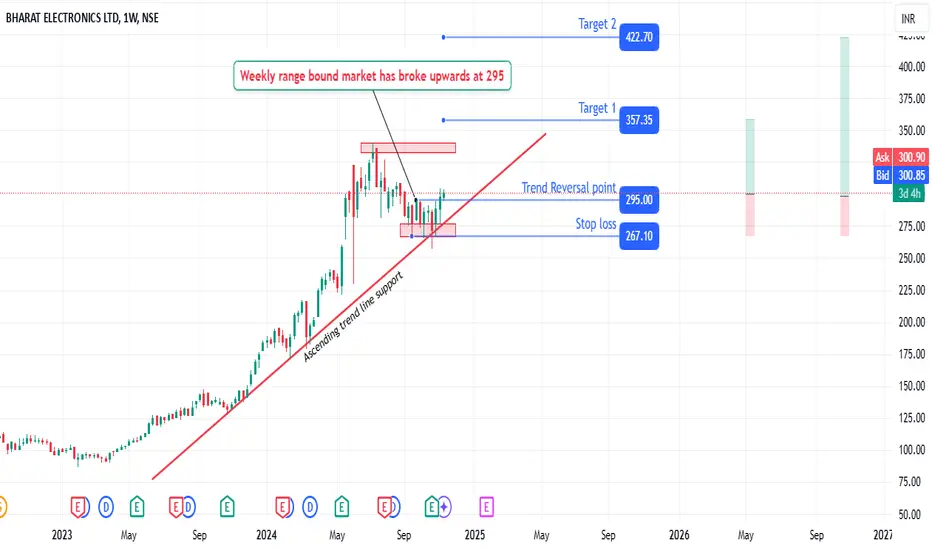
Range breakout | Impulse of bull starthi Traders,
1. The swing formation is solid
2. BEL has taken the ascending trend line support.
3. The the range bound is weekly has broke upward, leading to impulse wave of bull trend.
4. Projected Target 1 and Target 2 with 20% and 40% returns from the CMP with 1:81 and 1:4.01 risk reward ratio respectively.
Meta Platforms - The rally is clearly not over!Meta Platforms - NASDAQ:META - can rally another +30%:
(click chart above to see the in depth analysis👆🏻)
Some people might say that it seem counterintuitive to predict another +30% rally on Meta Platforms while the stock has been rallying already about +750% over the past couple of months. But price action and market structure both tell us, that this will soon turn into reality.
Levels to watch: $850
Keep your long term vision!
Philip (BasicTrading)

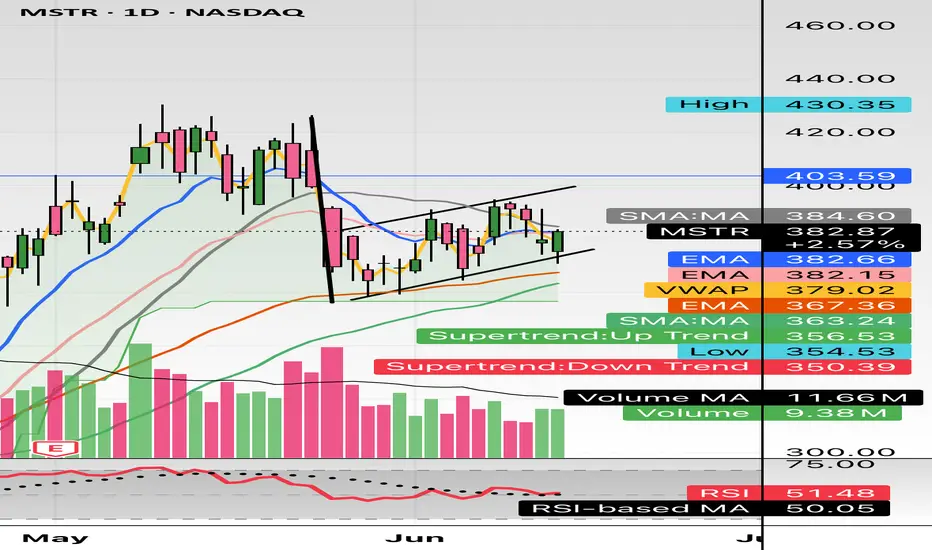
$MSTR bear flag forming; Daily $350 targetHello, quick mobile chart posting here. Simple looking bear flagging forming. Bitcoin having some downside action, I imagine Saylor will be buying some Bitcoin soon again as well. This should see $350. Looking for a short. + geopolitical turmoil hits crypto/Bitcoin the hardest and most violent. The 20 and 50 EMA are aligned as well with the Supertrend Downtrend showing $350.
WSL.
It Wasn’t on a Chart. It Was in My JournalYou don’t become consistent by learning more setups. You become consistent by learning more about yourself.
✍️ The Day I Started Journaling, I Stopped Guessing
I used to chase charts like they owed me something.One moment I was confident. The next, I was doubting everything, not because the market betrayed me, but because I wasn’t keeping track of who I was becoming .
Then I started journaling.
Not just logging wins and losses, but writing what I felt, what I saw, where I rushed, and why I broke my own rules. It changed everything.
What Journaling Gave Me (That Charts Alone Couldn’t)
1. Clarity Over Chaos
Every trade became a lesson. I stopped reacting and started reviewing.
2. Accountability Over Emotion
Writing “I entered out of fear of missing out” hits different when you see it five times in a row. I couldn’t lie to myself anymore.
3. Discipline Over Drama
No more revenge trades. No more “just one more” trades. Journaling made me pause, and that pause saved me more than any setup ever could
It’s Not Just a Journal. It’s a Mirror.
Most traders document price. Few document themselves. And yet that’s where the edge lives, not in more indicators, but in more self-awareness.
My Advice to Any Trader Trying to Break Through
Don’t just journal for results . Journal to understand who you are in the market. Your wins will mean more, and your losses will teach more. And if you're consistent with it, your growth won’t just be measurable. It’ll be undeniable.
The best setups won’t save you if your mindset is undisciplined.And the best mentors can’t help you if you don’t study your own patterns.
Journaling isn’t just about logging trades.It’s about documenting your evolution as a trader, from reactive to intentional, from hopeful to professional. So, if you’re serious about growth: Don’t just screenshot your wins, start writing your journey. That’s where the edge really begins.
Amd - This starts the next +200% rally!Amd - NASDAQ:AMD - is preparing a major rally:
(click chart above to see the in depth analysis👆🏻)
It has - once again - not been unexpected at all that we now see a major reversal rally on Amd. After the harsh drop of about -65%, Amd retested a significant confluence of support and already created bullish confirmation. It is quite likely that this now starts the next bullrun.
Levels to watch: $100, $300
Keep your long term vision!
Philip (BasicTrading)

Nvidia - The breakout will eventually follow!Nvidia - NASDAQ:NVDA - will break out soon:
(click chart above to see the in depth analysis👆🏻)
Over the course of the past couple of days, we saw a quite strong rally of +50% on Nvidia. Considering the market cap of this company, such a move is quite impressive. Following this overall very strong bullish momentum, an all time high breakout is quite likely to happen soon.
Levels to watch: $150
Keep your long term vision!
Philip (BasicTrading)

Microsoft - This might be the ultimate breakout!Microsoft - NASDAQ:MSFT - will break the all time high:
(click chart above to see the in depth analysis👆🏻)
If you wonder why Microsoft has been rallying +15% this month, market structure will give you an answer. In fact, the recent bullish break and retest was totally expected, and if we take into account the recent quite strong bullish behaviour, an all time high breakout will follow soon.
Levels to watch: $450
Keep your long term vision!
Philip (BasicTrading)

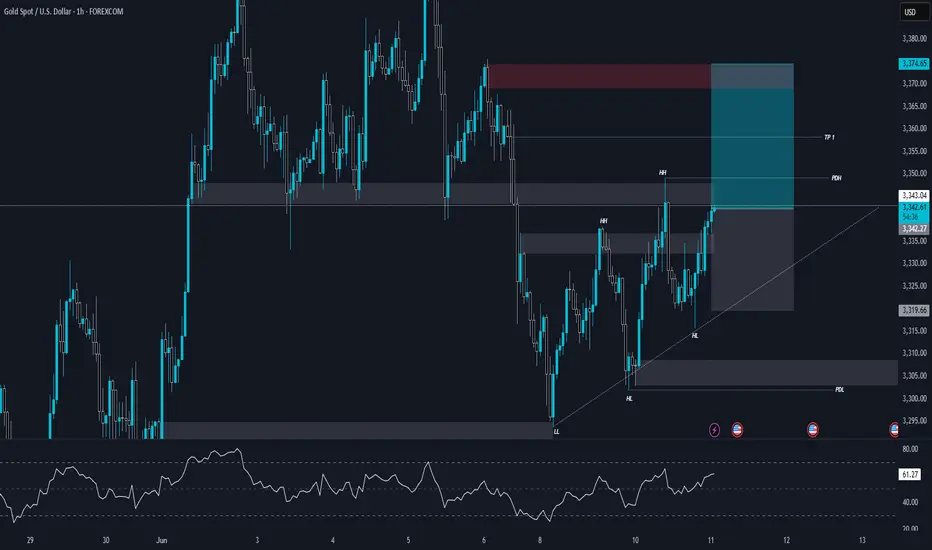
XAUUSD | 1H Chart Analysis | Uptrendurrently, Gold (XAUUSD) is showing bullish momentum after breaking previous market structure to the upside. Price has formed a clear Higher Low (HL) and Higher Highs (HH), indicating that short-term structure has shifted into an uptrend.
🔼 Key Technical Observations:
The previous LL (Lower Low) got broken, and price created a new HL, showing buyer pressure.
The bullish structure is supported by an ascending trendline.
Price is currently trading near PDH (Previous Day High) and approaching a key supply/resistance zone (highlighted in red).
RSI is still not in extreme zones but steadily climbing, showing strength in the current bullish move.
📊 Current Market Structure:
Shift from previous downtrend into short-term uptrend.
Formation of clear HL & HH.
Price respecting trendline support.
Clean bullish break of internal resistance levels.
📌 Potential Scenarios:
Scenario 1 (Bullish Continuation):
If price holds above the PDH and supply zone gets broken, we may see continuation toward TP1 and higher.
Scenario 2 (Rejection & Short-term Pullback):
If price faces strong rejection from the current supply zone, short-term retracement is possible toward the previous demand zones or trendline support.
Possible pullback zones: 3340 → 3320 → 3310 area.
✅ Bias: Short-Term Bullish
As long as price holds above the HL zone and trendline, bulls are in control. But keep an eye on price reaction around current supply zone for any signs of weakness or reversal.
Bitcoin - Here we have the all time high!Bitcoin - CRYPTO:BTCUSD - is just getting started:
(click chart above to see the in depth analysis👆🏻)
It was really just a matter of time until we see a new all time high on Bitcoin. Consindering that over the past two months alone, Bitcoin rose another +50%, this was a clear indication that bulls are taking over. But this all time high is clearly not the end of the bullrun.
Levels to watch: $300.000
Keep your long term vision!
Philip (BasicTrading)

Tesla - There's more after the +60% rally!Tesla - NASDAQ:TSLA - will blow even further:
(click chart above to see the in depth analysis👆🏻)
It is almost incredible to see such a large cap stock rally more than +60% in less than two months. But Tesla is clearly the exception and therefore we should expect the unexpected. What's quite likely is at least another rally of about 25% from here and a retest of the previous all time high.
Levels to watch: $250, $400
Keep your long term vision!
Philip (BasicTrading)

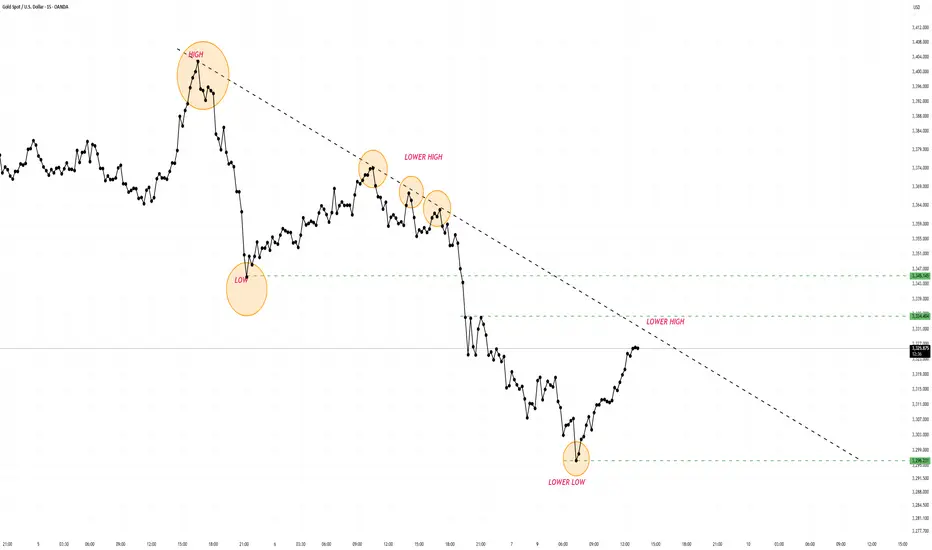
HIGHER HIGHS LOWER LOWSMarket structure is making lower highs and lower lows, indicating a short fall if hitting the trending line and also confirming breakout and retest. Keep a watch.
TSLA: Uptrend channel bounce, trading between 50 and 200-day SMAHey guys/gals!
So we all know that Tesla took a massive drop last week. It fell about 14%, and was down even 3% after hours at one point. I think we can all agree this crash wasn't technicals driven - it was clearly headline impacted. This was a clear black swan even t, and even in my case, nothing like this has ever happened to me as a trader. It was unforeseeable, forced me to hedge overnight and I'm still having nightmares (lol). Definitely one to remember as I don't think something like this would happen with any other stock. Tesla is truly unique in this sense.
But looking at the bigger picture, the bounce that we experienced on Friday must've been technicals driven, and psychologically influenced, as I am almost certain that the crash was a massive overreaction. People woke up the next day and thought this was severely discounted over a couple social media tweets (I won't go into the politics of things).
As you see on the chart, Tesla may in a new upward channel. At first I figured this may be a bear flag, however due to the upcoming catalyst like the Robotaxi launch - this would likely only be a bear flag if prices crashes below the lower support trend line.
As long as price is within the channel, I'd say things are holding up. We'd likely see a jump towards the upper side of the channel - however it's important to note that $300 and £360 are major resistance points. Robotaxi launch and any future tweets will definitely move price, and I think those will be a factor in determining whether price goes up or crashes below the trend line.
Another thing to point out is that price is currently trading between the 50-day and 200-day moving averages. The 50-day SMA is acting as vital support, whereas the 200-day SMA is the resistance. If there is a break above the 200-day SMA, price will likely go higher. The opposite may happen if price crashes below the 50-day SMA.
Either way, headlines and technicals mentioned above will continue to influence price.
Note: not financial advice.

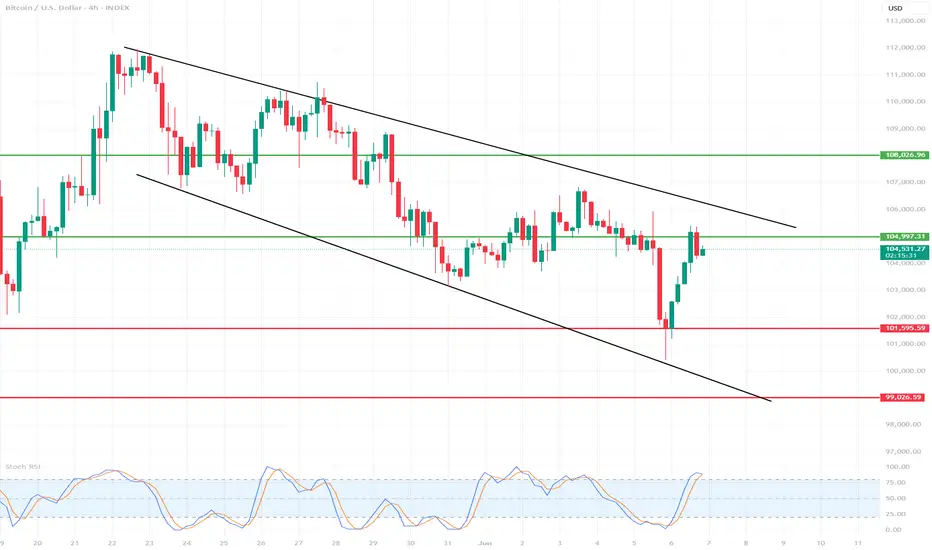
Detailed analysis of the BTC/USD 4H chart🔍1. Chart Context
Interval: 4 hours (H4)
Current price: Around 104,950 – 105,400 USD
Range of recent candles: Strong rebound after a decline to around 101,000 USD.
Lower indicator: Stochastic RSI
📊2. Price Action Analysis
Market structure
Main trend (recent days): Downtrend – from the peaks of ~114,000 USD a clear sequence of lower highs and lower lows.
Recent hours: Dynamic decline, followed by a quick, strong rebound from around 101,000 USD to ~105,000 USD.
Key technical levels
✅Resistance:
~105,500–106,000 USD – local peak of the last rebound wave and earlier lows from the end of May.
~108,000 USD – next key level, with a bigger upward movement.
Support:
~102,000–101,000 USD – bottom of the last movement, quick demand reaction, so-called “stop run” or false breakout.
~99,000 USD – psychological zone and important level in case of further declines.
📊3. Indicators
Stochastic RSI (bottom of the chart)
Currently: Stochastic RSI strongly overbought (above 80 points), both lines (blue and orange) are at the top and slightly curling.
Conclusion: Possible short-term correction/slowdown in growth. Overbought Stochastic RSI often precedes pullbacks, especially when testing important resistances.
🧠4. Possible scenarios
Bulls – Upside scenario:
If BTC breaks above $105,500 with momentum, a move to $106,000–108,000 is possible (another resistance and short squeeze).
The key will be the closing of the 4h candle above $105,500.
Bears – Downside scenario:
If the price does not break $105,500, profit taking and a pullback to $103,000–102,000 are possible.
Strong defense of the $101,000–102,000 level by the bulls – if it is broken again, it threatens to deepen the declines even to $99,000.
📊5. Additional Notes
Reduced Volatility: After such a strong bounce, there is often a period of “calmness” and consolidation.
Potential Traps: False breakouts for 4h and sudden changes in direction (characteristic of the crypto market).
📌6. Warning Signals
Stochastic RSI overbought – suggests to be cautious with long positions “on the top” without additional confirmation.
Lack of continuation after a strong bounce – if the price does not “reach” higher in the next candles, the risk of a correction increases.
🧠Summary:
Currently: BTC/USD in a short-term bounce phase after a strong decline. The price is approaching a significant resistance (~105,500 USD). Stochastic RSI shows overbought – possible correction or sideways movement.
Direction for the next few hours: Reactions at USD 105,500 (resistance) and ~USD 102,000 (support) will be key.