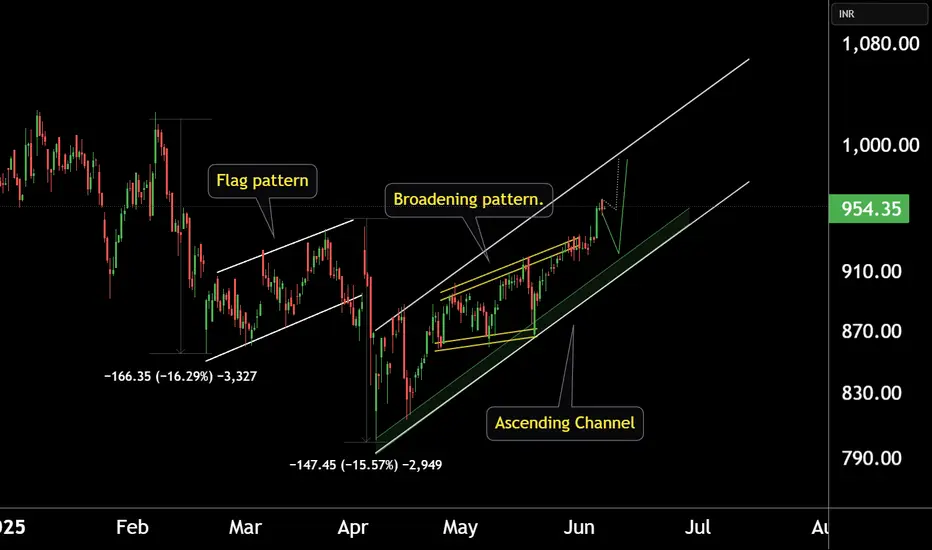
ZYDUS LIFESCIENCES AT BEST SUPPORT !!This is the 4 hour Chart of ZYDUSLIFE.
Zydus Lifesciences at good support zone near ₹920–₹930 range.
Zyduslife is moving in a Higher High and Higher Low (HH-HL) formation.
Stock has formed a broadening pattern within the channel.
If this level is sustain, we may see higher prices in ZYDUSLIFE.
THANK YOU !!
Trendlineanalysis
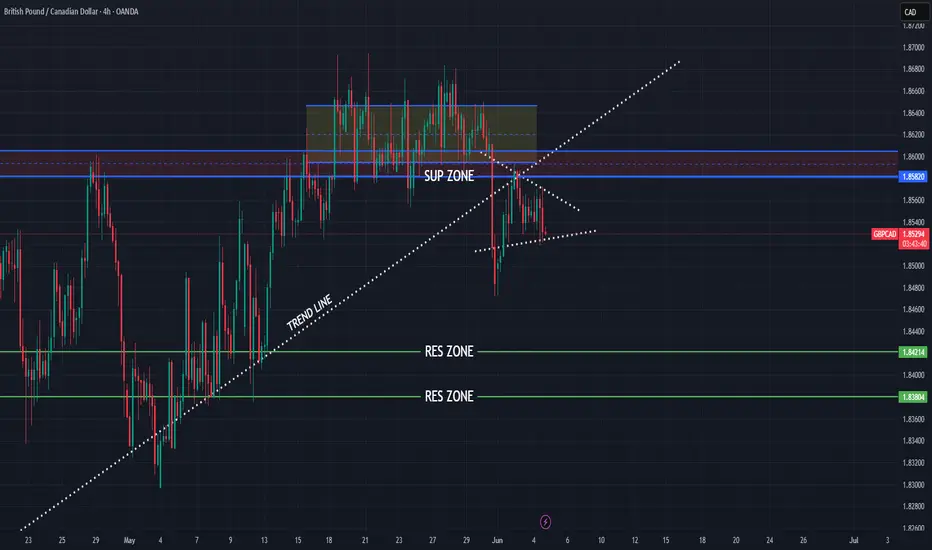
GBPCAD new bearish push expecting
OANDA:GBPCAD price break zone, currently in BEARISH PENNANT, after todays BOC event here for expect bearish push
SUP zone: 1.85800
RES zone: 1.84200, 1.83800
Ethereum - The most important analysis for 2025!Ethereum - CRYPTO:ETHUSD - is clearly shifting bullish:
(click chart above to see the in depth analysis👆🏻)
After four years of trading, Ethereum is now sitting at the exact same level compared to mid 2021. However, Ethereum has been creating a significant triangle pattern and with the recent bullish price action, a breakout becomes more and more likely. Then, the sky is the limit.
Levels to watch: $4.000
Keep your long term vision!
Philip (BasicTrading)

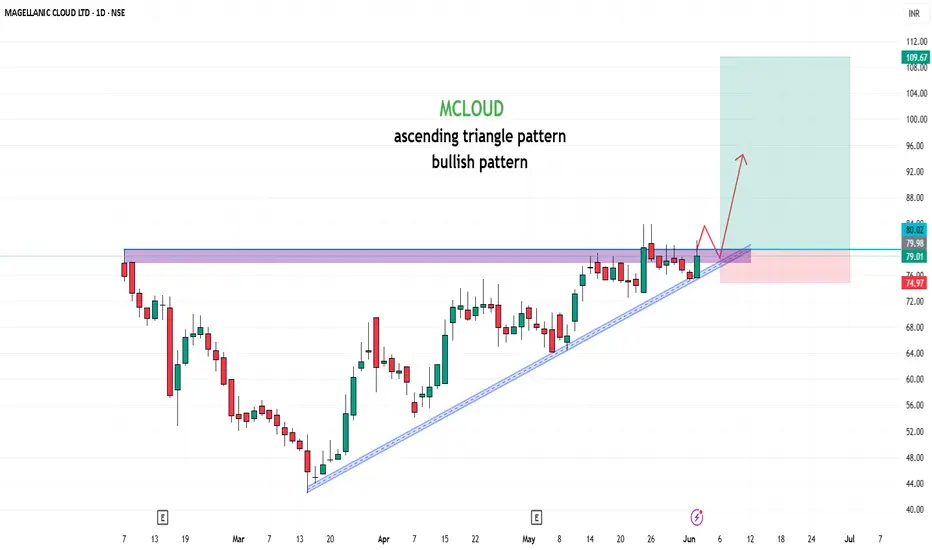
MCLOUD📊 Stock Analysis: MCLOUD
The stock has been consolidating within a ascending triangle pattern and is nearing a critical Buy Above level at ₹80 , signaling a potential breakout. The target is set at ₹179, offering a potential gain of 123.75%. Key insights:
Trend: A breakout above the wedge could indicate renewed bullish momentum.
Support Levels: Strong support around ₹75 , making this a low-risk entry point.
Volume Buzz: The recent increase in volume shows rising investor interest.
🔔 Keep an eye on this setup! Always analyze your risk tolerance before making any decisions.
📢 Disclaimer: This post is for educational purposes and not financial advice. Conduct your research or consult a financial advisor before investing.
What are your thoughts? Share them below! 📝
#StockTrading #TechnicalAnalysis #BreakoutTrading #MCLOUD
Xrp - New all time highs will come next!Xrp - CRYPTO:XRPUSD - is preparing for new all time highs:
(click chart above to see the in depth analysis👆🏻)
Xrp has clearly been trading sideways for the past 8 years. Meanwhile, market structure is respected perfectly and it seems to be just a matter of time until Xrp will create new all time highs. With the recent bullish break and retest, this scenario becomes even more likely.
Levels to watch: $3.0
Keep your long term vision!
Philip (BasicTrading)

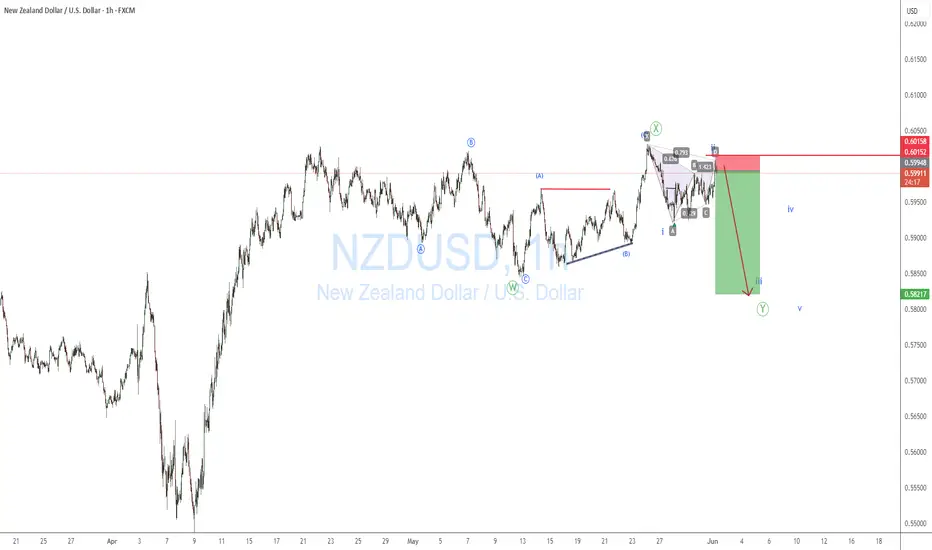
NZDUSD SHORTNZDUSD could possible short to complete a C leg of a possible expanded flat or running flat correction before the big buy
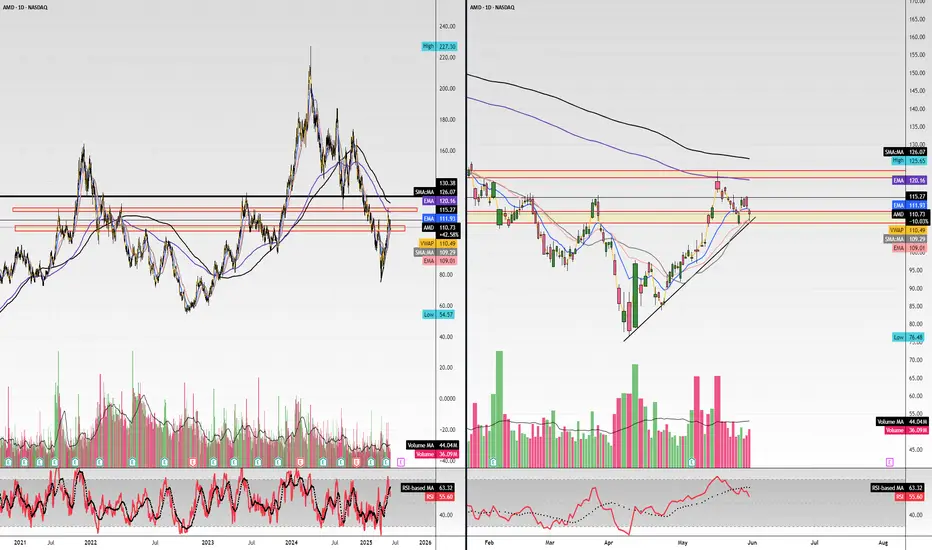
$AMD $120 retest then $130 push through. R/R looks incredible..Hello, NASDAQ:AMD Advanced Micro Devices, INC looks TASTY. I'm almost salivating. NASDAQ:NVDA may take a backseat and NASDAQ:AMD could start seeing monster upside. Something in my gut is telling me this name wants to GO. I'm looking at $120c for 6/20 and $130c for 6/20. This thing can launch.. it's hanging on an upside trendline, it may break but this $110 area may represent local support. Earnings report were good and after an abysmal 2024 after having highs and totally wiping them out hitting lows of $80, I think this could be the time for NASDAQ:AMD longs. It has taken the 20 day EMA/SMA over and now could curl to the 200 day EMA/SMA. 200 SMA is $126. This seems like a really good setup especially R/R here. Very cheap calls for a name that can see a 10-15% week.
WSL.
Taming the Trend: Mastering the Williams Alligator IndicatorEver wondered how to spot when the market is sleeping or ready to roar? At Xuantify , we use the Williams Alligator Indicator to decode market behavior with precision. Whether you're trading crypto, forex, stocks, or indices — this tool adapts across all markets. Let's take a closer look using BINANCE:BTCUSDT
🧠 How We Use It at Xuantify
We treat the Alligator as a trend confirmation and timing tool . We don’t just look for crossovers — we analyze the distance , angle , and alignment of the lines to gauge market momentum and trend maturity. It’s especially powerful when combined with volume and volatility filters.
⭐ Key Features
Three Smoothed Moving Averages
Jaw (Blue) : 13-period, shifted 8 bars forward
Teeth (Red) : 8-period, shifted 5 bars forward
Lips (Green) : 5-period, shifted 3 bars forward
Visual Trend Clarity :
The spacing and direction of the lines reveal trend strength and direction
Built-in Delay :
Forward shifting helps anticipate rather than react
💡 Benefits Compared to Other Indicators
Trend Clarity
Alligator : Strong — bold trend visualization
Moving Averages : Moderate — can lag or overlap
MACD : Good — clear histogram and signal line
Noise Filtering
Alligator : Excellent — smooths out market noise
Moving Averages : Low — sensitive to short-term fluctuations
MACD : Good — filters minor moves
Early Signals
Alligator : Moderate — waits for confirmation
Moving Averages : Fast — quick crossovers
MACD : Fast — early divergence signals
Visual Simplicity
Alligator : Clear — easy to interpret trend phases
Moving Averages : Cluttered — multiple lines can overlap
MACD : Complex — requires interpretation of histogram + lines
⚙️ Settings That Matter
For shorter timeframes : Reduce periods (e.g., 8-5-3) for faster signals
For longer timeframes : Stick with defaults or increase smoothing for clarity
Shift values : Keep them forward-shifted to maintain predictive edge
📊 Enhancing Signal Accuracy
Wait for clear separation between the lines
Confirm with volume spikes or breakouts
Use price action (e.g., higher highs/lows) as confirmation
🧩 Best Combinations with This Indicator
Fractals : For entry/exit signals
ATR : For dynamic stop-loss placement
RSI or Stochastic : To avoid overbought/oversold traps
Volume Profile : To validate breakout zones
⚠️ What to Watch Out For
Flat Alligator = No Trade Zone : Avoid trading when lines are tangled
Lag in Fast Markets : In high-volatility assets, the Alligator may react late
Over-reliance : Always combine with other tools for confirmation
🚀 Final Thoughts
The Williams Alligator isn’t just an indicator — it’s a market behavior model . At Xuantify, we use it to stay aligned with the market’s rhythm, avoid chop, and ride trends with confidence.
🔔 Follow us for more educational insights and strategy breakdowns!
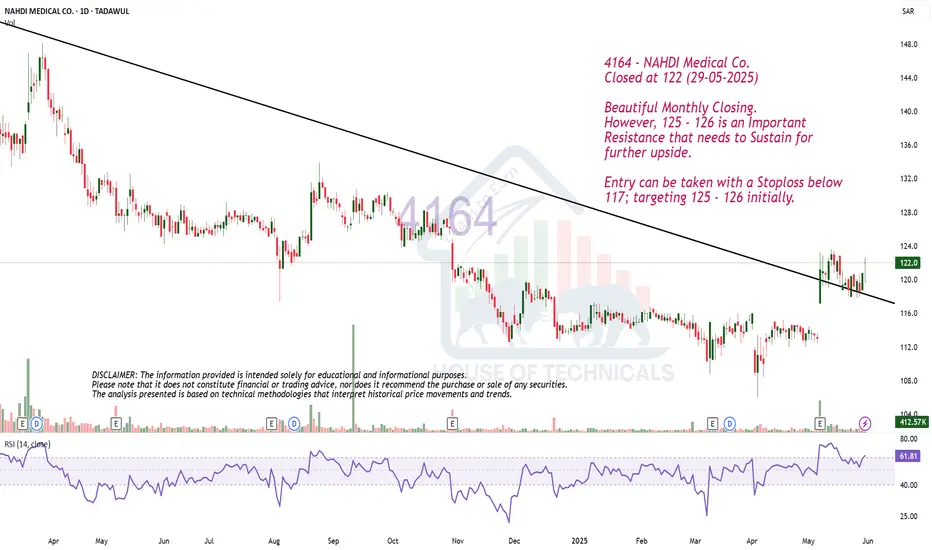
Beautiful Monthly Closing.
Closed at 122 (29-05-2025)
Beautiful Monthly Closing.
However, 125 - 126 is an Important
Resistance that needs to Sustain for
further upside.
Entry can be taken with a Stoploss below
117; targeting 125 - 126 initially.
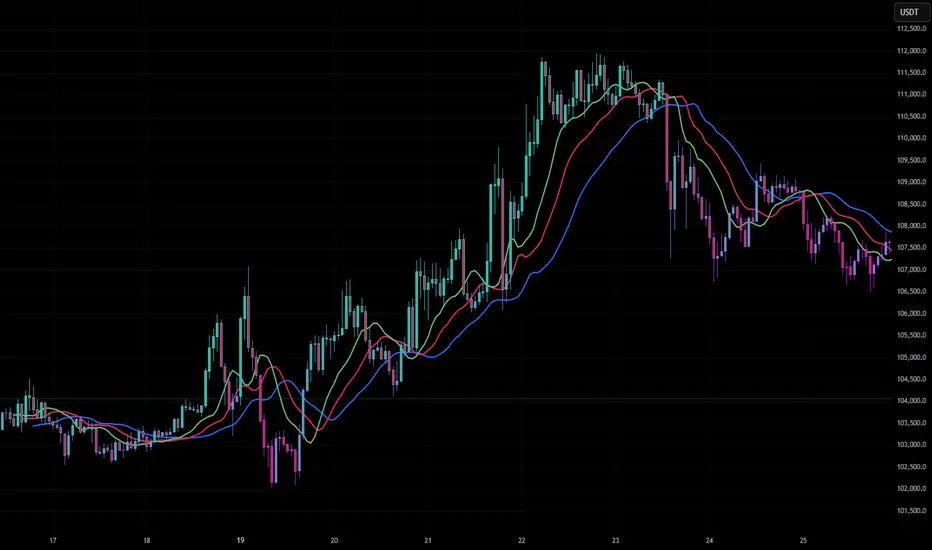
BTCUSD Price action analysis on HTFHi, I’m from Phoenix FX, and today I’ll be sharing my perspective on Bitcoin (BTC) price action based on the higher timeframes.
I’ll also give you my outlook on potential trade setups for today and tomorrow. Please remember that this is not financial advice—use this information as a guide only. If you find it helpful, don’t forget to like and share it with your like-minded communities.
Higher Timeframe Analysis
In my view, BTC tends to follow clear bullish and bearish cycle zones. Typically, we see a pump to new all-time highs (ATH), followed by the formation of resistance and a retracement down to a key support level. Our trading approach focuses on identifying those critical support and resistance levels, with some interim trades based on shorter-term analysis—occasionally even counter-trend, depending on the day’s market bias.
Over the past eight years, BTC has respected a major trend resistance line. The most recent ATH, around $112K, reconfirmed the relevance of this trendline. This makes it a valuable tool for projecting future ATH levels.
Looking ahead, I expect a move towards the $115K level in the coming weeks. This would likely act as a point of resistance, at which stage we might see a reversal and a drop back down to a key support zone.
Trade Setup
The chart I'm referencing highlights what I would consider the first premium buy zone, identified using a 4-hour Fair Value Gap (FVG).
The 50% level of this zone sits at $99,450. If this zone fails to hold, we may drop further to the secondary premium buy zone, which aligns with our higher timeframe (HTF) trend support and a weekly FVG. The 50% level of this deeper zone is around $89,150.
A potential long entry at $92,550, with a stop loss around $88,000, offers an excellent risk-to-reward (RR) ratio, targeting a move up to the $115K level.
Intraday Outlook
For today, I see bearish price action, with potential rejection around the $104,300–$105,000 range. Go short around the $104,750 to $105,000 zone
This could lead to a move down toward the lower key zones highlighted in the HTF analysis.
I recommend taking partial profits (TP) at every $1,000 increment and setting your stop loss to breakeven (BE) after hitting the first target.
Final Thoughts
Price action analysis is always subjective, so I’d love to hear your thoughts and ideas in the comments—each one, teach one.
Thanks for giving me some of your time.
From the Phoenix FX team, have a great weekend!

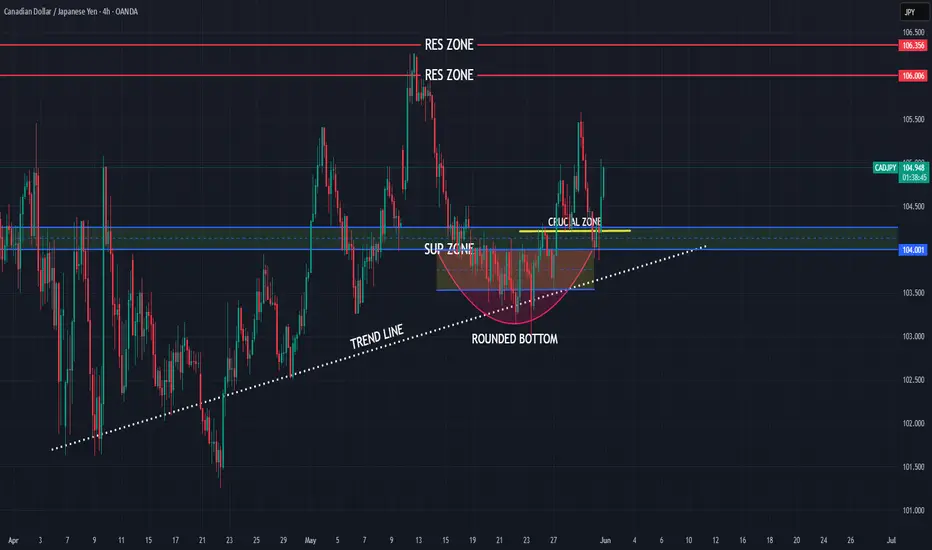
CADJPY higher bullish for expect
OANDA:CADJPY price is make push on trend line and ROUNDED BOTTOM pattern is be created on trend line, with zone inside, which are also breaked.
Here for next week, bullish continuation to expect.
SUP zone: 104.250
RES zone: 106.000, 106.350
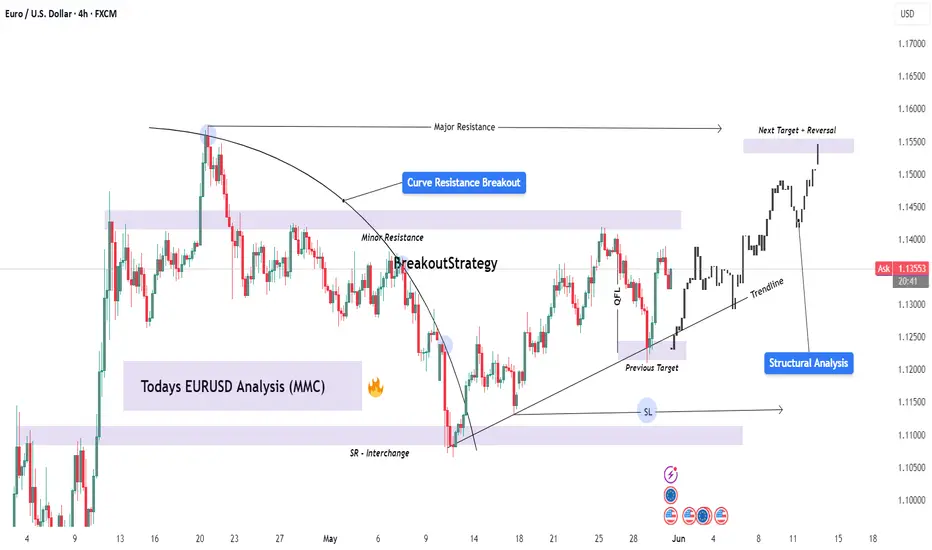
EURUSD Structural Analysis | Curve Breakout to Key Reversal Zone🔍 Structure Analysis:
The EURUSD pair has been exhibiting classic smart money behavior following a reaccumulation phase beneath a curved resistance structure. This curve acted as a dynamic liquidity ceiling, engineered to trap breakout traders during early sessions and encourage early shorts — only to be invalidated later by institutional momentum.
What we now see is a clean structural breakout, a shift in market sentiment, and a precision drive toward premium liquidity zones, where we expect reactions from institutional orders or profit-taking.
📐 Technical Breakdown:
🔹 1. Curved Resistance Breakout (Trend Manipulation Layer)
The curve represents a multi-touch descending resistance line that was gradually compressing price.
Multiple rejections created a false sense of bearish continuation, but in reality, smart money was accumulating positions under the curve.
The final breakout was impulsive and occurred on elevated volume, breaking both the curve and a short-term bearish structure.
🔹 2. Bullish Market Structure Confirmation
Higher highs and higher lows are now clearly established.
After the curve break, the price pulled back slightly, respecting the new trendline support — a sign of retest behavior and continuation.
The previous internal structure break was confirmed after a key swing high was violated, flipping the order flow to bullish.
🔹 3. SR Interchange + QFL Demand Zone
The 1.11800–1.12200 zone held firm during the retracement, previously acting as a strong resistance and now a support flip.
This zone coincides with a QFL-style accumulation base — a concept based on sudden dips into support where big orders are filled before sharp reversals.
Wick rejections and candle closes show strong interest by buyers.
🔹 4. Trendline & Structure Alignment
A clean ascending trendline is acting as dynamic support.
Each touch on the trendline has been followed by bullish expansion — another indication of institutional order flow support.
This trendline also aligns with internal FVGs (Fair Value Gaps), offering more confluence.
🔹 5. Liquidity Magnet: Next Major Zone
The next key area is marked around 1.15500–1.15750, which is a previous structural high, order block, and likely liquidity pool for pending sell-side orders.
This area is expected to act as a magnet, pulling price toward it before a potential reversal or redistribution phase begins.
📊 Trade Management Plan:
Parameter Details
Bias Bullish (Short-Term to Mid-Term)
Entry Zones Retest of trendline or minor FVGs
TP1 1.14500 (interim supply)
TP2 (Main) 1.15500–1.15750 (major liquidity zone)
SL Below 1.11800 (invalidates bullish idea)
RR Target 1:2.5 to 1:3 depending on entry precision
🧠 Concepts Applied:
Smart Money Concepts (SMC)
Break of Structure (BOS) & Change of Character (CHOCH)
Curve Manipulation / Compression
SR Flip (Support-Resistance Interchange)
QFL (Quasimodo Failure Level)
Trendline + FVG Confluence
Liquidity Pool Targeting
Volume Expansion Breakout Confirmation
🛎️ Watchlist Notes & Trade Expectations:
Expect short-term pullbacks into the 1.13000–1.13200 zone for liquidity re-tests.
Watch for reaction or sweep near 1.15500 — this is where short-term sellers may enter, and institutions may offload.
If price holds above the trendline and consolidates near the high, a continuation leg to even higher targets (1.16500) is possible — depending on macro conditions.
✅ Conclusion:
This EURUSD setup is a high-probability opportunity shaped by smart money behavior and deep structural context. The combination of the curve breakout, trendline strength, and liquidity targeting provides a clear roadmap for execution and management.
Use this analysis as a framework — always confirm with price action and risk management aligned with your personal strategy.
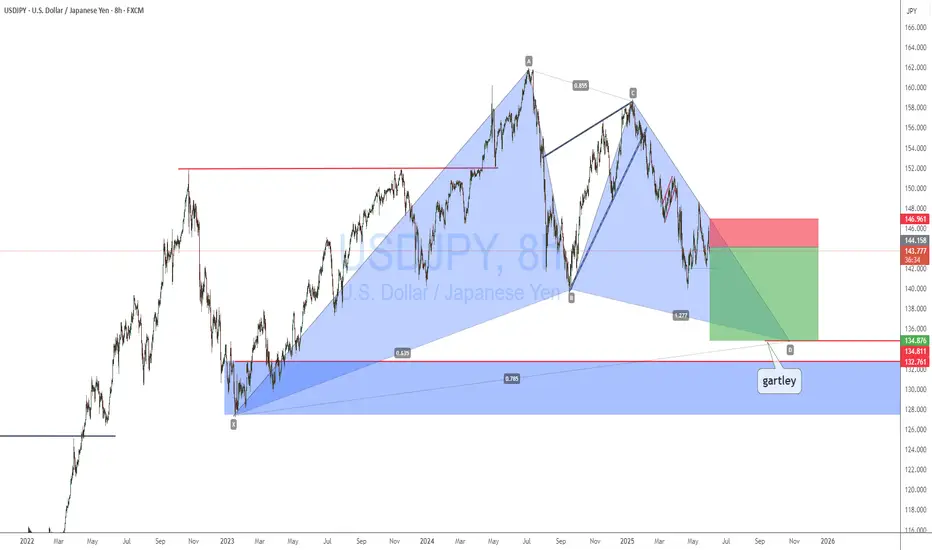
USDJPY SHORTUSDPY is expected to sell to complete the gartley pattern.
Look out for the quasimodo pattern on the 4hr or 8hr time frame to short
EURJPY SHORTwith safe haven assets expected to be bullish, i expect JPY to be strong against risk on currency like euro. EURJPY is expected to fall to complete a triange formation in the coming weeks before the bullish impulsive leg.

Nvidia - The bullish consolidation flag!Nvidia - NASDAQ:NVDA - is still quite bullish:
(click chart above to see the in depth analysis👆🏻)
After Nvidia retested a major horizontal support just last month, we witnessed an extremely strong bullish reversal candle which resulted in a strong +50% rally. Considering the bullish flag consolidation, a breakout is much more likely, but not in the immediate future.
Levels to watch: $150
Keep your long term vision!
Philip (BasicTrading)

Apple - Please look at this chart!Apple - NASDAQ:AAPL - is just wonderful:
(click chart above to see the in depth analysis👆🏻)
Last month, Apple created a quite strong bullish rejection wick of about +25%. It was actually no surprise at all, because market structure was perfectly pushing price higher. Following the bullish break and retest pattern, new all time highs will most likely follow.
Levels to watch: $200, $300
Keep your long term vision!
Philip (BasicTrading)

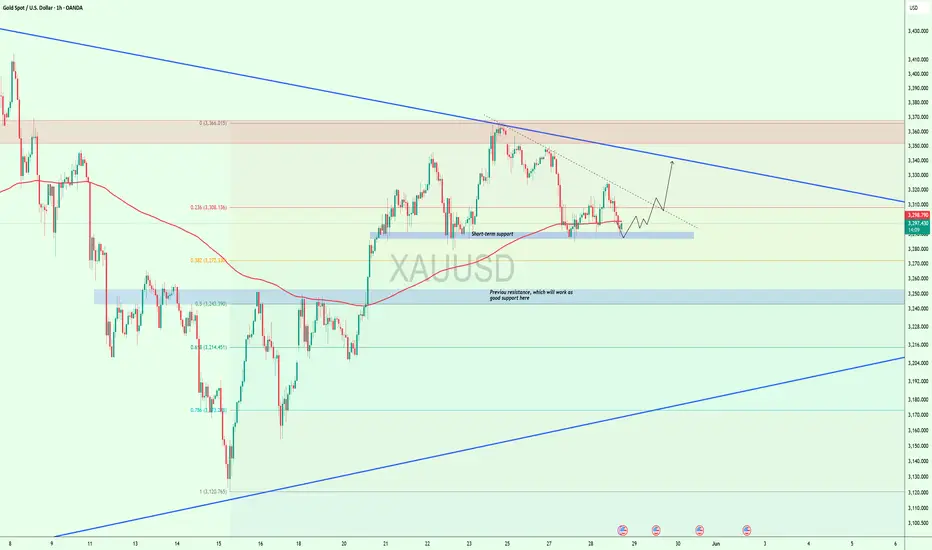
$XAUUSD Holding Key Support – Bounce Incoming?OANDA:XAUUSD is holding firm at the short-term support zone around $3,290–$3,295. This zone also aligns with the 200 EMA, adding strength to the current level.
Price previously flipped this resistance into support, now acting as a solid demand zone.
If we hold here, a potential push toward $3,330–$3,360 could follow.
Sellers remain active near the upper range, so monitor reactions closely.
DYOR,NFA
OANDA:XAUUSD TVC:XAU
TESLA - POSTIONS ACCMULATING OR MARKET CONFUSION !!!!Hi, Tesla is making series of HH and HL. Bullish trend line can also be seen. however, it is in consolidation phase since long. currently the market is trading near the strong resistance level of 409. if the market break this support level and even breaks the previous HH which is 482 then we can expect market to take a bull ride.
Trade entry plan is to set BUY STOP order type at the mentioned Entry Point. once the trade is executed we can Set Stop Loss slightly below the previous HL /support level.
TP1 and TP2 are placed with 1:1 and 1:2 Reward to Risk ration

GBPUSD - SO MANY BULLISH CONFLUENCES ! Bullish Indications:
1- Market is making series of HH and HL
2- Market respected Trend line resistance and bounced back
3- Market respected support level (important support level)
4- Market retraced from FIB 0.382 and 0.618 zone of
5- Market took support - followed by Bullish Haram Candle
Entry point - Instant Buy
SL below last LH (Although too much, but safe play)
TP1 and TP11 (with 1:1 and 1:2)

Trendline Support - CCLCurrent Price: ₹841.75
Technical Analysis:
Trendline Pattern Support taken: The chart clearly shows CCL Products (India) Ltd. taking support from a long-term upward trendline. This is generally a strong bullish signal, indicating that the price has found a floor at this level and could potentially continue its long-term upward trajectory.
Target: Double or Multibagger stock: This implies a significant long-term increase in the stock price.
Time Frame: 1 Year to 3 Year (This suggests a medium to long-term investment horizon for this ambitious target).
Fundamental Analysis (Based on the provided images for CCL Products (India) Ltd.):
Market Cap: As of late May 2025, CCL Products (India) Ltd. has a market capitalization in the range of ₹10,000 - ₹11,000 Cr.
P/E Ratio: The P/E ratio for CCL Products generally fluctuates, but it tends to trade at a premium due to its strong market position in the coffee industry.
Quarterly Results (Q4 FY25 - ended March 31, 2025):
CCL Products recently announced its Q4 FY25 results. Consolidated Net Profit after tax for Q4 FY25 was ₹67.63 crore, showing a slight decrease compared to ₹75.64 crore in Q4 FY24.
Revenue from Operations for Q4 FY25 was ₹501.99 crore, which was also slightly down from ₹521.84 crore in Q4 FY24.
Yearly Results (FY25 - ended March 31, 2025):
For the full fiscal year FY25, consolidated net profit after tax was approximately ₹255 crore, compared to ₹277.6 crore in FY24.
Consolidated revenue from operations for FY25 was approximately ₹1,980 crore, down from ₹2,112 crore in FY24.
Corporate Actions:
Dividend: CCL Products has a consistent track record of paying dividends. For FY25, the company's board has recommended a final dividend of ₹2.50 per equity share.
Capacity Expansion/New Initiatives: The company has been in the news for its ongoing capacity expansion projects and initiatives, particularly in its instant coffee segment, aimed at driving future growth.
Company Order Book:
For a company like CCL Products, the "order book" is typically reflected in its long-term contracts and recurring sales with global private label clients. While specific order book values are not usually disclosed, the company's consistent revenue generation suggests stable demand for its products.
Latest News:
Q4 FY25 Results: The primary recent news revolves around their Q4 FY25 earnings, which showed a slight decline in both profit and revenue, primarily due to prevailing demand and pricing conditions in the international coffee market.
Capacity Expansion: Ongoing focus on the commissioning of new facilities and increased capacity, particularly for granular coffee.
Market Conditions: News related to global coffee prices, demand trends, and competitive landscape in the instant coffee market.
Overall Assessment:
CCL Products (India) Ltd. presents a mixed picture:
Technical Strength: The chart clearly shows the stock taking Trendline Support, which is a strong bullish technical indicator suggesting a potential rebound or continuation of its long-term uptrend.
Fundamental Headwinds (Recent): The latest quarterly and yearly results (FY25) show a decline in both net profit and revenue. This indicates some short-term challenges, likely related to market conditions in the coffee industry.
Long-Term Potential: Despite recent headwinds, CCL has a strong brand reputation, a significant presence in the global instant coffee market (especially in private labels), and a history of growth. Its ongoing capacity expansion is a key driver for future revenue.
Valuation: The stock generally trades at a premium due to its quality and market position.
The target of being a "Double or Multibagger" within a 1 to 3-year timeframe is ambitious. For this to be achievable, the company needs to demonstrate a strong turnaround in its profitability in the upcoming quarters, leveraging its expanded capacity and navigating the volatile coffee market successfully. The trendline support suggests a good entry point if the fundamentals begin to show a recovery.
Disclaimer: This analysis is for informational purposes only and does not constitute investment advice. Always conduct your own thorough research, carefully analyze the stock chart for the specific trendline support, assess your risk tolerance, and consult with a qualified financial advisor before making any investment decisions. The stock market carries inherent risks.

Trendline Support - MINDACORPCurrent Price: ₹550
Technical Analysis:
Trendline Pattern Support taken: The chart indicates that the stock has taken support from a trendline. This is generally a bullish sign, suggesting that the price has found a floor and could potentially rebound or continue its upward trajectory. The chart shows a clear uptrend line with several points of support.
Target: Double or Multibagger stock: This is an ambitious long-term target, implying a significant increase in the stock price.
Time Frame: 1 Year to 3 Year (This indicates a medium to long-term investment horizon for this target).
Fundamental Analysis :
Market Cap: ₹13,152 Cr.
Stock P/E: 51.5 (This is a premium valuation, higher than the industry average, indicating market expectations of future growth).
Book Value: ₹87.9
Face Value: ₹2.00
Sales (Revenue from Operations): Consistently growing, from ₹1,590 Cr in Mar 2014 to ₹5,056 Cr in Mar 2025.
Operating Profit: Generally increasing, from ₹127 Cr in Mar 2014 to ₹575 Cr in Mar 2025.
Net Profit: Shows consistent growth, from ₹79 Cr in Mar 2014 to ₹255 Cr in Mar 2025.
EPS in Rs.: Increased from ₹3.79 in Mar 2014 to ₹10.68 in Mar 2025.
Compounded Sales Growth: 1 Year: 9%, 3 Years: 19%, 5 Years: 18%, 10 Years: 10%.
Compounded Profit Growth: 1 Year: 12%, 3 Years: 15%, 5 Years: 27%, 10 Years: 11%.
Return on Equity: Last Year: 16%, 3 Years: 15%, 5 Years: 14%, 10 Years: 12%.
Corporate Actions:
Dividend: The Dividend Payout % has varied but has been consistently paid, with a 10% payout in Mar 2025.
Recent News: Any news regarding new client wins, expansion plans (especially related to electric vehicles or advanced automotive technologies), or strategic partnerships would be relevant for Minda Corporation, a leading automotive components manufacturer.
Overall Assessment:
Minda Corporation presents a mixed but potentially bullish picture:
Technical Strength: The stock has taken Trendline Support, suggesting technical strength and a potential continuation of its upward trajectory as seen on the chart. The stock is in a clear long-term uptrend.
Consistent Growth: The company has demonstrated consistent growth in Sales, Operating Profit, and Net Profit over the long term (10 years, 5 years, 3 years), which is a significant positive.
Healthy Financials: Low Debt to Equity (0.25), strong ROCE (16.0%), and ROE (12.9%) indicate good financial health and efficient management.
Valuation: The Stock P/E of 51.5 is significantly higher than the Industry P/E of 26.9. This premium valuation suggests that the market has high expectations for Minda Corp's future growth, likely driven by its position in the evolving automotive sector (e.g., EV components).
The target of being a "Double or Multibagger" stock within a 1 to 3-year timeframe is ambitious but potentially achievable for a company with strong long-term growth and a premium valuation if it continues to deliver on market expectations and capitalize on industry trends (like the shift to EVs).
Disclaimer: This analysis is for informational purposes only and does not constitute investment advice. Always conduct your own thorough research, carefully analyze the stock chart for the specific trendline support, assess your risk tolerance, and consult with a qualified financial advisor before making any investment decisions. The stock market carries inherent risks.

Bitcoin - Approaching the all time high!Bitcoin - CRYPTO:BTCUSD - will break out again:
(click chart above to see the in depth analysis👆🏻)
It has been quite some time since we saw such a strong move on Bitcoin. But finally - not totally unexpected to be honest - Bitcoin is following its destiny and about to create another new all time high. Patience is key and strategy, risk and mindset will help you master the volatility.
Levels to watch: $100.000
Keep your long term vision!
Philip (BasicTrading)

Equity Research Flash – BEML Ltd.CMP: ₹3,242.10 | Breakout From Falling Trendline
BEML has decisively broken out of a falling trendline and is now sustaining above a key consolidation zone. With strong bullish candles, a rising RSI, and healthy volume spike, the stock signals bullish momentum. Immediate resistance lies at ₹3,420–₹3,480. Sustained move above could target ₹3,750+. 20/50 EMA crossover supports the upward trend. Traders may consider entries on dips with SL near ₹3,080.
For educational purposes only
