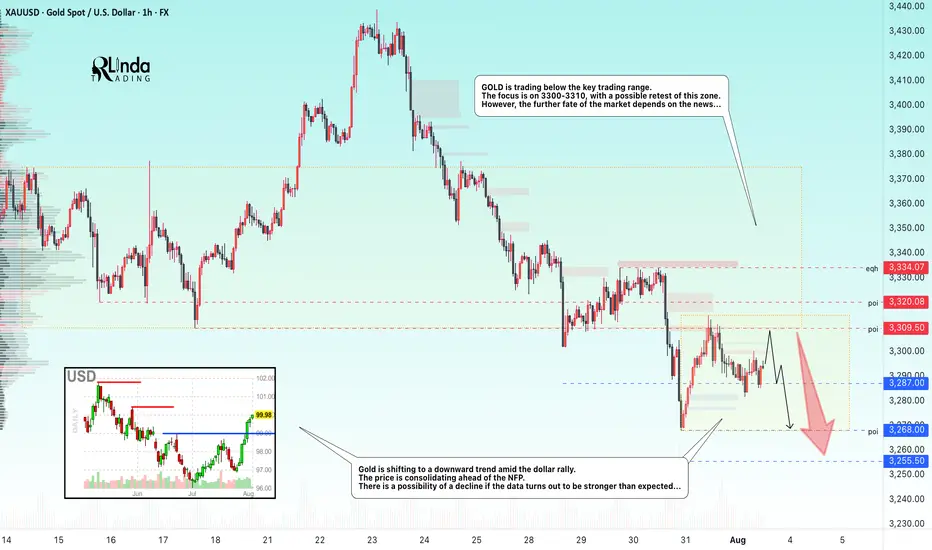
GOLD → The market is waiting for NFP. What could happen?FX:XAUUSD is bouncing off resistance at 3310, confirming the upper limit of the new trading range. The dollar continues to rally, but the market as a whole is stagnating ahead of upcoming news—NFP is coming up!
Gold is consolidating at monthly lows around $3268, awaiting key US labor market data (NFP). Trump's new tariffs (10% globally, 35% for Canada, 39% for Switzerland) have boosted demand for the dollar, putting pressure on gold. Markets are waiting for NFP: forecast +110K jobs, unemployment 4.2%. Weak data (<100K) → gold may rise to $3400. Strong (>150K) → the dollar will strengthen, gold will continue to fall. The probability of a Fed rate cut in September is <50%.
Based on yesterday's data, I would cautiously suggest that NFP will be in the range of 125K–145K, slightly above the consensus (110K). This will play into Trump's hands (I think you understand what I mean...).
Resistance levels: 3300, 3310, 3320
Support levels: 3287, 3268, 3255
The news has a negative nuance — unpredictability. Be careful.
Technically, based on the data we have at the moment, I would assume that the market may test resistance at 3300-3310 before a possible pullback to the specified support. BUT! Unpredictable data could turn the game around, and in that case, if the dollar falls, gold could start to rise.
Best regards, R. Linda!
Trend Line Break
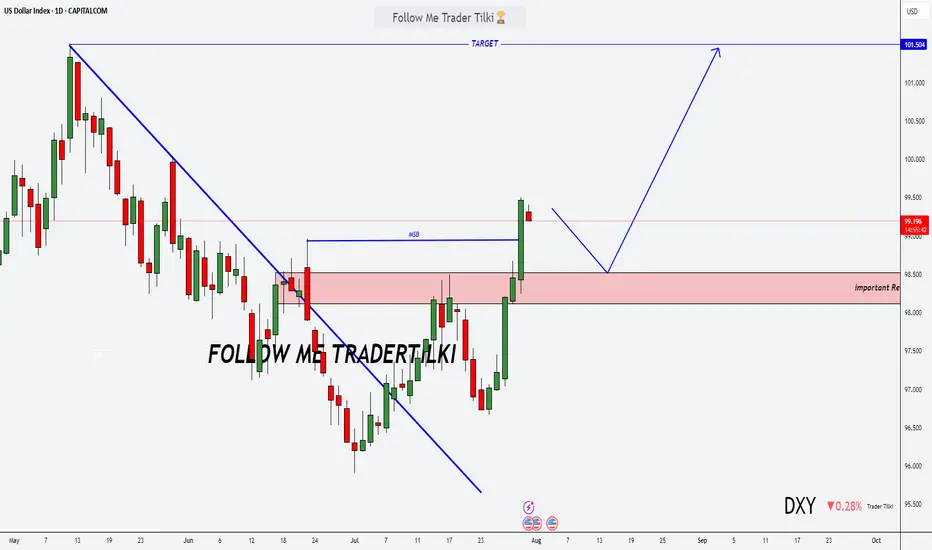
DXY Just Broke Through the Lock… Where’s the Market Headed Now?🌅 Good Morning, Friends!
A few days ago, I marked 98.950 as a key threshold for the DXY index. As of today, that level has officially been broken—and the bullish momentum we anticipated is now kicking in. 📈
The next target? 101.000.
That said, it’s crucial to remember: DXY is heavily influenced by fundamental data. Stay alert and keep a close eye on key economic developments—they’re essential for navigating this move.
This breakout validates the analysis I shared with you all. And it wasn’t just about charts—it was about discipline, precision, and timing.
Every single like from you is a huge boost to my motivation. Thanks from the heart—your support drives me to keep sharing these insights! 💙
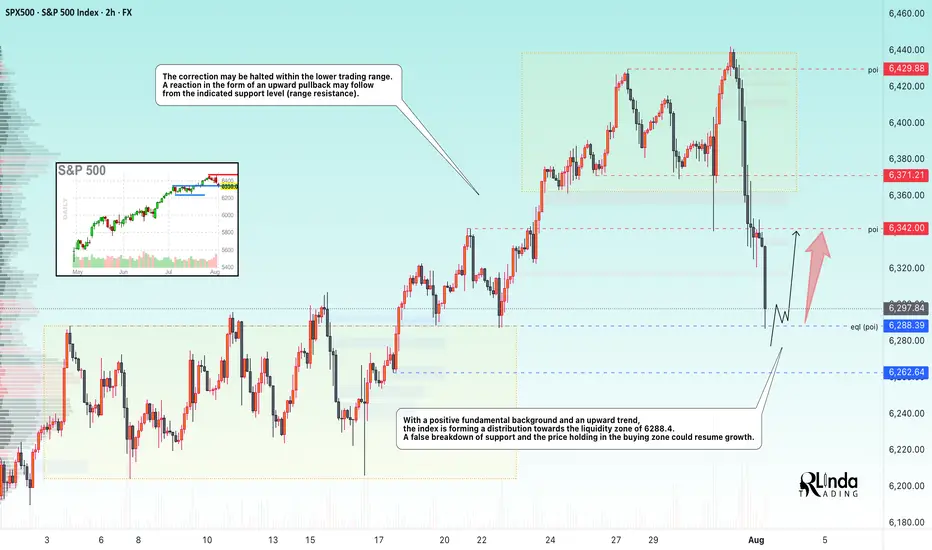
SP500 → Countertrend correction before growthFX:SPX500 is correcting against an upward trend. In the second half of the week, the market received fairly positive fundamentals during the reporting period.
S&P 500 futures found support after strong reports from Meta and Microsoft, which exceeded earnings expectations and forecasts thanks to AI. The rise in futures supported demand for the “Magnificent Seven” despite Powell's hawkish comments. The focus is on Apple and Amazon reports in the evening, which could strengthen the tech rally. On Friday, we are seeing a countertrend correction in which the market is testing the 6288 zone of interest.
Support levels: 6288.4, 6262.6
Resistance levels: 6342, 6371
Most likely, the market will form a false breakout of support during the correction. If the bulls keep the index above the key level, we can expect continued growth in the short and medium term.
Best regards, R. Linda!
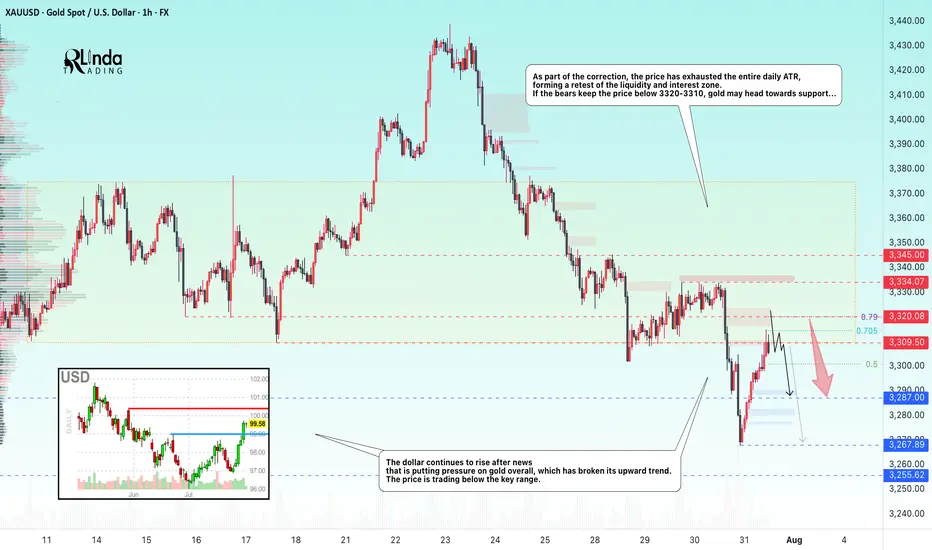
GOLD → Retest of resistance within a bearish runFX:XAUUSD breaks through the upward trend support amid a rallying dollar. Since the opening of the session, the price has been testing the zone of interest, but bears are quite aggressive...
Gold is partially recovering after falling to $3,268, a monthly low caused by the Fed's hawkish tone. The Central Bank kept its rate at 4.25–4.5% (9 votes to 2), highlighting uncertainty due to Trump's tariffs. Markets now estimate the probability of the rate remaining unchanged in September at 58% (previously 35%). The dollar's rise slowed amid concerns about the extension of the US-China trade truce and profit-taking ahead of key US employment data (after strong ADP and GDP reports). The nearest drivers are labor market statistics and trade news, while the technical picture for gold remains bearish.
Technically, on D1, the price is breaking key support zones, including the trend line, which overall only increases selling pressure on the metals market...
Resistance levels: 3310, 3320, 3334
Support levels: 3287, 3267, 3255
As part of the correction, the price has exhausted the entire daily ATR, forming a retest of the liquidity and interest zone. If the bears keep the price below 3320-3310, gold may head towards support...
Best regards, R. Linda!
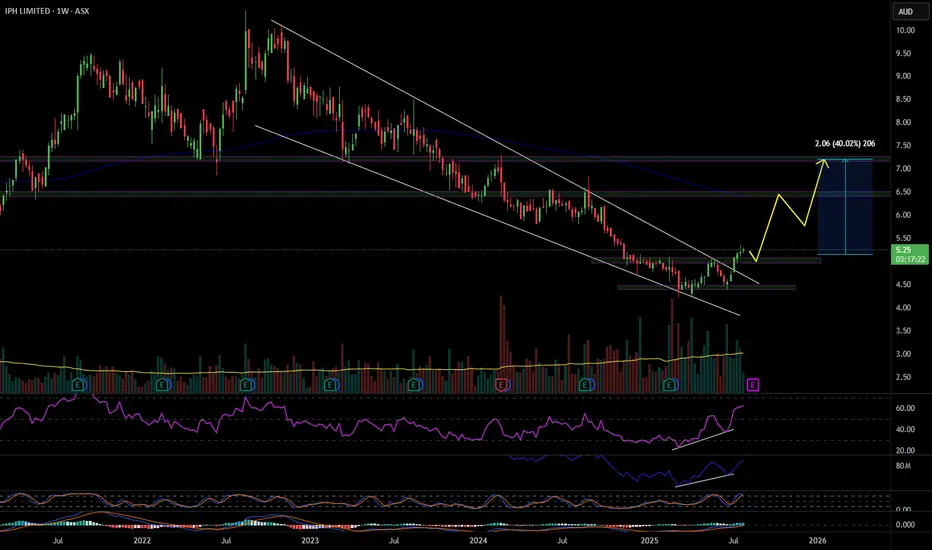
IPH 40% move coming?IPH has recently emerged from a descending wedge pattern, supported by bullish divergences in both the RSI and OBV, along with several divergences observed in shorter time frames. A pullback to the $5 level is anticipated, as the stock appears weaker on these smaller time frames. If IPH can maintain its position above the recent low of $4.40, it will indicate a structural shift, establishing higher highs and higher lows. My initial target is in the $6.50 range, followed by a potential move just above $7, representing a 40% increase. Good luck and happy trading 🍀
XRPUSDT → Range formation. Retest of resistanceBINANCE:XRPUSDT.P , after a false breakout of the daily resistance level of 3.352 and the elimination of traders, has entered a correction phase. The trading range shown below has been formed, with an emphasis on resistance...
XRP previously formed a false breakout of the daily resistance level of 3.352, as indicated in the idea above. After changing its market character, the price entered a correction phase. Focus on the range of 3.00 - 3.264. A retest of resistance (zone of interest and liquidity) is possible before falling to 3.161, 3.05 or to the liquidity zone of 3.00. There are no technical or fundamental reasons for exiting the consolidation; most likely, a retest of the zone of interest may end in manipulation and a pullback to support...
Resistance levels: 3.1609, 3.264, 3.352
Support levels: 3.05, 3.00
I do not rule out the fact that a retest of the 3.264 resistance level may have a breakout structure and the price will continue to rise, but based on the price behavior pattern on D1, the market structure, and market stagnation, I conclude that at the moment, the chances of seeing a correction from resistance are higher. Further developments will need to be considered after the retest of key zones on the chart...
Best regards, R. Linda!

Gold Market Update: Major Support at and Supply atGold is recovering after a strong drop from the previous range high. Price is approaching a 4H Order Block near the 3300–3310 zone, which may act as a supply area. A minor liquidity zone has just been tapped, suggesting a potential short-term rejection.
The major support lies at 3269, which sparked the recent bullish move. If price rejects from the OB zone, a pullback toward this support is likely. However, a clean break and hold above the OB may signal further upside.
📌 Key Levels:
Supply Zone: 3300–3310
Support: 3269
🧠 Wait for clear confirmation before executing trades.

BITCOIN → Correction within a downward channel. 112K or 125K?BINANCE:BTCUSDT is consolidating. However, a local downward trading range is forming relative to the current setup. What is the probability of a correction continuing to 112K or growth to 125K?
Daily structure: a local correctional channel within a global bullish trend. We have cascading resistance at 119.2, 119.6, 120, and 120.8. It will be quite difficult to break through this zone on the first attempt, but MM can use it to form traps and collect liquidity.
At the bottom, everything is simpler — a breakdown of the local bullish structure, the formation of an intermediate minimum, below which there is a void down to 112K.
Yesterday, relative to 115-116K, mm staged a massacre (trap) on both sides of the market.
Liquidity collection, return to the range, and growth. The reaction to the false breakdown of support is quite strong. Since the opening of the session, Bitcoin has been heading towards resistance, but there may not be enough potential to break through the upper resistance conglomerate, so I expect to see a pullback or decline to 116-115-114.
Resistance levels: 119.2, 120.1, 120.85
Support levels: 116.37, 115.67, 112
Technically and fundamentally, I do not see any drivers that could support the market (I am talking about Bitcoin, since the driver for altcoins is the decline in Bitcoin's dominance). It is possible that this may appear later. In the current situation, I am considering a false breakout and correction, as the market has not yet finished consolidating or correcting, and the current downward trading range may be extended.
PS: As the price moves towards resistance, it is necessary to monitor the reaction. The market itself will show what it is preparing for...
Best regards, R. Linda!

GOLD → False breakdown 3310. Consolidation ahead of news...FX:XAUUSD is forming a false breakdown of support at 3310, thereby confirming the boundaries of the trading range. The dollar is testing strong resistance within the global downtrend. And in the near future, we can expect more economic news...
Gold is trading below the key resistance level of $3345, remaining in a narrow range ahead of the Fed's decision and US GDP data for Q2. Weak data could reinforce expectations of a rate cut and support gold, while strong data would strengthen the dollar. The Fed is likely to keep rates at 4.25–4.5%, with markets pricing in a 64% chance of a 25 bps cut in September. Investors are waiting for signals from Jerome Powell, with a possible split within the Fed: some members may support calls for easing, which would be a driver for gold.
Technically, the situation on D1 is quite interesting. Gold is still below the previously broken trend resistance, but there is no continuation of the momentum. Buyers are reacting to support at 3310, but the market is stagnating due to uncertainty ahead of the news...
Resistance levels: 3345, 3375
Support levels: 3320, 3310, 3287
Thus, from a technical analysis perspective, I expect a retest of 3345, followed by a pullback to support at 3320, from which gold could move higher (if the bulls take the initiative), but if 3320 breaks and 3310 comes under pressure, gold could test 3287. Again, the emphasis is on trend support (the upward line) in the 3335-33450 zone. If the price can consolidate in this zone, we will have confirmation that the price has returned to the boundaries of the upward trend.
Best regards, R. Linda!

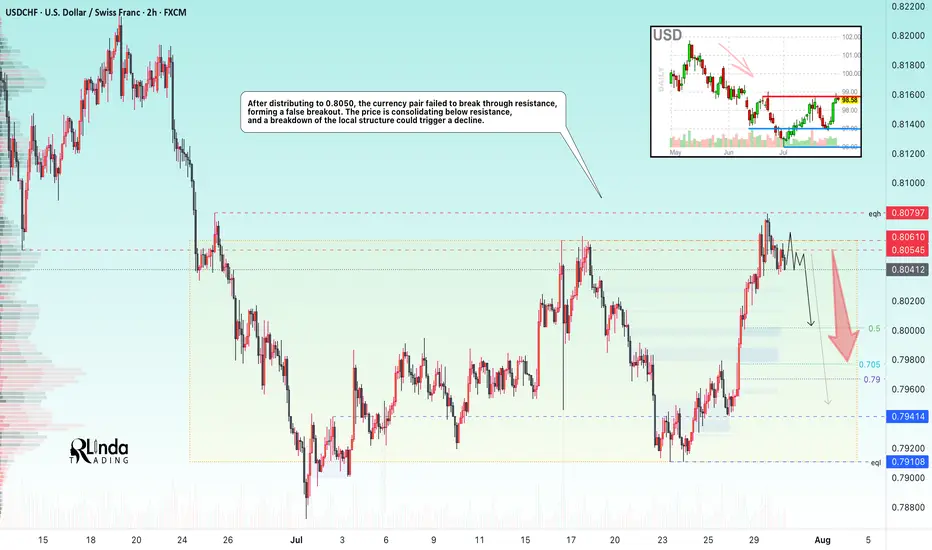
USDCHF → The resistance retest ended with a false breakoutFX:USDCHF tested resistance at 0.805 - 0.806 and formed a false breakout without the possibility of continuing growth. The global trend is downward...
Against the backdrop of the dollar's growth (reaction to news), the currency pair also moved to distribution to 0.8050. The price failed to break through resistance, forming a false breakout. USDCHF is consolidating below resistance, and a breakdown of the local structure could trigger a decline.
The dollar index is also facing fairly strong resistance and may continue its downward trend, which will also affect the decline in the USDCHF price.
Resistance levels: 0.805, 0.806, 0.81
Support levels: 0.800, 0.794, 0.791
If, within the current consolidation, the price begins to fall and break the local structure, then we can expect the decline to continue towards the specified targets!
Best regards, R. Linda!
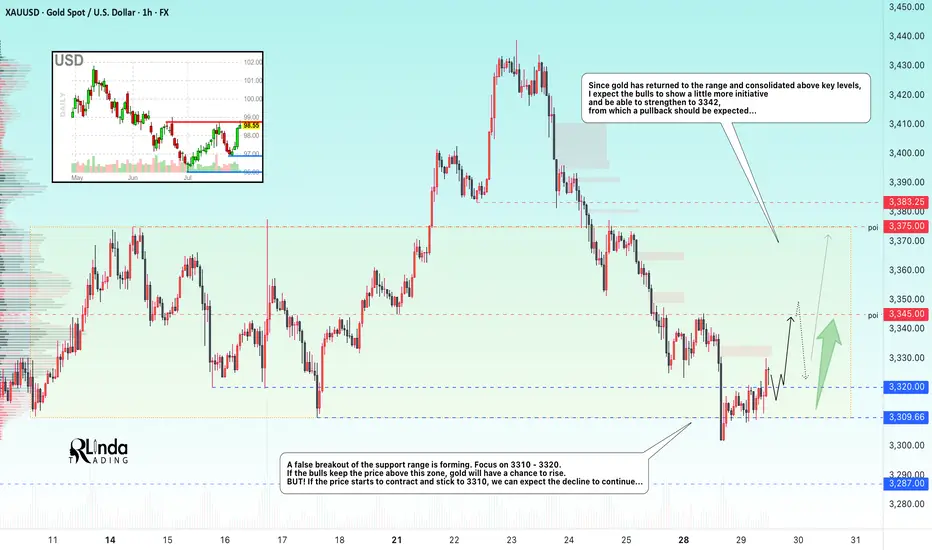
GOLD → Formation of a trading range. 3345?FX:XAUUSD confirms support for the local range. A false breakdown has formed and the price has returned to the buying zone. We are waiting for the bulls to take the initiative...
Gold is trying to recover after falling to $3302, remaining under pressure ahead of key events in the US: the publication of GDP data and the Fed's decision on interest rates. Support is provided by a pause in the dollar's growth, expectations of an extension of the US-China trade truce, and growing demand for safe-haven assets amid a surge in oil prices due to the threat of new sanctions against Russia. However, the sustainability of growth is in question: the dollar may strengthen thanks to optimism about the US economy and progress in negotiations.
A false breakdown of the support range is forming. Focus on 3310-3320. If the bulls keep the price above this zone, gold will have a chance to grow. BUT! If the price starts to contract and stick to 3310, we can expect the decline to continue...
Resistance levels: 3345, 3375
Support levels: 3320, 3310, 3287
The two-day movement has most likely exhausted its potential, or the market has decided to recover slightly due to the unpredictability factor. A false breakdown of support could trigger a pullback to the strong level of 3345, from which a rebound could form (either before growth or before the continuation of the decline; it is necessary to monitor the reaction and the market background...).
Best regards, R. Linda!
XAUUSD Eyeing Liquidity Grab – M30 OB Zone in PlayPrice is respecting the ascending trendline and consolidating near a key resistance level. A bullish breakout is expected, with a potential retest of the trendline and the M30 Order Block (OB) zone acting as a key demand area.
📈 Trade Plan:
Wait for a minor pullback into the OB and trendline confluence
Look for bullish confirmation to go long
Target the liquidity zone above (around 3347)
📌 A clean structure and bullish order flow hint at a continuation to the upside.

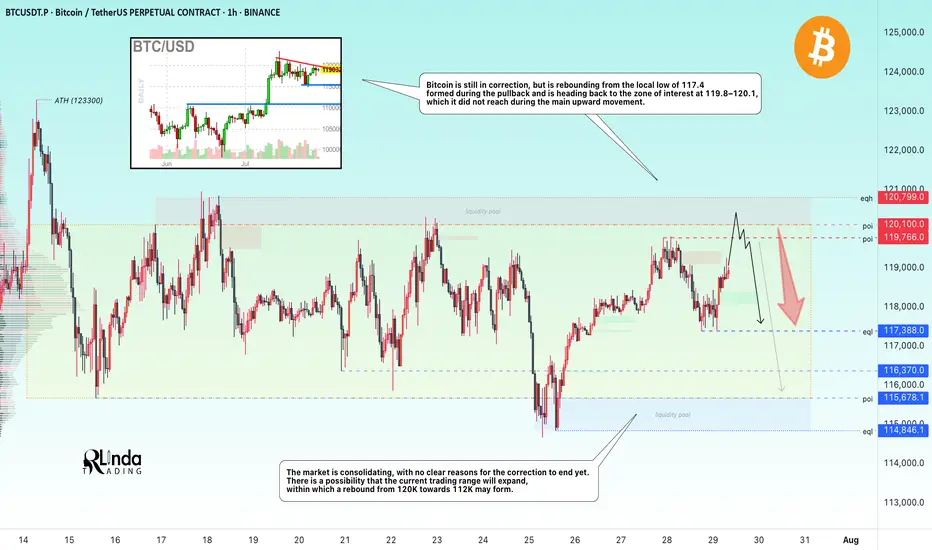
BITCOIN → Hunting for liquidity. Retest resistance before a fallBINANCE:BTCUSDT.P continues to consolidate after a strong rally. There is no strong driver yet, and Bitcoin is reacting weakly to economic data. There is a possibility of a continued correction...
Bitcoin is still in correction, but is rebounding from the local low of 117.4, formed during the pullback, and is heading back up towards the zone of interest at 119.8-120.1, which it did not reach during the main upward movement. I see no fundamental or technical reasons for the correction to end and for growth beyond 121K. I expect a rebound from the resistance zone towards 115-114K. However, in the medium term, I expect the market to attempt to close half or all of the gap between 112K and 114.8K, thereby expanding the key trading range.
Resistance levels: 119.77, 120.1K, 120.8K
Support levels: 117.4, 116.37, 115.68
Technically, a false breakout (liquidity capture) of key resistance and price consolidation in the selling zone could trigger bearish pressure on the market, which in turn would lead to a correction.
Best regards, R. Linda!
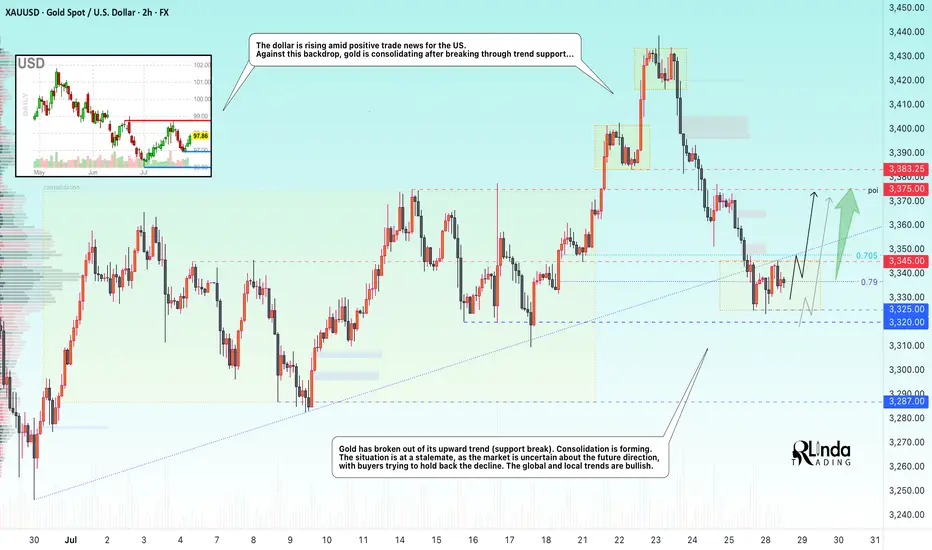
GOLD → Retest of trend support. Consolidation...GOLD is consolidating below the previously broken trend support. On Sunday, Trump announced a trade deal with the EU, which is putting pressure on the market along with the rising dollar...
Gold rebounded from support at $3310 after a week-long low, interrupting a three-day decline amid profit-taking. However, the overall downtrend remains intact as markets brace for a busy week with the release of US GDP data and the Fed's decision. Optimism surrounding US-China trade talks and the US-EU framework agreement is reducing demand for safe-haven assets. Additional pressure on gold is coming from easing geopolitical tensions: Thailand and Cambodia have agreed to ceasefire talks. The metal's recovery may be short-lived.
Technically, we have global and local bullish trends, against which gold is testing support, but as we can see, buyers are trying to hold back the decline due to uncertainty over interest rates. There is a chance that we will see active action by the Fed, behind which lies a rate cut, this week...
Resistance levels: 3345, 3375
Support levels: 3320, 3287
At the moment, I do not see a proper reaction to the support breakout. The price is consolidating after confirming the key trigger at 3345. Thus, if the price starts to return to 3345, test and consolidate above the level, we will have a chance for growth. I do not rule out a liquidity grab from 3325 (false breakout) before the rise.
BUT! The structure will be broken if the price breaks 3325 - 3320 and begins to consolidate below this zone. In this case, gold may fall to 3287
Best regards, R. Linda!
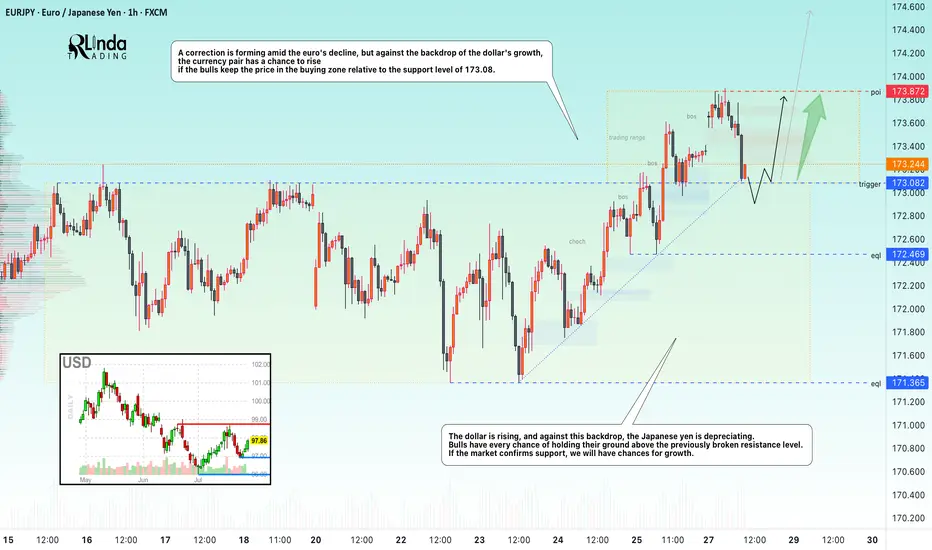
EURJPY → Retest support before growthFX:EURJPY has been correcting since the opening of the European session. The movement was triggered by yesterday's news related to the trade deal between the US and Europe...
EURJPY is reacting to news related to the deal between the US and Europe. A correction is forming amid the fall of the euro, but against the backdrop of the dollar's growth, the currency pair has a chance to rise if the bulls keep the price in the buying zone relative to the support level of 173.08.
The dollar is rising, and against this backdrop, the Japanese yen is falling. Bulls have every chance of holding their ground above the previously broken resistance. If the market confirms support, we will have chances for growth.
Resistance levels: 173.87
Support levels: 173.082, 172.47
The currency pair may form a liquidity trap relative to the previously broken consolidation resistance. A false breakdown of support and price consolidation in the buying zone (above 173.1) could trigger further growth.
Best regards, R. Linda!
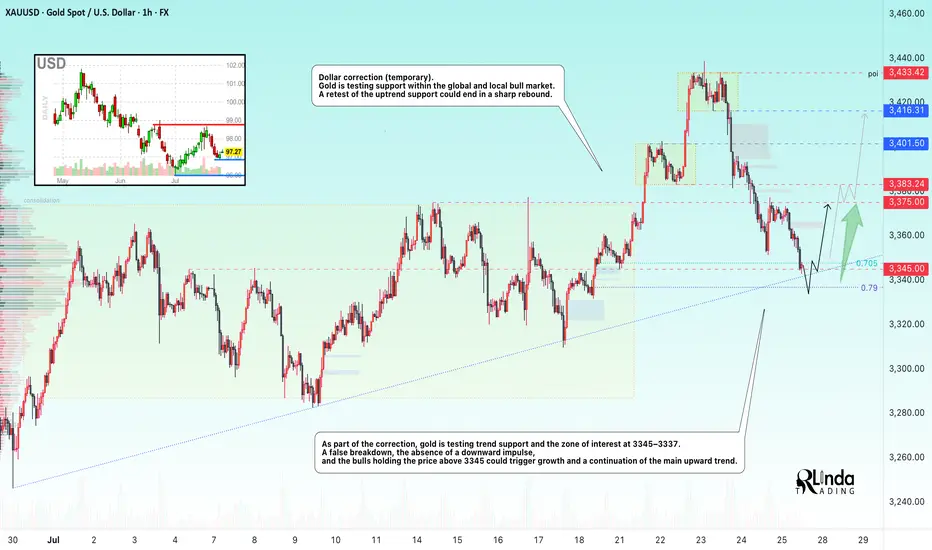
GOLD → Countertrend correction, retest of 3345 before growthFX:XAUUSD , undergoing a deep correction after a false breakout of local resistance at 3433, has reached the support of the upward trend. Will the bulls be able to maintain the trend?
Gold held below $3,400 on Friday, rebounding from $3,350, and is poised to end the week higher. Investors are watching the conflict between Thailand and Cambodia, which is boosting demand for safe-haven assets, and are also awaiting decisions from the Fed and the Bank of Japan next week. The markets received additional support from US trade deals with Asian countries and progress in negotiations with the EU, easing fears of a tariff war.
As part of the correction, gold is testing trend support and the 3345-3337 zone of interest. A false breakdown, lack of downward momentum, and bulls holding prices above 3345 could trigger growth and a continuation of the main upward trend.
Resistance levels: 3375, 3383
Support levels: 3345, 3337, 3330
Technically, the support level of 3345 plays a fairly important role in the market. If, during the correction, the bulls manage to hold their ground above this zone, the prospects for recovery will be high, especially against the backdrop of geopolitical problems.
Best regards, R. Linda!
GBPUSD → Retest of previously broken resistance...FX:GBPUSD has entered a correction phase after breaking through the local downtrend. If the price remains in the 1.3450–1.346 zone, this will confirm the formation of a new trading range...
The market is entering a correction phase due to the dollar. A countertrend retest of the support zone is forming. Earlier, the currency pair broke the local trend and is entering a flat phase. The retest of support may end with a recovery. If, within the local movement and after a false breakout of the 1.345 - 1.3467 zone, the bulls keep the price above the buying zone, then in the short and medium term, we can expect growth to continue.
Support levels: 1.3467, 1.345
Resistance levels: 1.35, 1.3584
A false breakdown of support at 1.3467 will confirm a change in the local trend (correction). The market may return to the recovery phase of the global trend.
Best regards, R. Linda!

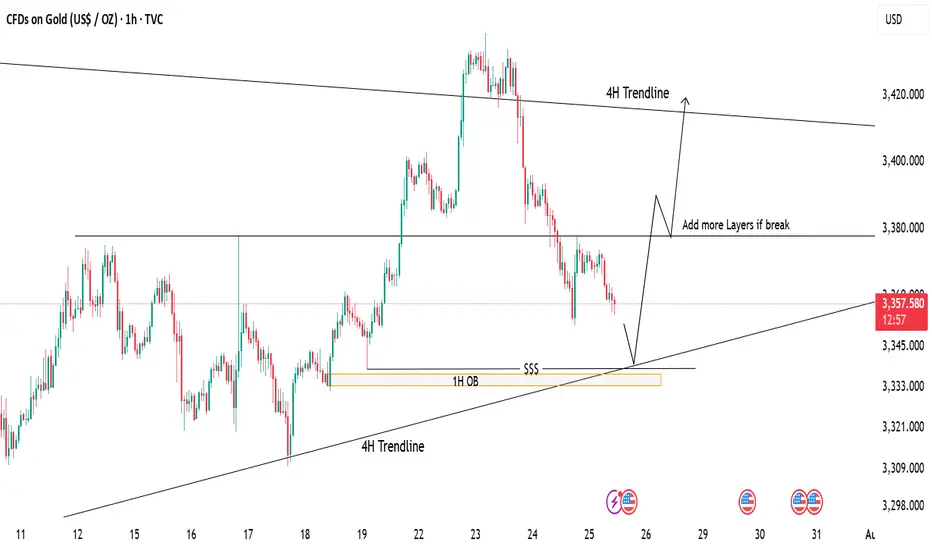
Gold Tapping Into Major Support – Eyes on Bullish ReversalPrice is currently retracing after a strong drop from recent highs. We're now approaching a key demand zone, aligning with:
📍 1H Order Block (OB)
📍 4H Trendline Support
📍 Liquidity Zone ($$$)
📉 If price taps into this area, it may offer a high-probability long setup.
📈 First target: 3380 (mid-range resistance)
🧱 If this breaks, we can look to scale in/add more positions, targeting the 4H trendline zone near 3420.
⚠️ Waiting for price reaction at support – patience is key!
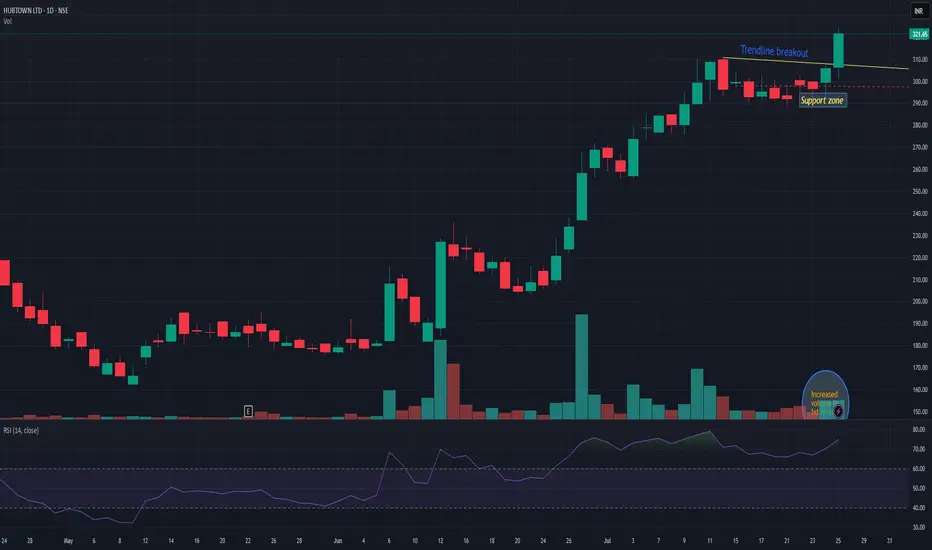
HUBTOWNHUBTOWN giving trendline breakout with decent volumes. Support can be seen near 301-2 level. On upper side resistance may be nr 342-365. Stock has given around 80% return in last 1.5 months. So strong momentum is observed. Keep it on radar
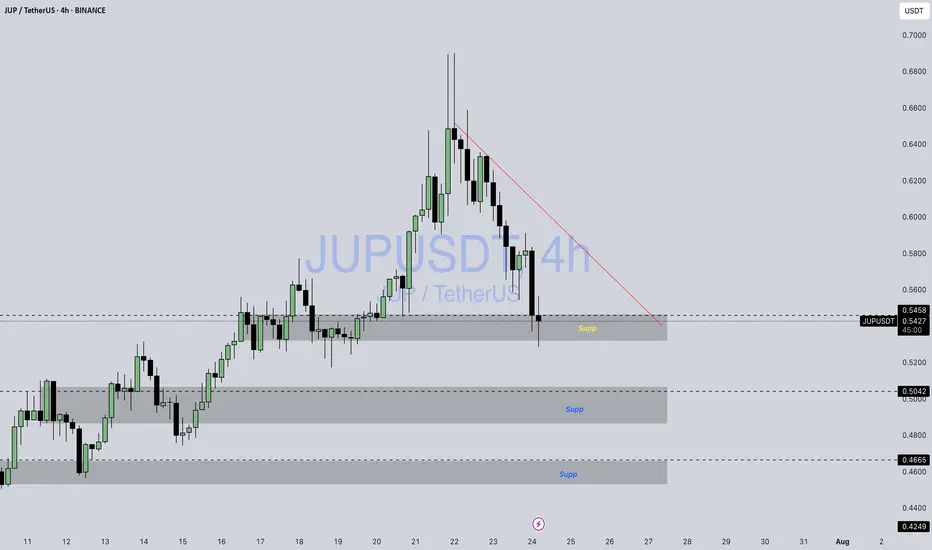
JUP / USDTBINANCE:JUPUSDT
### **📊 Chart Overview – JUPUSDT (4H):**
* **Current Price:** \$0.5415
* **Recent Action:** Price dropped sharply from \$0.668 and is now testing a **key support zone around \$0.54 – \$0.55**.
* **Key Supports:**
* **\$0.545 – \$0.54 (current zone).**
* **\$0.504 – \$0.50 (next support).**
* **\$0.466 (major support).**
* **Resistance Levels:** \$0.60 and \$0.668.
---
### **🔍 Technical Breakdown:**
1. **Trendline Resistance:**
* A descending red trendline is currently capping upside movement.
* Price needs to **break and close above \$0.57 – \$0.60** for bullish momentum.
2. **Bullish Scenario:**
* If \$0.54 holds as strong support, we could see a **bounce towards \$0.60 – \$0.65**.
3. **Bearish Scenario:**
* A breakdown below **\$0.54** might push the price down to **\$0.50** or even **\$0.466**.
---
### **📌 Summary:**
JUP is at a **critical support**. The next 1–2 candles on the 4H chart will decide if it bounces or dips toward the \$0.50 level.
---
⚠️ **Disclaimer:**
*This analysis is for informational and educational purposes only. It is not financial advice. Always do your own research (DYOR) and manage risk appropriately.*
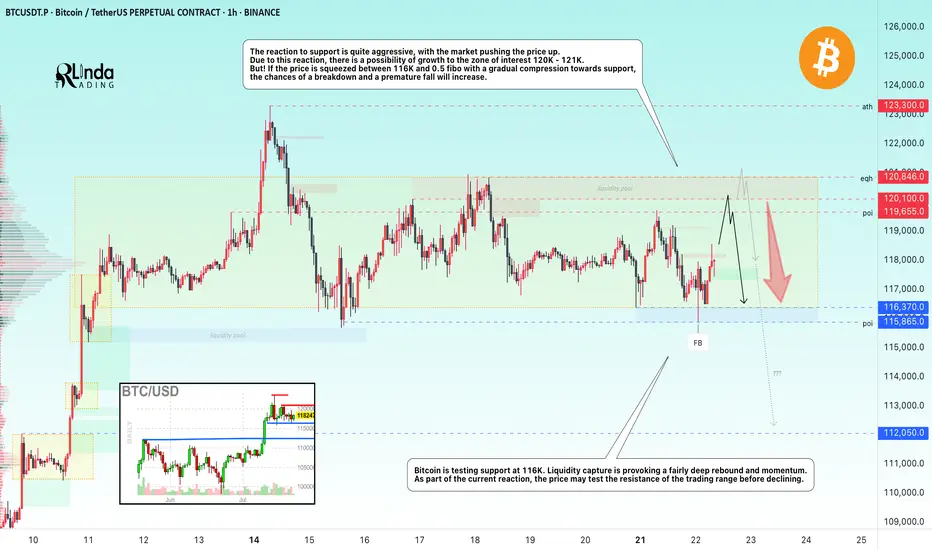
BITCOIN → Consolidation and compression to 116K. Correction?BINANCE:BTCUSDT.P continues to consolidate, with the price testing support at 116K, leaving behind the zone of interest at 120K-121K. Are there any chances for further growth?
(Alternative scenario (if growth to 120K does not occur))
Fundamentally, there is nothing particularly new, and the hype surrounding Bitcoin is stagnating. Technically, on D1, consolidation is underway with pressure from bears against the backdrop of an outflow of funds into altcoins. However, the dominance index is starting to rise, which could trigger some correction in the market. The price on the working timeframe, without updating local highs, is testing lows, and the latest retest of the liquidity zone is provoking a fairly aggressive reaction that could bring the price to retest the zone of interest at 120K-121K.
But! If the price is squeezed between 116K and 0.5 Fib with a gradual squeeze towards support, the chances of a breakdown and a premature fall will increase.
Support levels: 116370, 115860
Resistance levels: 119650, 120100
Technically, the market needs a breather or correction, which is generally a sign of health. The nuance with Bitcoin is that below 115860 there is no support until 112K, and if the market breaks the current consolidation boundary, the further correction could be quite deep. In the current situation, I do not yet see any drivers or reasons for another rally.
Best regards, R. Linda!
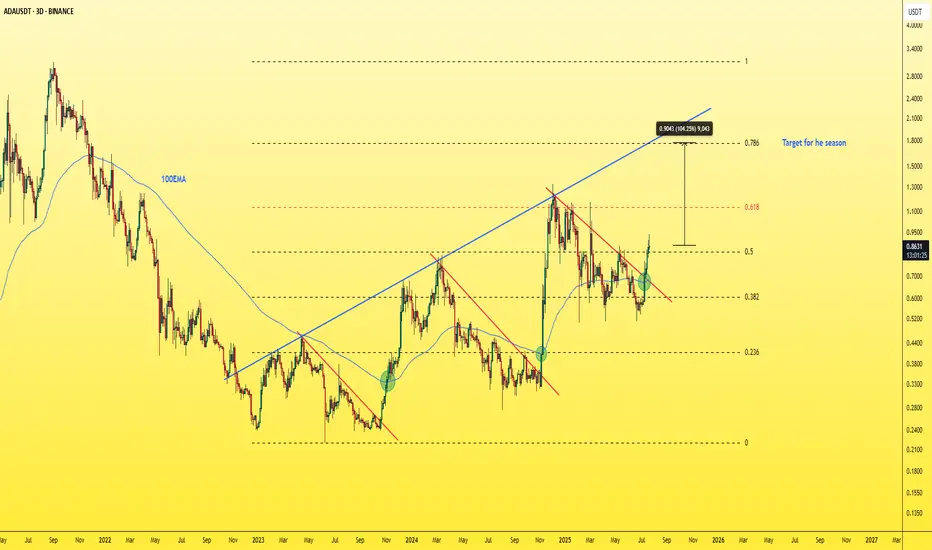
ADAUSDT - Buy or Regret!As clear and simple as the chart is… the target is just as clear and reliable.
ADA is showing strong bullish structure on the 3-day chart — breaking above the red trendline with a successful retest, and also breaking above the 100 EMA.
The blue trendline represents a strong hidden resistance level that many traders are overlooking.
The upside move is likely to end around the 0.786 Fibonacci level, which intersects with this blue trendline — in the $1.50–$1.70 range.
A strong project. A fundamentally sound coin that respects technical analysis.
A logical and high-probability target.
Best regards Ceciliones🎯
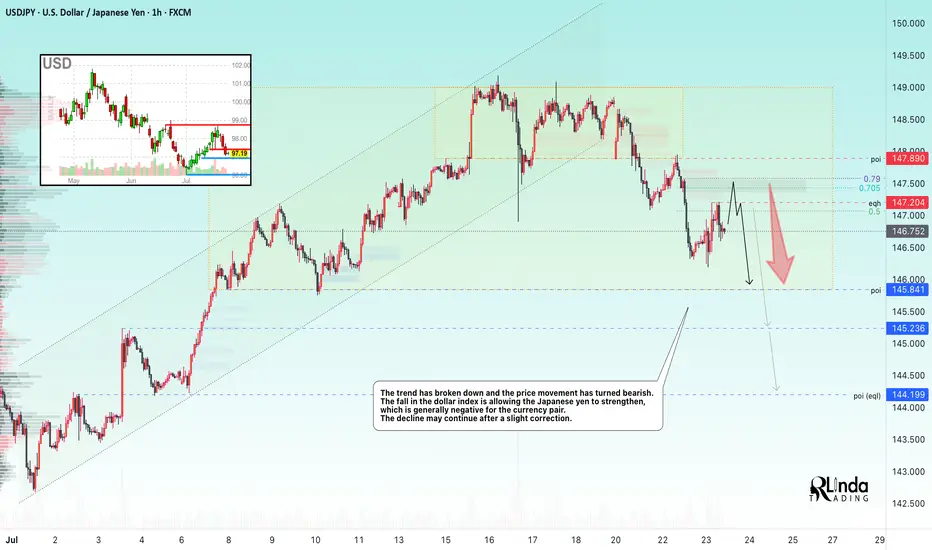
USDJPY → Hunting for liquidity before the fallFX:USDJPY is changing its local trend and succumbing to global pressure. The market is seeing a change in price movement following the decline in the dollar index...
The trend has broken and the price movement has turned bearish. The fall in the dollar index is allowing the Japanese yen to strengthen, which is generally negative for the currency pair. The decline may continue after a slight correction.
Fundamentally, the dollar is correcting amid uncertainty due to the tariff war, as well as expectations of interest rate cuts.
Resistance levels: 147.20, 147.89
Support levels: 145.85, 145.23
As part of the correction, the price may test the liquidity zone of 147.7 or 0.7f. A false breakout and consolidation of the price in the selling zone may trigger a further decline in both the short and medium term.
Best regards, R. Linda!