China stocks ready to go? #DeepSeek another reason..This is a chart of the benchmark index for Hong Kong - HK50
It's up on Monday, while Nvidia is down 10+%
If funds are flowing out of Nvidia - China (home of DeepSeek) could be one place they end up.
The Hang Seng is a perfect example of how long a trend can take to reverse.
How many times would traders have tried to go long this index only to see it slump right back towards the bottom?
Now while this trend reversal might be delayed further - and might fail altogether - we think there is enough evidence to suggest a reversal is happening.
The price is above a rising weekly 30 week SMA
A long term trendline has broken
Crucially - the price made a double bottom pattern around 15,000
DAILY CHART
On the daily chart we see the strong surge in buying interest from September has given way to a long multi-month correction.
We are looking for a breakout above the down trendline to demonstrate the correction has finished and a new up-leg is beginning.
The final confirmation would come from a break of resistance (not drawn) from the November and December highs at 21,350.
Should the price turn lower and make a new fractal low under 19,650 then we’ll have to wait a bit longer for the Hang Seng trend reversal.
But - as always - that’s just how the team and I are seeing things, what do you think?
Share your ideas with us - OR - send us a request!
Trend Line Break

XAUUSD - Roadmap for 3003! Read ChartHello Traders!
As we know gold is trading in two parallel Channel internal and external channel and in bullish trend we are watching gold's impulsive wave breaking every time to upper trendline of external channel and retesting only internal channel's down trendline.
we seen a corrective move from 2943.329 to 2864.450 and suddenly gold again hit its ATH and this impulsive move will end at 3003 then we can expect trend reversal with any confirmation.
Support Levels: 2916,2919,2922
Resistance : 2943.300
For Now i am bullish till 3003 with stop loss at lower support

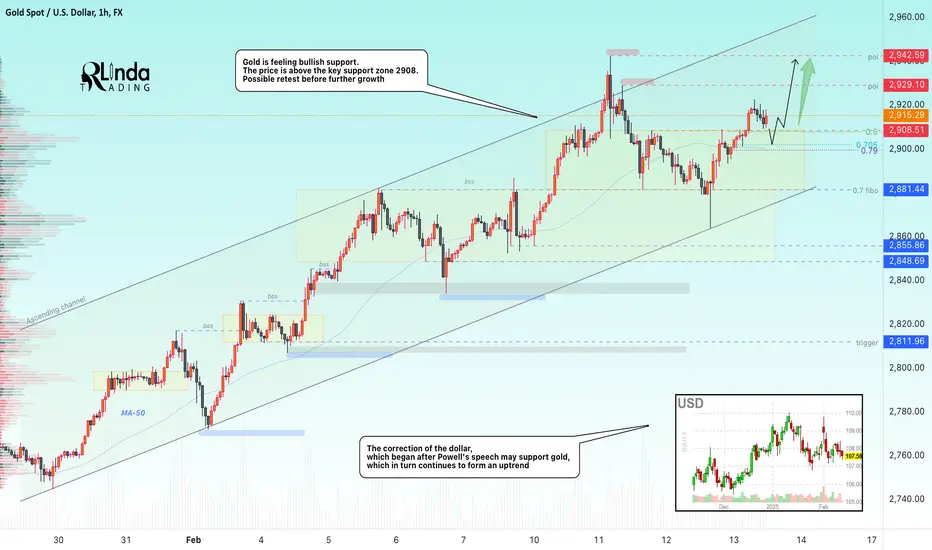
GOLD → ATH retest - 2942. A step away from a breakoutFX:XAUUSD is testing ATH, which generally increases the chances of growth continuation. The 3000 target is getting closer and closer. Retail sales data is ahead
Metal is consolidating after the rally, remaining in an uptrend. Supported by Trump's tariff plans and expectations of Fed easing. PPI data reinforced dovish sentiment, weakening the dollar and bond yields.
Markets reacted to the delay in tariffs and comments from Trump and Powell on the need to cut interest rates (without specific dates), which supported gold. Ahead is possible profit taking and the impact of US retail sales data
Resistance levels: 2942.6, 2950
Support levels: 2929, 2922, 2908
Emphasis on key supports. There is a possibility of support retest before further growth. If this does not happen and the price heads towards ATH, the scenario for a pullback to the support at 2929-2922 before further growth will remain
Regards R. Linda!

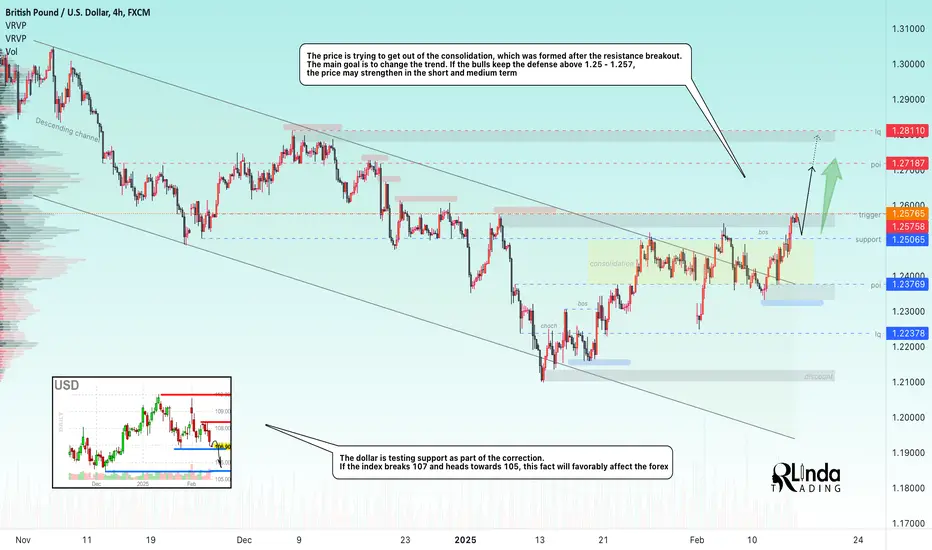
GBPUSD → Attempting a trend change. 1.257 - triggerFX:GBPUSD is trying to take a chance for a trend change amid the dollar correction. The price is testing consolidation resistance for a breakout
On the daily timeframe, the price is consolidating above the previously broken trendline and the attempt to break the resistance is generally indicative of the market sentiment. A dollar correction could favor the pound if the index breaks 107 and heads towards 106-105.
Technically, the focus is on 1.257, a key resistance trigger. A break and price consolidation above this zone could trigger a rally.
Resistance levels: 1.2575, 1. 2718
Support levels: 1.250, 1.2377
I do not exclude the possibility of a retest of 1.250 support in order to accumulate liquidity before further growth. The dollar is likely to continue its correction after Trump's and Powell's comments on rate cuts
Regards R. Linda!
GOLD → The northbound train is ready to move onFX:XAUUSD is back in trend after a news (inflation) shakeout. The northbound train can continue its journey from station 2908. Initial Jobless Claims and PPI ahead
Prices are supported by uncertainty around Trump's tariffs and US economic data. The Fed remains hawkish due to rising inflation, which raised bond yields and briefly drove the gold price down to $2,865. However, buyers quickly returned, driving the price back up again. The market is waiting for PPI data that could influence Fed policy, but the decline in gold prices is likely to be limited due to trade risks
The price is consolidating in the buying zone relative to the important 2900 - 2908 point. If bulls hold their defenses above 2908, gold could update ATH in the medium term
Resistance levels: 2920, 2929, 2942
Support levels: 2908, 2902
Emphasis on key levels. Gold may test 2908 support before rising further. Also the emphasis is on 2918 - 2920. A price consolidation above this zone will also support the price
Regards R. Linda!
$DXY Weekly Analysis: Bearish Divergence and Trendline Breakdown
DXY Shows Bearish Divergence and Breakdown – Bullish Implications for Bitcoin, Gold, and Forex
The U.S. Dollar Index ( TVC:DXY ) has formed a clear bearish divergence on the weekly timeframe, indicating potential downside momentum. Additionally, it has lost key trendline support, further confirming weakness in the dollar.
Key Support Levels for #DXY
Next Major Support: 102 - 100 zone
If the 110 support level is breached, DXY could experience a sharp plunge, accelerating further downside.
Bullish Impact on Bitcoin, Altcoins, Gold, and Forex
Since the DXY moves inversely to risk assets and other currencies, its bearish outlook could support:
✅ #Bitcoin & #Altcoins: Potential for upward momentum
✅ #Gold: Increased demand as a hedge against a weaker dollar
✅ #Forex Markets: Currencies like EUR, GBP, and others could gain strength against the USD
The current bearish divergence and breakdown of trendline support in DXY suggest continued dollar weakness. If key support levels fail, we could see strong rallies in Bitcoin, altcoins, gold, and major forex pairs in the coming weeks.

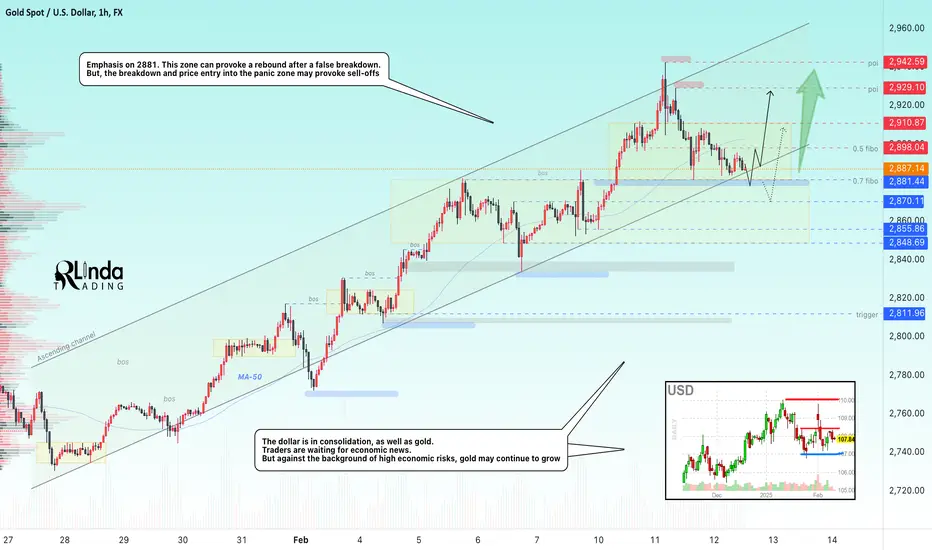
GOLD → News ahead. Price is testing the risk zone 2881FX:XAUUSD within the correction is testing the key risk zone from which either a continuation of the trend or a deeper correction will take place.
In the center of attention is the US CPI data, which may give a new impetus to prices.
Markets remain in uncertainty over Trump's possible tariffs and Fed policy. According to WSJ, the president's administration is preparing new tariffs and this is another dose of risks for the global economy.
Powell said that the Fed is in no hurry to change course, which raised expectations of a single rate cut in July and strengthened bond yields. Gold's further movement depends on inflation data and Trump's tariffs. If CPI exceeds forecasts, the dollar will strengthen and gold will fall in price. Weak data, on the contrary, may support the metal's growth.
Resistance levels: 2898, 2910, 2929
Support levels: 2881, 2870, 2855
A false break of the support at 2881 would mean that the market is still bullish and quite aggressive. If the bulls keep the price above 2881 - 2885, then in the short and medium term we should expect a rise to 2930 - 2950.
If gold breaks 2881 and sticks below this zone, then liquidation may take place in the market and the price may decline to 2855, 2848.
The situation is stalemate, as there is news ahead and that is why we should consider 2 scenarios.
Regards R. Linda!
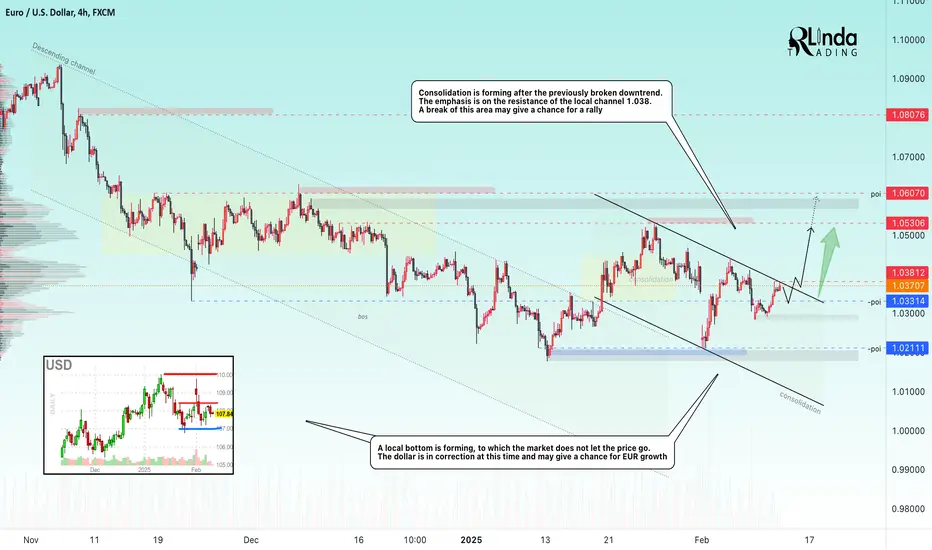
EURUSD → Pending a breakout of resistanceFX:EURUSD is trying to take a chance amid the dollar correction. The price is forming a retest of consolidation resistance for a breakout and further growth
After an attempt to break the downtrend resistance, the price moves into consolidation and forms a range of 1.053 - 1.021. Inside this set-up a local channel (consolidation) is formed and the price tests the resistance at 1.038. The market is still trying to confirm the change of trend and get stronger on the background of the dollar correction.
The fundamental background is complicated due to the tariff war and economic crisis....
Resistance levels: 1.038, 1.053
Support levels: 1.033, 1.021
A breakthrough of the resistance at 1.038 and price consolidation above this area may trigger further growth within the distribution of the accumulated potential
Regards R. Linda!
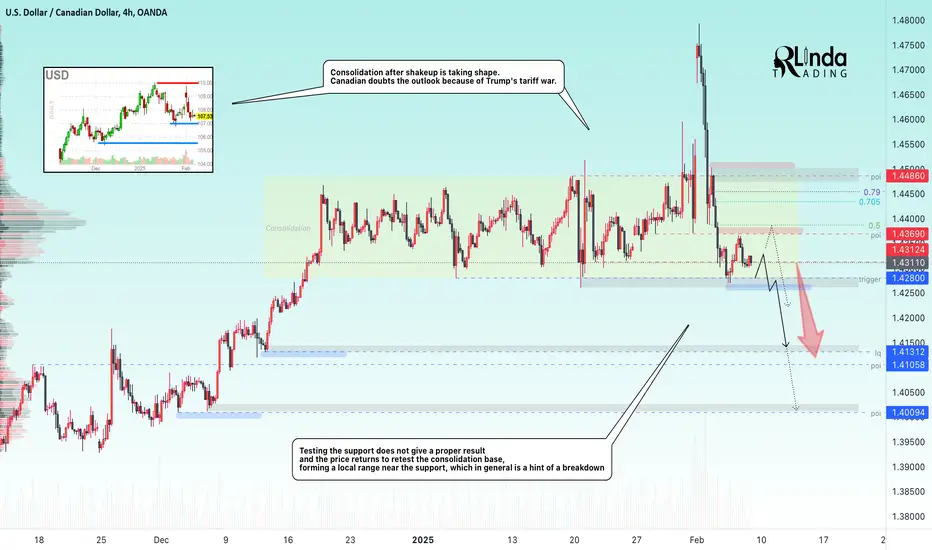
USDCAD → Consolidation before downward distributionFX:USDCAD is stuck in a range (consolidation) between 1.4486 and 1.428. The dollar has been showing negative momentum lately, but with NFP ahead, the data could both reinforce the correction and support the index...
All eyes are on today's economic news. If the actual NFP is below the forecast (169K), it will strengthen the expectations of the Fed rate cut.
At 15:00 the Fed's monetary policy report will be released, which may clarify the further course of the regulator.
If the NFP comes out weak, the dollar may sag and USDCAD may decline.
If the data is stronger than expected, the USD will strengthen, which will lift the USDCAD.
If the Fed hints at a rate cut, it may weaken the USD, supporting the CAD
Resistance levels: 1.4345, 1.4369
Support levels: 1.428
News is uncertainty, as it is impossible to determine the outcome of this situation in advance.
Technically, the currency pair looks weak due to the falling dollar. A break of the support at 1.428 may trigger further decline.
Regards R. Linda!
Nasdaq - Starting The Final Parabolic Year!Nasdaq ( TVC:NDQ ) is perfectly following the breakout:
Click chart above to see the detailed analysis👆🏻
Back in 2020 we already witnessed the channel break and retest, which was followed by a parabolic rally of another +50%. And in mid 2024, the Nasdaq again broke the channel trendline towards the upside, preparing the repetition of the parabolic rally which we saw four years ago.
Levels to watch: $30.000
Keep your long term vision,
Philip (BasicTrading)

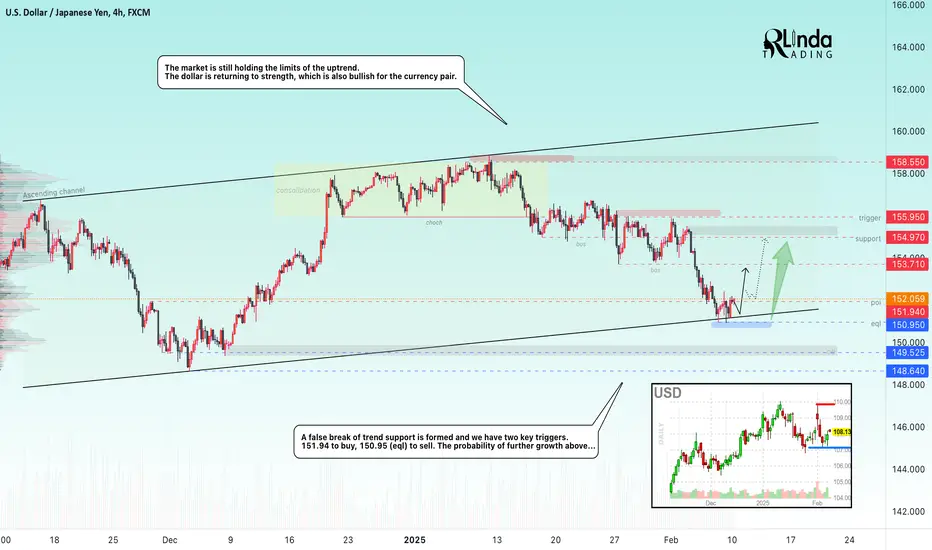
USDJPY → False break of support gives bulls a chanceFX:USDJPY bumps into support and forms a false breakdown of the lower boundary of the local trend. The dollar is strengthening at this time, which may give a chance for growth of the currency pair.
The price stops in the zone of strong support, the fundamental background has been unstable lately and depends more on the USA. Everyone has long forgotten about the growth of interest rates in Japan and follows the economic data from the West.
Technically, there are two triggers on the chart, one to buy and one to sell, but since the global and local trend is upward, the preference is to buy. If the currency pair is able to consolidate above 151.9 - 151.95, then in the short and medium term we should expect growth to the targets indicated on the chart.
Resistance levels: 151.94, 153.7, 153.97
Support levels: 150.95, 149.52
But, if the dollar continues the correction and the bulls fail to realize the false support breakdown, the price return to 150.95 may provoke the support breakout and fall to 148.64.
Regards R. Linda!
Nvidia - This Will Change Everything!Nvidia ( NASDAQ:NVDA ) is creating a massive breakdown:
Click chart above to see the detailed analysis👆🏻
For the past decade, Nvidia has been trading in a rising channel formation, perfectly following major rally and retracement cycles. But now we are starting to see some weakness on Nvidia and a break below the smaller timeframe support trendline will lead to a massive move lower.
Levels to watch: $110, $60
Keep your long term vision,
Philip (BasicTrading)

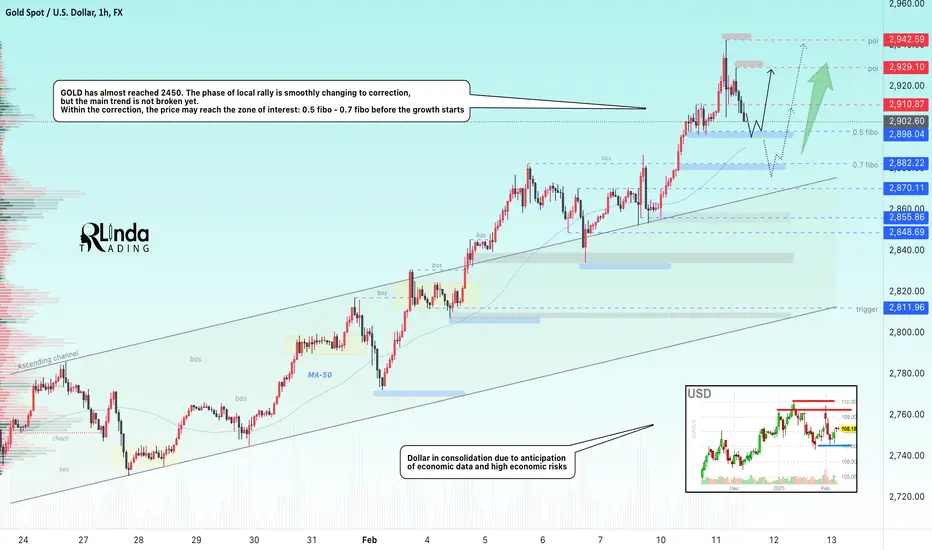
GOLD → Is $3000 still relevant? News aheadFX:XAUUSD has almost touched 2450 and without reaching the psychological target is smoothly flowing into correction with the purpose of respite and filling liquidity before the news and possible growth.
Gold is testing 2450 after Trump's new tariffs, keeping demand high. Investors are waiting for Powell's speech and U.S. inflation data, which may influence rate cut expectations and further dynamics of gold. Gold remains volatile on one side and bullish on the other side due to trade risks and Fed policy.
Technically, a correction is a logical scenario on the back of a strong market. The price cannot rise all the time, it needs energy, which is accumulated at the expense of sellers.
At the moment the emphasis is on such zones as: 2910, 0.5 fibo and 0.7 fibo.
Resistance levels: 2910, 2929
Support levels: 2898, 2882, 2870
Powell speaks tonight and tomorrow is the inflation data. High volatility is possible, but the general economic situation supports the metal.
Before further growth the price may test 2898, 2882. The target in the form of 2950 - 3000 remains relevant.
Regards R. Linda!
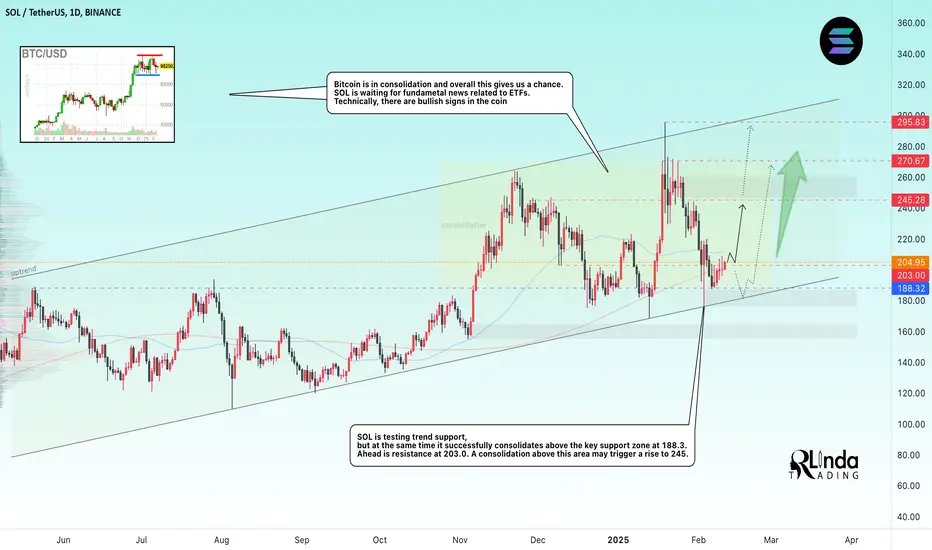
SOL → The coin may get a chance for growthBINANCE:SOLUSDT is testing trend support and at the same time bulls are trying to hold their defenses above the intermediate bottom and enter the buy zone.
SOL both fundamentally and technically has good potential. Bitcoin is consolidating at this time and it can give strong coins a chance.
Technically, solana tested the trend support with a touch and is trying to consolidate. I don't exclude the possibility of a false breakdown of the trend support before further growth, but at the moment the focus is on the resistance 200 - 203. If the bulls hold the defense above this area, the coin could strengthen to 245 - 270 - 290 in the medium term.
Resistance levels: 203, 200
Support levels: 188, trend
Emphasis on the local boundaries of the range. The market is struggling for the zone 200-205, bitcoin at this time is forming a local bullish momentum, which can also become a driver for the cryptocurrency market.
Regards R. Linda!
Gold1) A symmetrical triangle breakout
2) previous trend break
Order type : Buy Stop
EP : 2728.30
SL : 2583.68
TP : 2872

GOLD 4H TECHNICAL ANALYSIS GOLD ATH / READ CAPTION CAREFULLY Dear Traders,
Please find our updated analysis of the 4H Chart (5th February):
Key Observations:
Orange Circles: Highlight previously achieved targets, showcasing the precision and effectiveness of our analysis.
Previous Chart Review:
TP1 (2788): Successfully hit.
TP2 (2815): Successfully hit.
TP3 (2841): Successfully hit.
Market Overview:
* TP1 (2850) Successfully Achieved
* GOLD is trading at an ATH of 2851, oscillating between the weighted level with a gap above 2850 and a gap below the 2823 Entry Level.
* EMA5 and FVG are offering strong support in this range.
* Price action will test these levels side-by-side until a decisive break and lock above/below the weighted levels confirm the next directional move.
Resistance Levels:
2850, 2876, 2903
Key Support: 2776
Support Levels (GOLDTURN Levels):
2828 (Critical Weighted Level)
2803 (Critical Weighted Level)
2776 (Major Support Level)
2747 (Lower Major Demand Zone)
EMA5 (Red Line):
* Currently below TP1 (2850), indicating sustained bullish momentum.
* EMA5’s behavior will be pivotal in determining the next price action trajectory.
Recommendations
* Focus on EMA5 Behavior:
Bearish Case:
* If EMA5 holds below TP1 (2850) and resistance levels remain intact, bearish momentum may drive prices to retest GOLDTURN weighted levels.
* Scenario 1: If EMA5 crosses and locks below Entry 2823, expect further bearish movement toward GOLDTURN 2803.
* Scenario 2: If EMA5 crosses and locks below GOLDTURN 2803, anticipate another decline toward the major support at GOLDTURN 2776.
Bullish Case:
Scenario 1: If EMA5 crosses and locks above TP1 (2850), the next bullish target is 2876.
Scenario 2: If EMA5 crosses and locks above TP2 (2876), the subsequent bullish target will be 2903.
Scenario 3: A crossover and lock above TP3 (2903) will set the stage for the next target at 2925.
Short-Term:
Utilize 1H and 4H timeframes to capture pullbacks at GOLDTURN levels.
Target 30–40 pips per trade, focusing on shorter positions in this range-bound market.
Each Level allows 30 -40 pips bounce, buy at dip level for proper risk management
Long-Term Outlook:
* Maintain a bullish bias, viewing pullbacks as buying opportunities.
* Buying dips from key levels ensures better risk management, avoiding the pitfalls of chasing tops.
Final Thoughts:
Trade with confidence and discipline. Our detailed and accurate analysis equips you to navigate market movements effectively. Stay tuned for daily updates and multi-timeframe insights to stay ahead in the game.
Please support us by likes, comments, boosts and following our channel
Best regards,
📉💰 The Quantum Trading Mastery

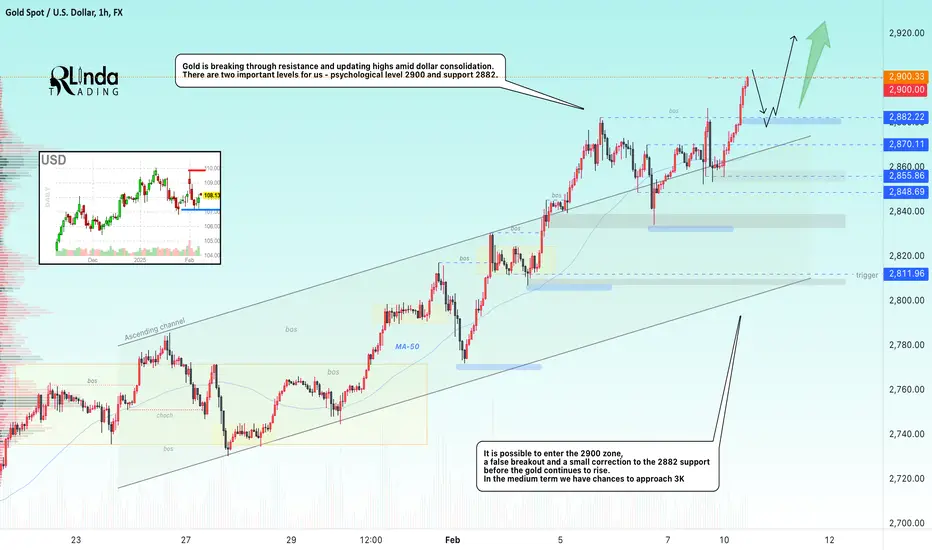
GOLD → The northbound train continues to make its way to 3KFX:XAUUSD continues its aggressive rally. The reasons for growth are the same as before - high economic risks. The price is getting closer and closer to the cherished goal of $3000.
Gold exceeded $2,850 at the beginning of the week in the U.S., but its growth is limited by the strengthening of the dollar due to increased trade risks.Trump announced new 25% tariffs on imports of steel and aluminum.
Gold is further supported by rising PBOC reserves and expectations of stimulus from China. However, the dollar may continue to strengthen ahead of US inflation data, limiting gold gains. Expectations of a dovish Fed and trade risks will help contain gold's decline.
Technically, the next two levels are important for us: the psychological level of 2900 and the key support of 2882.
Resistance levels: 2900 (not confirmed)
Support levels: 2882, 2870, 2855
The bulls can consolidate above 2900 without a pullback and continue the rally, but the most likely scenario is a false break of 2900, correction to 2882 to accumulate liquidity before continuing the rally northward
Regards R. Linda!
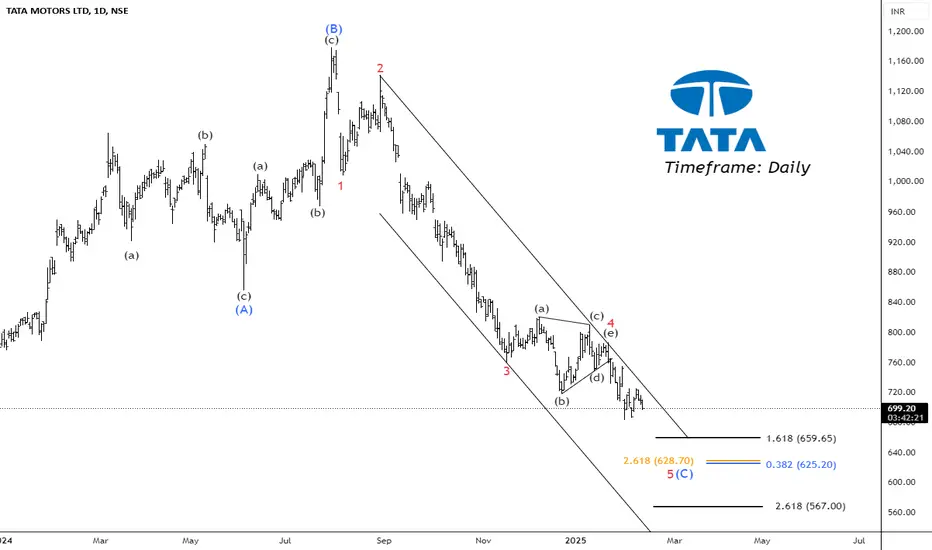
Is Tata Motors Ready for a Bullish Reversal?Timeframe: Daily
Tata Motors (NSE) has been in an expanded flat correction pattern for the past 11 months. In this pattern, the highest high (HH) was 1179, and the lowest low (LL) was 683.2. Currently, the price is trading below the 200, 100, and 50 EMA levels, indicating a bearish trend.
In this expanded flat correction:
Wave (A) completed at 855.4,
Wave (B) peaked at 1179,
Sub-wave 4 of Wave (C) touched 786.65,
Sub-wave 5 is now unfolding.
Once Wave 5 is completed, traders can look for buying opportunities with target levels at 799 – 951 – 1050+. First, it’s crucial to identify the end of Wave (C) to confirm the correction’s completion and a bullish reversal.
Projecting ending point of wave (C):
Wave (C) may end at 2.618% of Wave (A) around 628.7.
Wave 5 has multiple potential targets/support levels:
0.618 extension of Wave 1 at 526,
0.382 extension of Wave 1 at 628,
1.618 reverse Fibonacci of Wave 4 at 657,
2.618 reverse Fibonacci of Wave 4 at 562.
We will update further information soon.
EURGBP: What Are You Anticipating With This Volatile Pair?I am a swing trader, as you can probably tell from the timeframes I use in my posts. However, I do believe that EURGBP lends itself better to day trades or position trades, if you can stomach the movement. Considering it has made, for me, surprising reverses just when you think it would push further, I offer a couple of scenarios for both a sell and buy possibility. I do see EURGBP selling further but this is a pair you want to be prepared for movement in the opposite direction as well. Game plan, ready! What would be your move?

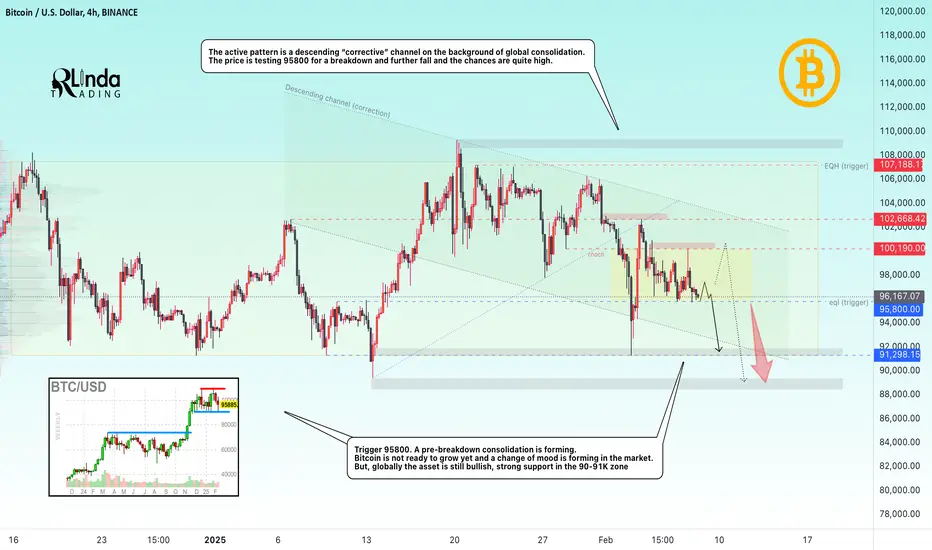
BITCOIN → Down to $90,000. Downside risks are risingBINANCE:BTCUSD feels the change of mood and continues to form set-ups hinting at a possible continuation of the correction. Another retest of the 90K risk zone is possible.
On the medium-term timeframe bitcoin failed to hold near ATH, in the upper consolidation range and entered the local selling zone, under the level of 99800. A negative note is felt in the cryptocurrency market, as well as a change in sentiment. Altcoins continue to break through bottom after bottom without any positive prospects. Bitcoin at this time is most likely resentful of the US governing apparatus due to the fact that no promises from Trump have been kept so far, and the price is moving into a protracted correction in the local perspective
Briefly, here's what's going on:
Expectations: Bitcoin reserve, cryptocurrency market support, transparent regulation, pumping the market ...
Reality: new scam coins created before the US election that sucked all liquidity, market manipulation, trade war with almost every country on the planet, dumping the market into the abyss.
Support levels: 95.8 (trigger), 91300, 90K
Resistance levels: 100.2, 102.67
Technically, the situation is that bitcoin may continue its decline and test 90K again, from which the risks around 90K will grow.
At the moment, the price is in consolidation between 95.8 - 100.2. A pre-breakdown consolidation is forming near the support, foreshadowing the support breakdown and further fall to 90K. But, due to the dependence of the asset before the actions of politicians in the U.S., the price may shake out to 100.2 before further falling
Regards R. Linda!
Will GBP/JPY Attempt to Push Higher?Due to it's failed attempts to break each Lower High and the Highest High, I believe it's time for GBP/JPY to sell further. Looking at it on the daily timeframe, I've identified areas of strong support that needs to be broken, preferably with a momentum candlestick and a close below from H4 to Daily. Target prices identified, coincide with the various structural supports as well as Fib Trend Extension levels with the final target being a possibility for price to "spike" into, reversing for a possible retracement.
View video for a full explanation and identified TPs.
Please "like" and feel free to comment with your own ideas or agreement!

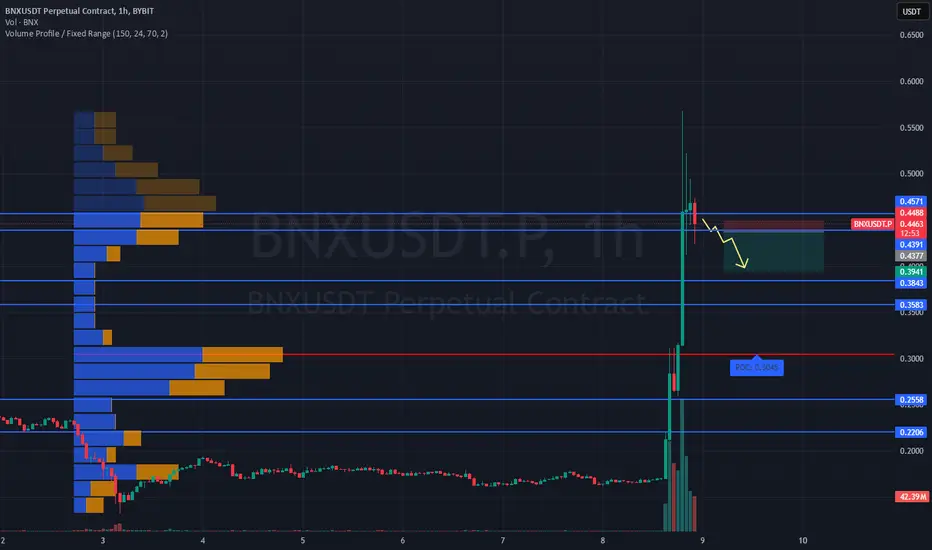
#BNXUSDT - Expecting price decline📉 SHORT BYBIT:BNXUSDT.P from $0.4377
🛡 Stop Loss: $0.4502
⏱ 1H Timeframe
✅ Overview:
➡️ BYBIT:BNXUSDT.P experienced a sharp pump, but after reaching $0.4735, signs of buyer exhaustion appeared.
➡️ The $0.4377 level now acts as a key resistance area. If the price fails to hold above it, a downward move is expected.
➡️ POC at $0.3045 confirms a high-liquidity zone, which could serve as a deeper retracement target.
➡️ High volume on recent candles suggests profit-taking by buyers, increasing the probability of a decline.
⚡ Plan:
➡️ Enter SHORT from $0.4377 if the price confirms rejection at resistance.
➡️ Risk management through Stop-Loss at $0.4502, above key selling pressure.
🎯 TP Targets:
💎 TP1: $0.3941 — first profit-taking level.
🔥 TP2: $0.3600 — next major support zone.
🚀 BYBIT:BNXUSDT.P Expecting a reversal and price decline!
📢 After a sharp price surge, BYBIT:BNXUSDT.P is showing weakness around $0.4377. It’s crucial to monitor this level for potential rejection.
📢 If the price breaks below $0.3941, further downside movement is likely, targeting $0.3600. However, if the price climbs above $0.4502, the short scenario could be invalidated.
How to determine trend line in trading?Determining a trend line in trading is a fundamental skill used to identify the direction and strength of a price trend. Here's a step-by-step guide to drawing and interpreting trend lines:
1. Understand the Basics of a Trend Line
A trend line is a straight line that connects two or more price points on a chart, extending into the future to act as a line of support or resistance.
Uptrend Line: Connects higher lows in an upward trend (acts as support).
Downtrend Line: Connects lower highs in a downward trend (acts as resistance).
Sideways/Ranging Market: Price moves horizontally, and trend lines may not be as effective.
2. Identify Key Price Points
For an uptrend, identify at least two higher lows (swing lows) and draw a line connecting them.
For a downtrend, identify at least two lower highs (swing highs) and draw a line connecting them.
The more times the price touches the trend line without breaking it, the stronger and more valid the trend line is.
3. Draw the Trend Line
Use a charting platform to draw the line manually.
Connect the swing lows for an uptrend or swing highs for a downtrend.
Ensure the line is not too steep or too flat; it should reflect the natural slope of the price movement.
4. Validate the Trend Line
A valid trend line should be touched by price at least three times. The more touches, the more reliable the trend line.
If the price breaks the trend line significantly, it may indicate a potential trend reversal or weakening of the current trend.
5. Use Trend Lines for Analysis
Support/Resistance: In an uptrend, the trend line acts as support. In a downtrend, it acts as resistance.
Breakouts: A break below an uptrend line or above a downtrend line may signal a trend reversal or continuation, depending on the context.
Trend Strength: A steep trend line may indicate a strong trend, while a shallow one may suggest a weaker trend.
6. Combine with Other Tools
Use trend lines in conjunction with other technical indicators (e.g., moving averages, RSI, MACD) to confirm trends and potential entry/exit points.
Look for volume confirmation: Increased volume during a breakout or bounce off the trend line adds validity to the signal.
7. Adjust as Needed
Trend lines are not static. As new price data comes in, you may need to redraw or adjust the trend line to reflect the current market conditions.
Example:
BTC has touched the line that I've drawn multiple time so It is a reliable Bullish Trend line. The next Possible connection can be around 93.5k! the line also acts as a support.
By mastering trend lines, you can better identify potential trading opportunities and manage risk effectively. Always practice on historical data and use proper risk management techniques.
