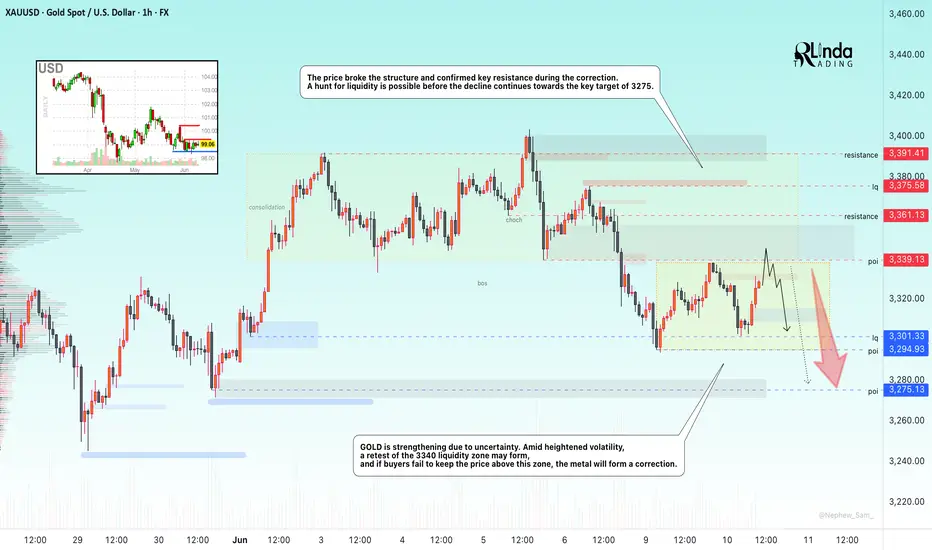
GOLD → Hunt for liquidity ahead of continued correctionFX:XAUUSD is strengthening due to uncertainty while the dollar consolidates. Amid heightened volatility, a retest of the 3340 liquidity zone may form, and if buyers fail to keep the price above this zone, gold may form a correction
Demand for the dollar is supported by the rise in USD/JPY after soft comments on interest rates by Bank of Japan Governor Ueda. Gold is responding with a correction. Traders remain cautious ahead of the outcome of the second day of trade talks between the US and China in London. Donald Trump confirmed that dialogue with Beijing is continuing, but key differences remain. Investors are also awaiting US inflation data (CPI), which could determine the further dynamics of the dollar and gold. Meanwhile, inflation expectations in the US fell from 3.6% to 3.2% in May.
Technically, gold broke the structure and confirmed key resistance during the correction. A hunt for liquidity is possible before the decline continues towards the key target of 3275.
Resistance levels: 3340, 3361
Support levels: 3301, 3275
The price is forming a new trading range of 3340 - 3301 (3294). Before declining, especially if the fundamental background changes to positive as negotiations progress, gold may test the liquidity zone of 3340 and form a false breakout, which will trigger a continuation of the correction to 3275.
Best regards, R. Linda!
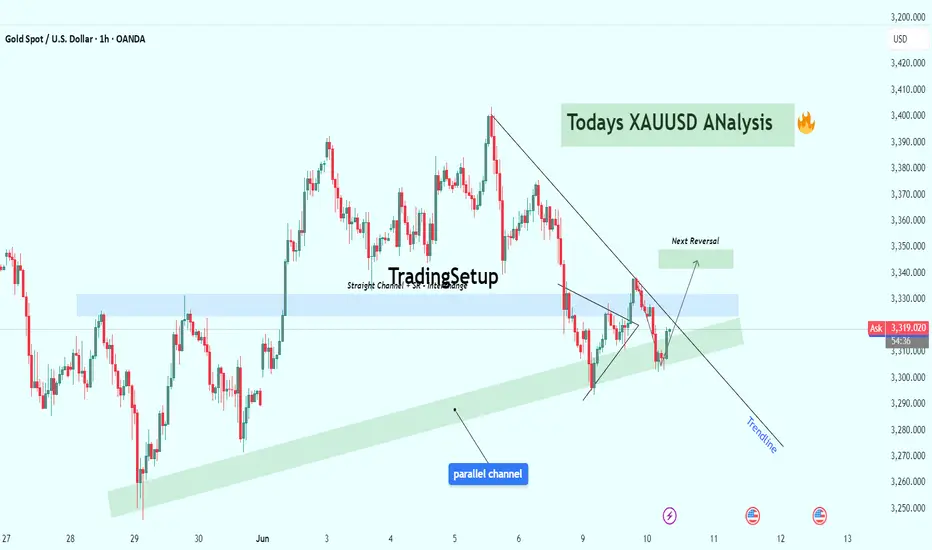
Trend Line Break
Gold (XAUUSD) Technical Analysis : MMC Setup Confirmed + Target📊 1. Market Structure Overview
After a strong rally earlier this month, XAUUSD entered a corrective phase and formed a descending trendline which acted as resistance for multiple days. This trendline has just been tested and broken, suggesting that the correction may be coming to an end.
At the same time, price is showing signs of strength by bouncing off the lower boundary of a long-standing parallel ascending channel—a structure that has acted as dynamic support over the past two weeks.
🧱 2. Key Technical Elements
🟦 Support/Resistance Interchange Zone (S/R Flip)
Price recently interacted with a horizontal S/R interchange zone around the $3,310–$3,330 area.
This zone served as resistance during the earlier part of the trend and is now acting as support after the breakout.
It also overlaps with the mid-section of the ascending channel, adding confluence to this support area.
📐 Descending Trendline Break
The break above the descending trendline signals a potential shift in momentum.
Traders often view this kind of breakout as an early indicator of bullish continuation, especially when combined with volume or retests.
🟩 Next Reversal/Target Zone
A green box is highlighted around the $3,345–$3,355 zone, which could act as the next resistance or reversal level.
This is based on prior market structure and Fibonacci extension zones.
This area may offer a take-profit level for longs or a short-term reversal zone for countertrend traders.
🔍 3. What to Watch
✅ Bullish Scenario
If the price sustains above $3,310 and holds above the broken trendline, we could see a push toward the $3,345–$3,355 area.
Ideal long entries may occur on a retest of the trendline or the S/R flip zone, confirming it as support.
❌ Bearish Scenario
Failure to hold above the $3,300–$3,310 support region would invalidate the breakout.
A clean break below this zone could result in a drop back to the lower parallel channel boundary near $3,270 or even lower.
⚙️ 4. Trading Plan & Bias
Short-term Bias: Bullish (Trendline break + support hold)
Mid-term Bias: Cautiously Bullish (until major resistance is tested)
Risk Management: Stop-loss for long entries should be placed below $3,300 with targets near $3,345 and $3,355.
💬 Conclusion
This setup presents a classic case of trendline breakout + S/R flip confluence, which often leads to favorable risk/reward opportunities. Gold traders should monitor the retest behavior around current levels closely, as it will likely determine the next directional move.
📌 Always wait for confirmation, manage risk, and don’t chase moves—especially near major zones.
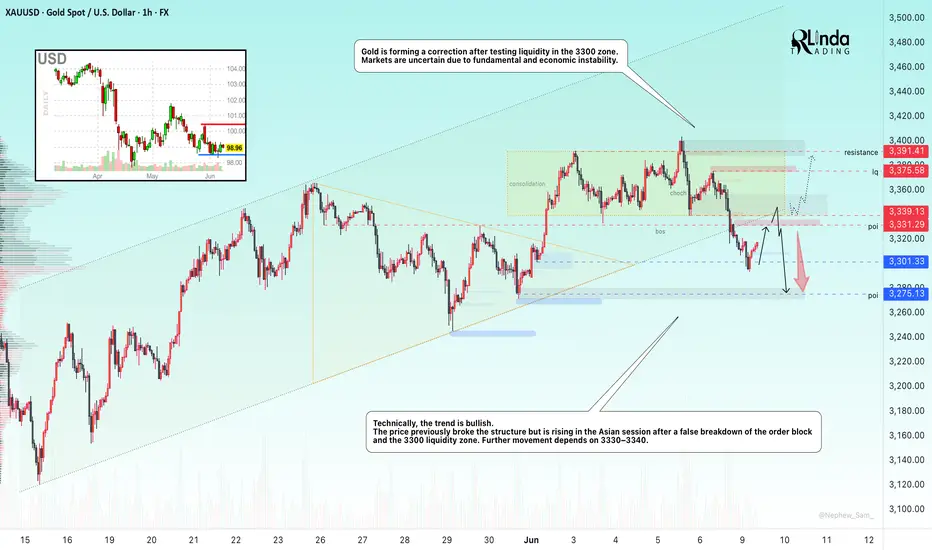
GOLD → Correction before a decline or continuation of the trend?FX:XAUUSD is testing the liquidity zone during the Asian session and forming a false breakout. The metal is recovering, but the fundamental background remains unstable...
On Monday, gold is holding steady at around $3,300 amid a weaker dollar and caution among traders ahead of US-China talks and the release of US inflation data (CPI) on Wednesday. Strong NFP data for May strengthened the dollar and lowered expectations for a Fed rate cut. However, domestic problems in the US are putting pressure on the currency... Markets are adjusting positions ahead of CPI. Geopolitics and domestic unrest in the US are holding back gold's decline, despite possible optimism about a trade deal.
Technically, the trend is bullish, with the price previously breaking the structure but rising in the Asian session after a false breakdown of the order block and the 3300 liquidity zone. Further movement depends on 3330 - 3340
Resistance levels: 33301, 3339, 3375
Support levels: 3301, 3275
The price is heading towards 3330-3340 for a retest. If the dollar continues to decline and gold manages to consolidate above 3340, the bullish trend may continue. BUT! A false breakout of the 3330-3340 zone could trigger a further decline after the bullish structure breaks down.
Best regards, R. Linda!
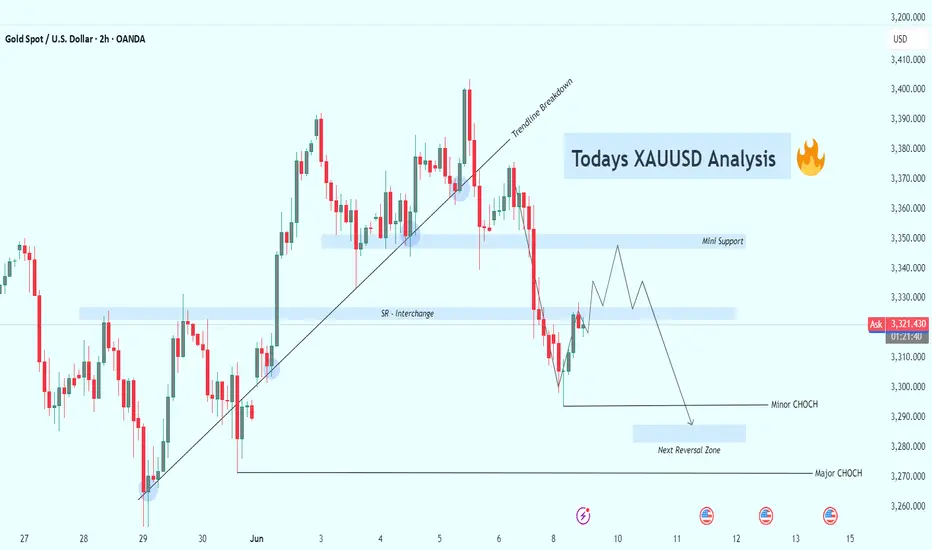
XAUUSD Analysis – From Bullish Momentum to Target🔍 Overview:
Gold has officially broken its ascending trendline, signaling a shift in market structure from bullish to bearish. This trendline acted as dynamic support for days, but its breakdown has opened the doors to potential downside movement. We're now in a phase where lower highs and lower lows are forming — a classic bearish signal.
📌 Key Levels & Price Zones:
🔻 Trendline Breakdown
A strong upward trendline was broken, confirming that bullish momentum has weakened. The trendline break was followed by aggressive bearish candles, signaling that sellers are gaining strength.
🔄 SR Interchange Zone (~3,322 – 3,330)
This area once acted as strong support and has now flipped to resistance. It’s a key level to watch for rejections or false breakouts. As long as the price stays below it, the bias remains bearish.
🔽 Mini Support Zone (~3,345 – 3,350)
A weak support area that could be retested. If price fails to hold above it, sellers will likely take over again.
⚠️ Minor CHoCH (~3,290)
This level marks the short-term structure shift. A breakdown here will confirm continuation to the downside. A short opportunity might present itself below this zone.
🌀 Next Reversal Zone (~3,275 – 3,280)
A potential demand area. Watch how the price reacts — this is where bulls might step in temporarily for a bounce or consolidation.
🚨 Major CHoCH (~3,265)
This is a critical support level. If it breaks, the entire bullish structure from early June is invalidated, opening the door to deeper retracement.
📈 Forecast Path:
Based on the price projection:
Expect lower highs to form.
If bearish momentum continues, we could see a breakdown below Minor CHoCH, targeting the Next Reversal Zone.
A clean break below 3,265 would signal a major trend change, confirming bearish control.
📊 Trade Ideas:
🔻 Short-Term Bearish Scenario:
Look for price to reject the SR Interchange or Mini Support zones.
Entry: After confirmation below 3,330
Targets: 3,290 → 3,275 → 3,265
SL: Above 3,350
🔼 Bullish Bounce Scenario:
If price reaches 3,275 and forms bullish confirmation (engulfing candle, divergence), we might see a short-term reversal.
Entry: On bullish candle close from support zone
Target: Back to 3,322 or higher
📅 Upcoming Events to Watch:
There are several U.S. economic data releases coming this week (marked on the chart). These can create sharp moves in XAUUSD, so manage your risk wisely.
✅ Final Thoughts:
Gold is at a key turning point. The breakdown from the trendline is significant, and structure now favors sellers — unless bulls reclaim critical levels. Wait for confirmation before entering, and always trade with proper risk management.
📌 Follow for more clean chart breakdowns, updates, and trade setups!
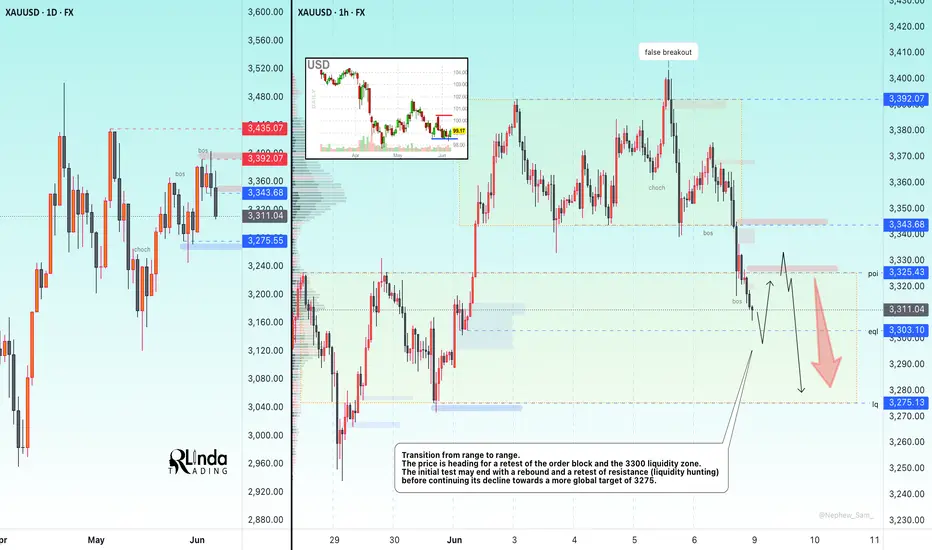
GOLD → Correction to 3275FX:XAUUSD and medium-term outlook: Friday's strong unemployment data strengthened the dollar and triggered a sell-off in gold. Money is temporarily flowing out of the metal and into currencies and the stock market...
Technically, gold is still in a bullish phase on the global timeframe. Logically, the situation is more reminiscent of a countertrend correction of the zone of interest before continuing growth.
Despite the rise in the DXY after Friday's news, the dollar is still under pressure from Trump, who is pushing for an early interest rate cut. This move could significantly shake the market (dollar down, gold up)
Locally, on the hourly XAUUSD timeframe, we can clearly see how the price is breaking out of the uptrend, thereby triggering a downward impulse.
Resistance levels: 3325, 3343
Support levels: 3303, 3275
The liquidity level of 3300 could act as a magnet for the price, from which a correction to the resistance of the range of 3325 could form (liquidity hunt), but due to the change in the fundamental background, gold may continue its correction to 3275 (support zone) before a possible continuation of growth.
Best regards, R. Linda!
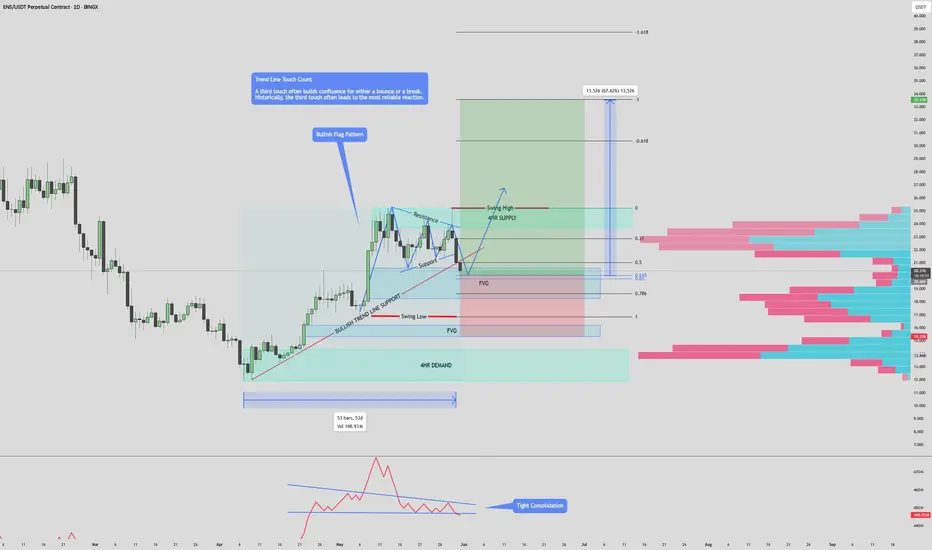
$ENS / USDT 1D FAKEOUT ON FLAG? Incoming Pump? 📊 $ENS/USDT Perpetual Contract – Daily Timeframe Analysis
🟢 Bullish Setup
A bullish flag is forming on the daily chart — a continuation pattern indicating potential upward movement.
- Price recently entered into the golden pocket of the Fibonacci retracement tool marked from $16.881 – $25.241 on the third touch of the flag's resistance, triggering a fakeout, it now rests in the first Fair Value Gap.
- The strong wick rejection on the 3rd retest of the resistance/supply indicates bearish strength, momentarily pushing price lower.
- Despite this, the overall pattern remains valid as long as price respects the Golden Pocket and FVG zone below.
✅ If price closes above the golden pocket, it could present an excellent leveraged entry or spot position, with high reward potential off 67%.
🔴 Bearish Scenario
- So far, every test of the **4H supply zone** has resulted in rejection — showing persistent seller control at short-term resistance.
- If buyers fail to defend the golden pocket and recover the bullish trendline, the structure confirms a break. (Downtrend)
The confirmation of bearish pressure is the:
1) Large wick (Creating a shooting start candle pattern)
- Signaling bearish reversal.
2) Large Bearish Marubozu Candle.
- Indicates strong continuation of a downtrend.
3) Candle close below Trend line support.
- Showing Bears were able to successful make a major move.
🔽 In that case, we look to short after FVG confirmation and scalp down toward the daily demand zone.
📌 Patience is key. Let the price show intent before entering.
Please let me know what your thoughts are!
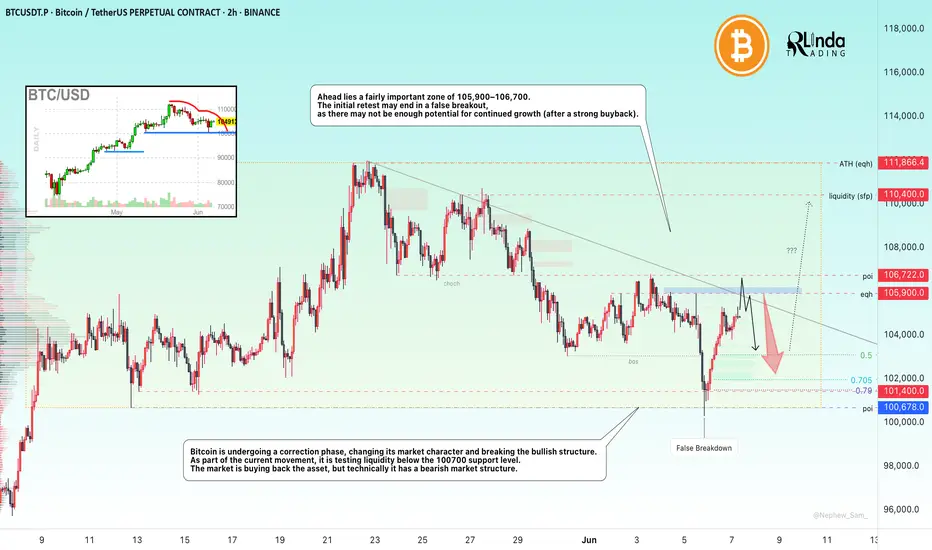
BITCOIN → Correction. The hunt for liquidity...BINANCE:BTCUSDT.P is recovering after liquidity was captured in the 100K zone. Locally, the technical situation is controversial despite the global bullish trend
Bitcoin is changing its market character (106700) and breaking the bullish structure (103000) during a correction phase. As part of the downward momentum, the movement is testing liquidity below the 100700 support level. As for the liquidation, there are several reasons: the conflict between Trump and Musk, strangely enough, the market reacted with a fall; the liquidation of whales, history repeats itself...
Traders are buying back Bitcoin, but technically the market has a bearish structure. Locally, there is a bearish trend, and a countertrend correction, “liquidity hunting,” is forming.
Ahead lies a fairly important zone of 105900-106700. The initial retest may end in a false breakout, as there may not be enough potential for continued growth (after a strong buyback).
Resistance levels: 105,900, 106,720, 110,400
Support levels: 103000, 101400, 100K
After a correction from 105900, which could target half (0.5) of the trading range, the market may attempt to return to a bullish phase, provided that the bulls keep the price from falling and do not allow it to update local lows. That is, in the short term, I expect a decline from 105900 to 103000, but further, if the price starts to return to 105500-105900, there may be chances for growth to 110K
Best regards, R. Linda!
Intel - This might be the bottom!Intel - NASDAQ:INTC - might create a bottom:
(click chart above to see the in depth analysis👆🏻)
For almost an entire year, Intel has been consolidating at a major horizontal support. Considering the previous significant bloodbath, Intel might soon find its bottom, which is inevitably followed by a major bullish reversal. After all, market structure is slowly shifting bullish.
Levels to watch: $20.0, $25.0
Keep your long term vision!
Philip (BasicTrading)

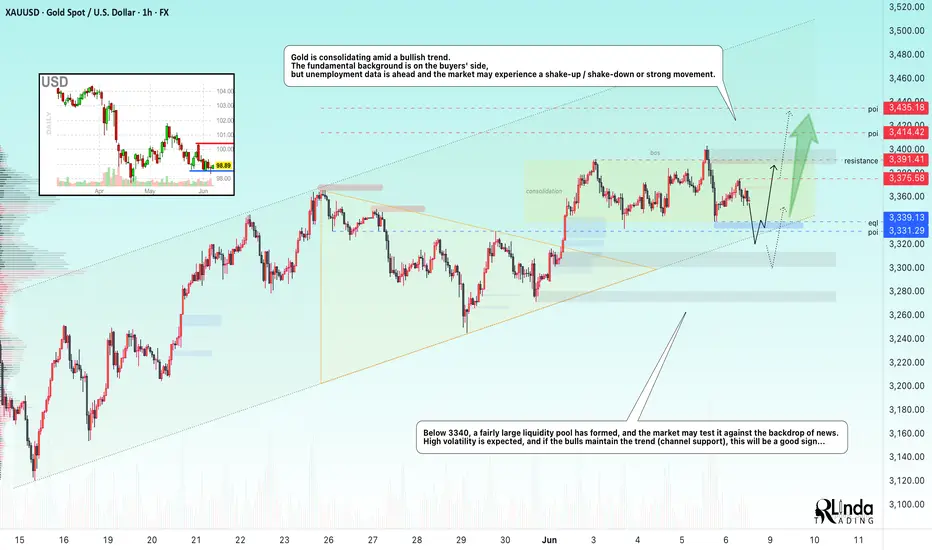
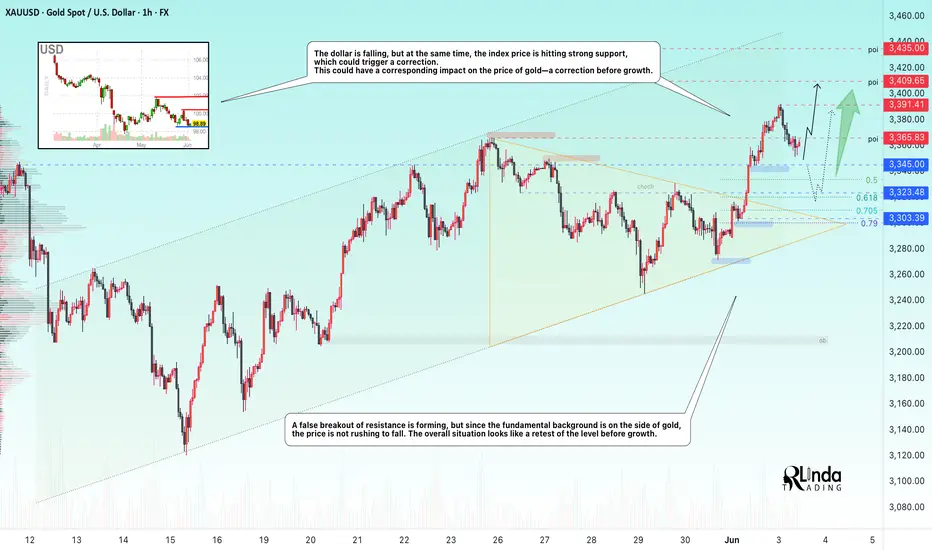
GOLD → Intra-range strategy. Waiting for NFPFX:XAUUSD remains consolidated in the 3340-3391 range. The price is stuck in the middle of the range due to the uncertainty created by upcoming unemployment news...
On Friday, gold rose slightly, remaining within the range ahead of important US employment data (NFP), which could set the direction for the market. Optimism over the US-China deal and profit-taking on the dollar are supporting the USD, holding back gold's rise. A weak NFP (less than 100,000) will reinforce expectations of a Fed rate cut and support gold. A strong report (above 200,000) will have the opposite effect. The probability of a rate cut in September is 54%.
Technically, on the daily timeframe, the market structure is bullish. After a sharp breakout of resistance and a new high, the price is consolidating above the upward trend line, forming a plateau in the 3300-3340 zone. Another shakeout from support is possible before the trend resumes
Resistance levels: 3375, 3391, 3414
Support levels: 3339, 3331
Forming a price forecast ahead of news, especially ahead of NFP, is a thankless task. Therefore, it is advisable to wait for the news and monitor the price reaction. A retest of the consolidation boundary and a rebound are possible. There is a chance that the price will remain in consolidation until next week, but again, it all depends on the fundamental background...
Best regards, R. Linda!
USDCAD → One step away from distributionFX:USDCAD is recovering amid the dollar's growth. Unemployment news is ahead. A return of the price to the buying zone may support the currency pair.
Against the backdrop of the dollar's growth, a change in the market phase is forming (unconfirmed). The price has stopped updating lows and is forming an eql, from which it is breaking out of the downtrend. The initial retest of liquidity at 1.366 may end in a correction. However, a quick retest and consolidation of the price above the level will confirm the change in sentiment
Resistance levels: 1.3686, 1.3732
Support levels: 1.3675, 1.366
Despite the fact that the price broke the downward resistance, the currency pair is still under pressure from sellers who are waiting for the price to fall from 1.3686. A breakout, a change in market sentiment to bullish, and consolidation above 1.3675-1.3686 will confirm readiness for a recovery. Zones of interest: eqh 1.3732
Best regards, R. Linda!

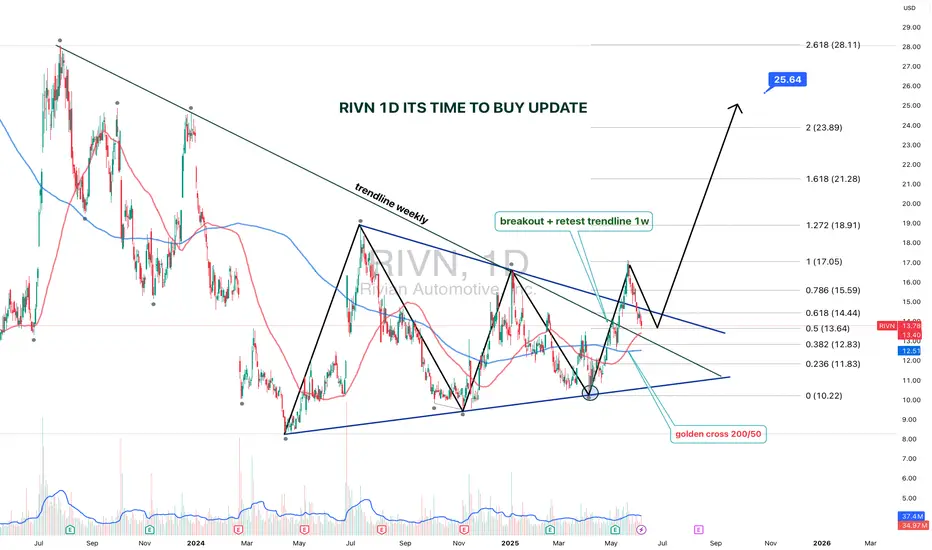
RIVN 1D — It’s Time to Buy: Setup UpdateThe setup on Rivian (RIVN) just got upgraded from “interesting” to “strategically significant.” We’re looking at a textbook symmetrical triangle that’s been developing since July 2023, with a clean breakout and retest on the weekly trendline.
The breakout was followed by a bullish retest, right at the intersection of the triangle base and the key trendline. Volume kicked in, price held — and that’s what smart money calls confirmation.
Now, the Golden Cross is live: the 50-day MA just crossed the 200-day MA from below. Price is confidently holding above both — momentum is shifting hard. Fibs from the bottom (10.22) to the last local top (17.05) project the first target at $17, and the extended Fibonacci confluence gives us $25.64 as a long-range goal (2.618 extension).
The weekly trendline — which acted as resistance for over a year — has flipped to support. Price action respects it, bulls are loading, and structure is clean.
This is not just a bounce. It’s a technical rotation from accumulation to expansion.
The time to talk about potential is over — price action has spoken.
APL APOLLO TUBES - Rectabgular PatternNSE:APLAPOLLO in 2 Year Break Out. It has formed a Rectangular Pattern. If it's able to sustain above 1810, you can Target for 1900 and Exit.
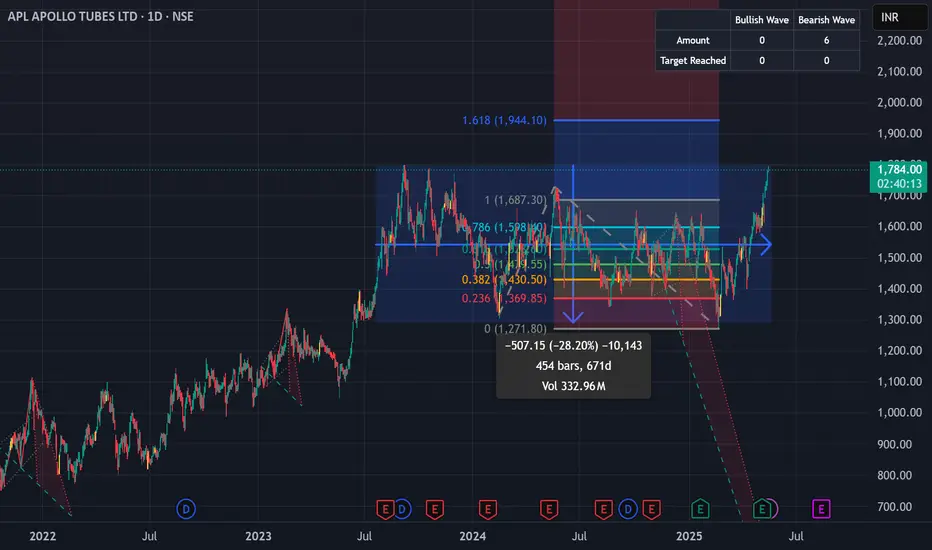
Breakout!
Closed at 11.09 (05-06-2025)
Crossing & Sustaining 11.27 - 11.30
is a very healthy sign making the
price move towards 14 - 15
On the flip side, 9.60 - 10 is a very Good
Support level.

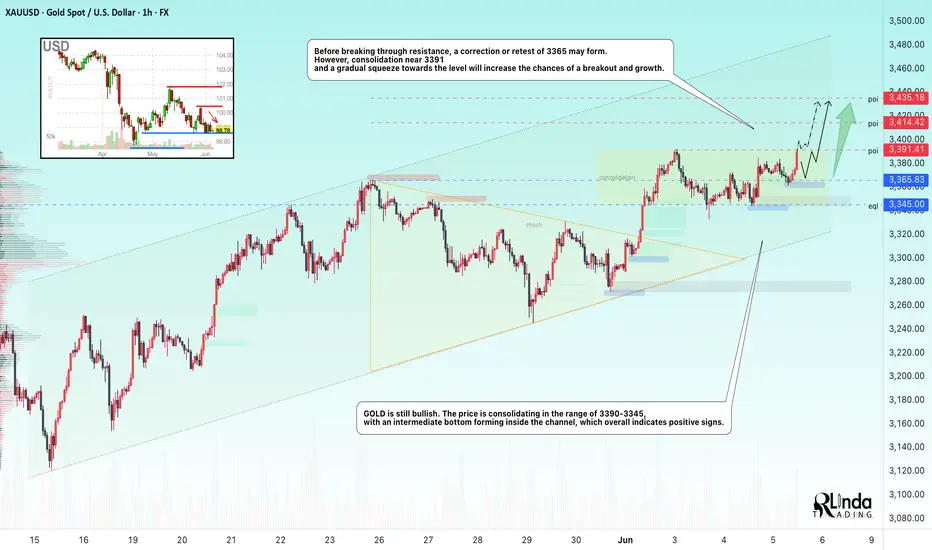
GOLD → Retesting resistance may lead to a breakoutFX:XAUUSD is still bullish. The price is consolidating in the range of 3390-3345, with an intermediate bottom forming inside the channel, which overall indicates positive signs.
On Thursday, gold is consolidating ahead of $3390. Consolidation after growth, within a bullish trend, is a good sign. But, on the one hand, the price is supported by growing tensions between Russia and Ukraine. On the other hand, optimism about US trade negotiations with Canada, the EU, and China is strengthening the dollar and holding back demand for gold.
Additional pressure on the dollar is coming from weak US macro statistics, especially ADP data and the decline in the ISM Services PMI, which have reinforced expectations of Fed policy easing. Traders are waiting for further signals from the regulator.
Resistance levels: 3391.4, 3414, 3435
Support levels: 3365, 3345
Technically, gold is rising and forming a retest of consolidation resistance. If the 3391 level is broken, the price may head towards 3435. Before breaking through resistance, a correction or retest of 3365 may form. However, consolidation near 3391 and a gradual squeeze towards the level will increase the chances of a breakout and growth.
Best regards, R. Linda!
Nasdaq - The final bullrun breakout!Nasdaq - TVC:NDQ - might break above all structure:
(click chart above to see the in depth analysis👆🏻)
It is quite incredible how volatile stocks have been lately, especially considering that fact that the Nasdaq is about to create new all time highs again. Consequently, we are about to witness a significant structure breakout, which would ultimately lead to another rally of about +30%.
Levels to watch: $21.000
Keep your long term vision!
Philip (BasicTrading)

EURJPY higher bearish expectations from here
OANDA:EURJPY analysis before this one, is be closed, i am note will share new analysis on EJ soon.
ASCENDING CHANNEL visible, price in zone currently, after ISM events today, we are not see break of res zone 164.250, which for me having positive imact on bearish expectations here.
Trend line is breaekd and soon exxpecting to see and break of ASCEDING CHANNEL and higher bearish fall continuation.
SUP zone: 164.250
RES zone: 161.750, 160.900

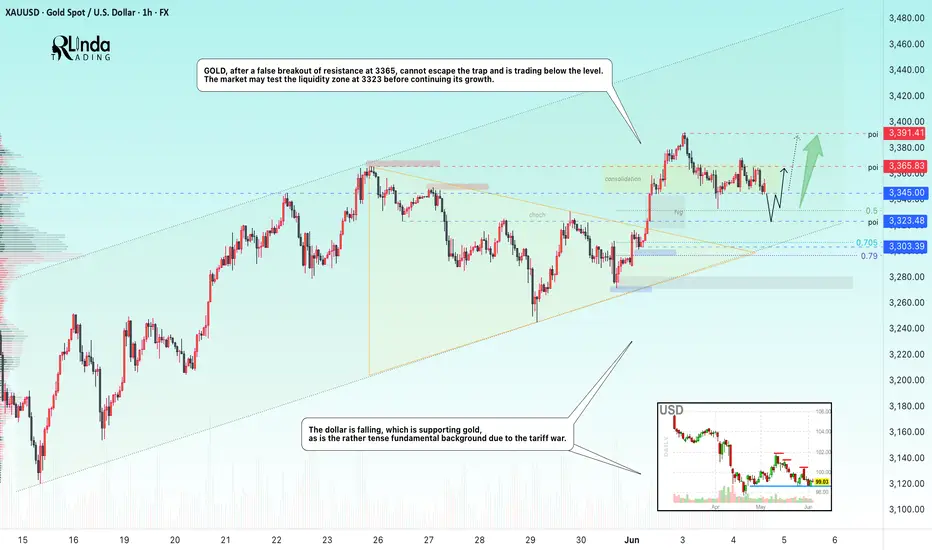
GOLD → Consolidation before a strong move...FX:XAUUSD is consolidating after a false breakout of resistance at 3365, awaiting economic data. The metal remains attractive to investors amid the economic crisis.
Gold is supported by the weakening dollar amid increased trade risks. Today, US tariffs on steel and aluminum come into force, and Trump's ultimatum to trading partners expires. Investors are also awaiting news of a possible meeting between Trump and Xi Jinping amid new accusations against China. The focus is on key employment data (ADP) and the ISM services index, which could influence the dollar and expectations for the Fed's actions.
Technically, the market may test the 3323 liquidity zone before continuing its growth.
Resistance levels: 3365, 3391
Support levels: 3345, 3323, 3303
Overall, both the global and local trends are bullish, with the price forming a local correction after a false breakout of resistance. If the bulls hold their ground above 3323-3345 after retesting support, growth may continue in the short to medium term.
Best regards, R. Linda!
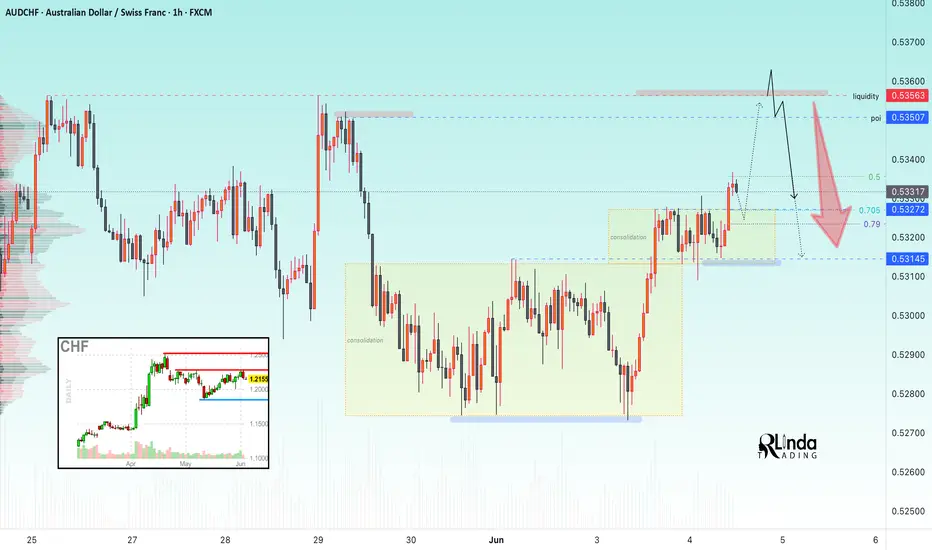
AUDCHF → Hunting for liquidity. Fall from resistanceFX:AUDCHF is emerging from local consolidation and entering a distribution phase. Potentially, against the backdrop of a downtrend, the market may be interested in the liquidity zone at 0.5356
Globally, we have a strong downtrend and a countertrend correction that is facing pressure in the 0.545 zone. The decline is resuming, but at some point the market formed an EQH liquidity pool at 0.5356, which is most likely acting as a magnet pulling the price towards it...
Based on the technical situation, we can conclude that if the price continues to form a distribution towards the target, the market is quite capable of stopping the price and returning to the downtrend phase.
Resistance levels: 0.535, 0.5356
Support levels: 0.5327, 0.5314
Thus, a breakout of the resistance level of 0.5356 without the possibility of continuing growth and a return of the price below the resistance level with subsequent price consolidation in the sales zone (below 0.5356) may trigger a resumption of the downward trend.
Best regards, R. Lind
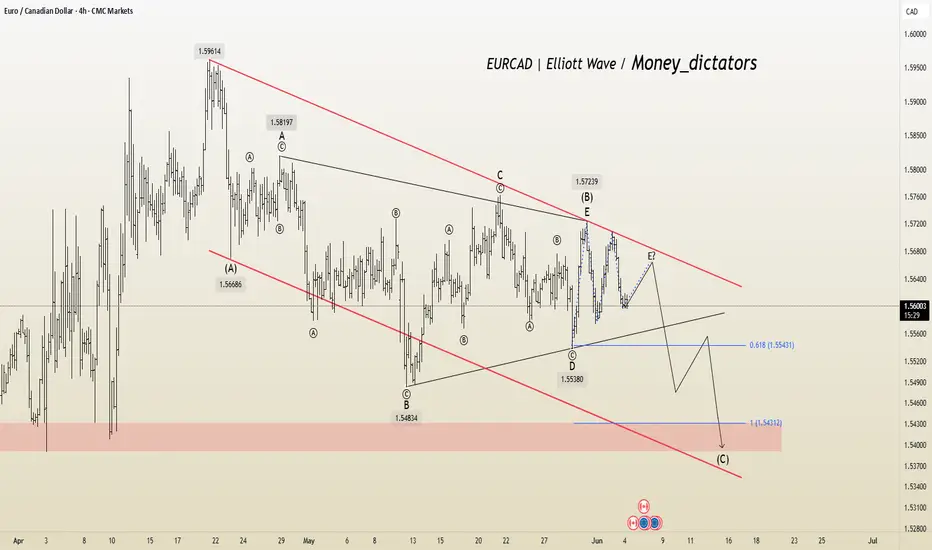
EURCAD's Triangle Hints Drop AheadThe correction looks like a contracting triangle, which is a common pattern in Elliott Wave theory. This kind of triangle usually forms during wave B or wave 4. It includes five smaller waves labeled A, B, C, D, and E, which move within two sloping lines that get closer together. There is also a demand zone marked in red on the chart.
Triangles often show a pause in the market before the price continues in the same direction as before. In this case, the triangle suggests that once wave E is complete, the price may drop again to finish wave C. The expected target area is between 1.54900 and 1.54320. This outlook remains valid as long as the price stays within the correction channel.
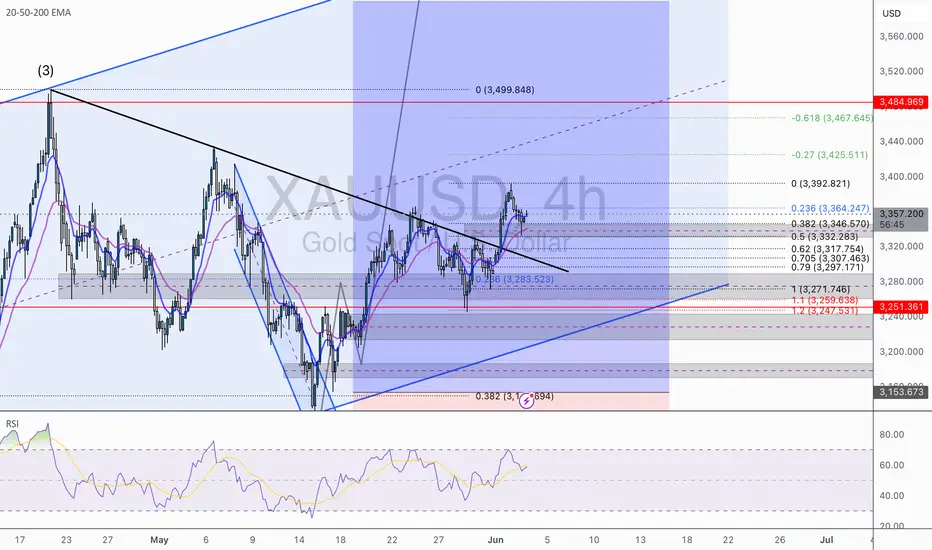
XAU/USD Update - Riding Wave 5 to the TopGold continues its bullish recovery, having completed Wave (4) at the channel low. We're now riding Wave (5) with strong momentum.
🔹 Entry Executed: Entered long at the 0.382 Fibonacci retracement – $3,272.57, a key confluence zone with the EMA and previous structure support.
📈 Bullish Targets:
$3,396.89 (0.27 extension)
$3,463.25 (0.618 extension)
$3,499.84 (1.0 extension / Wave (5) completion)
The move is playing out cleanly, with RSI confirming upside momentum. As long as price holds above the 0.5–0.618 zone, bulls remain in control.
Letting this one breathe — eyes on higher highs. 💰📈
@WrightWayInvestments
@WrightWayInvestments
@WrightWayInvestments
GBPCAD SELL OPPORTUNITY 5 MIN TIMEFRAMEClear trend breakout and retest has occured. Targetting for it to hit the large imbalance on the left before going down which it did. Targetting imbalances on 5 min tf. the 30 min and 4 hr 10 and 20 EMA on downtrend too

GOLD → Correction to liquidity before growthFX:XAUUSD is in the realization phase after exiting the “symmetrical triangle” consolidation. The price is supported by the trend and a complex fundamental background.
Gold is retreating from its peak, remaining below risk support. The price of gold is falling moderately from $3,392, awaiting data on JOLTS job openings in the US.
Gold is supported by trade and geopolitical risks: Trump doubled tariffs on metals, increasing pressure on the dollar. The conflict with China has escalated due to allegations of violations of agreements.
Focus on US employment: Strong data could support the dollar and limit gold's gains, but the technical picture remains bullish.
Resistance levels: 3365, 3391, 3409
Support levels: 3345, 3323
Against the backdrop of a rising dollar, gold may test deeper liquidity zones, such as 3345 and 3330. However, if trading forms between 3365 and 3345, followed by a retest of resistance and consolidation above 3365, this could trigger an early rise to 3391-3409.
Best regards, R. Linda!
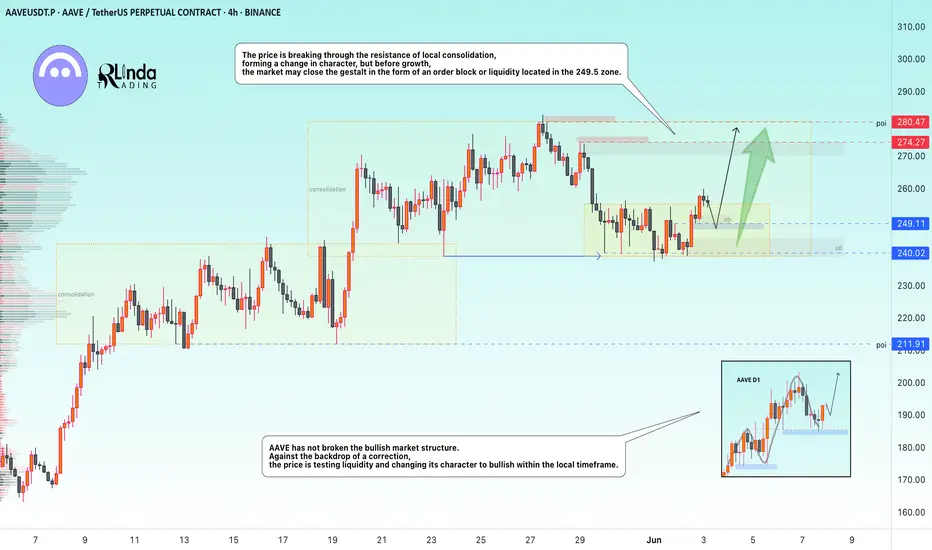
AAVEUSDT → A false breakdown provokes a change of characterBINANCE:AAVEUSDT.P maintains a bullish market structure. The coin is consolidating, with bulls trying to hold their ground above the key support line.
Against the backdrop of a correction, the price is testing liquidity, with a false breakdown of support provoking a change in character to bullish within the local timeframe. Bulls are trying to maintain the bullish structure.
The price is breaking through the resistance of local consolidation, forming a change in character, but before growth, the market may close the gestalt in the form of an order block or liquidity located in the 249.5 zone.
Support levels: 249.11, 240.0
Resistance levels: 274.27, 280.47
Technically, the coin looks quite good and promising overall. If the bulls hold their ground in the 249-250 zone, then in the short to medium term, we could see good movement with the possibility of new highs...
Best regards, R. Linda!