GOLD → Correction ahead of news. Will the decline resume?FX:XAUUSD has been buying back all the losses from the Asian and Pacific sessions since the opening of the European session, but this looks more like a catapult being loaded...
GOLD broke through the global consolidation base of 3200, which only confirmed the bearish market structure. Investors are waiting for PPI and retail sales data in the US, as well as Fed Chair Powell's speech.
Expectations of fewer Fed rate cuts and optimism surrounding trade talks with China and South Korea continue to weigh on gold. However, weak macro data and a growing US budget deficit could revive interest in this safe-haven asset.
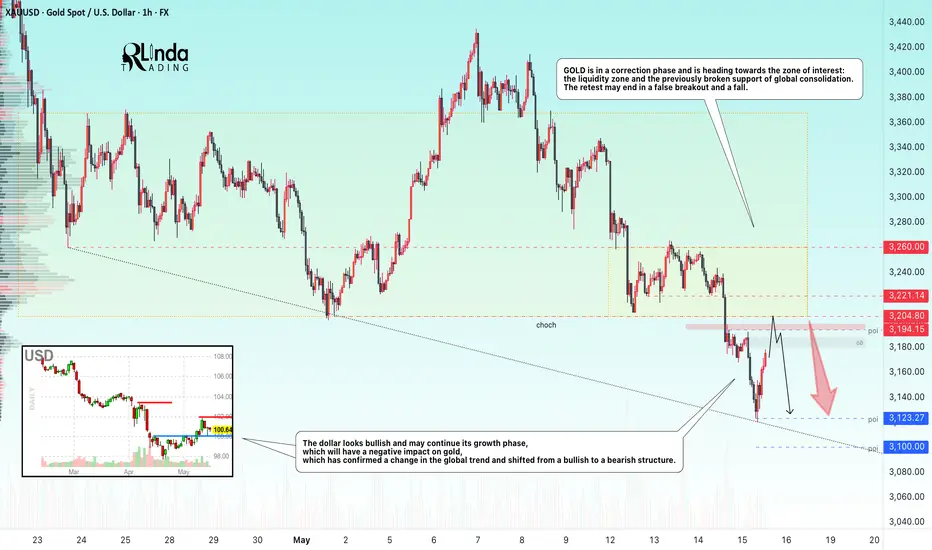
GOLD is in a correction phase and is heading towards the zone of interest: the liquidity zone and previously broken support of global consolidation.
Resistance levels: 3187-3190, 3200
Support levels: 3123, 3100
Gold may test the indicated resistance, but based on the nature of the market, this situation may end in a false breakout and a fall. Target 3123 - 3100.
However, unpredictable data may temporarily change the market, which could lead to momentum towards 3220-3230.
Best regards, R. Linda!
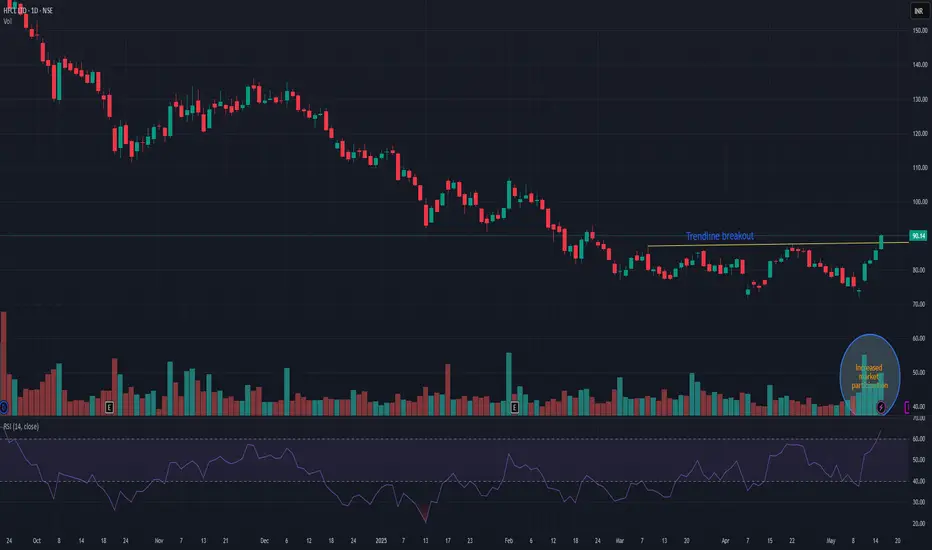
Trend Line Break
HFCLHFCL showing trendline breakout with higher high pattern. Market participation has also increased since few sessions. Probability of new momentum rally is quite higher. It has also booked highest weekly volume since last 7-8 months.
ETHEREUM → Consolidation. Which way will the distribution go?BINANCE:ETHUSDT.P has moved into a consolidation phase after the distribution phase. Focus on the 2414-2725 range. A retest of support is possible during the current phase. Despite the bullish trend, there are risks of a reversal...
ETH has been a fairly unprofitable project over the past few years, with the price hitting one bottom after another. While Bitcoin and altcoins were flying high, ETH has only shown itself to be a bull in the last few days.
In the current phase, the focus is on the consolidation boundaries, as well as the 2550 level. If the bulls keep the market above 2550, then the coin could strengthen to 2725, which would be a positive sign for us that buyers are interested in continued growth.
If ETH continues its correction towards support at 2414, then we will need to monitor the market's reaction to this level. I remain skeptical about ETH due to its weak long-term performance despite a strong fundamental backdrop.
Resistance levels: 2550, 2725
Support levels: 2414, 2260
Further movement will determine the price's exit from consolidation: a breakdown of support means a fall, a breakout of resistance means growth. But the current scenario is trading within the range. If ETH trades near 2725 and forms a pre-breakout consolidation, then we will have a chance for growth.
The opposite scenario is if the price falls below 2550 and begins to test 2414. In this case, sticking to the support level and numerous retests will indicate that the bull market has exhausted its strength and we can expect a correction to 2260-2065.
Best regards, R. Linda!

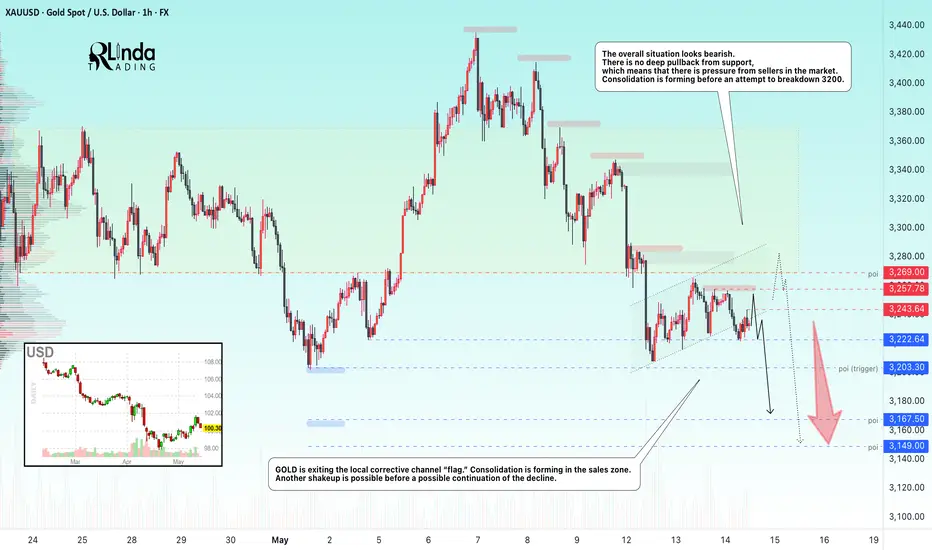
GOLD → One step away from a bullish trend reversalFX:XAUUSD is emerging from the local corrective channel “flag.” Pre-breakdown consolidation relative to the base of the reversal pattern continues. All eyes are on 3200...
Gold is losing ground amid trade optimism and a strong dollar. The price is falling at the start of Wednesday as traders take profits after a rise from weekly lows. Weaker-than-expected US inflation has not justified expectations, but the Fed's refusal to cut rates soon is weighing on the metal. Optimism surrounding new trade agreements between the US and China, the UK, and other countries, as well as hopes for peace talks between Russia and Ukraine, are reducing demand for gold as a safe-haven asset.
Technically, the overall situation looks bearish. There is no deep pullback from support, which means pressure from sellers in the market. Consolidation is forming before an attempt to break through the 3200 level.
Resistance levels: 3243, 3257, 3269
Support levels: 3222, 3200
If the price continues to consolidate in the current local range and continues to attack support at 3222-3200, then in the short and medium term, we can expect the decline to continue. However, knowing the tricks of MM, the price may form a short squeeze relative to local resistance zones before falling further.
Best regards, R. Linda!
NZDJPY → Countertrend correction and false breakoutFX:NZDJPY is testing resistance within a global downtrend. The currency pair is not yet ready to continue its growth and is forming a local reversal pattern.
Within the global downtrend, the currency pair is forming a countertrend correction and testing resistance at 87.400. The liquidity pool formed above this level is not yet ready to let the price move further. Without the possibility of continuing growth, the price returns to the range and forms a false breakout of resistance. However, since we are in the range and the price has returned inside it, if the bears hold the line (the upper limit of the trading range) at 87.400, this could trigger a further decline, thereby continuing the global downtrend.
Resistance levels: 87.400
Support levels: 86.5, 85.26
Consolidation of the price below 87.400 will confirm that the price is not yet ready to continue the trend. The falling dollar index is provoking a rise in the Japanese yen, which may also put pressure on the currency pair.
Best regards, R. Linda!

AAPL | Apple Stock | Three Drives Down PATTERNThe Three Drives / Three Dives Down pattern is usually short term bearish , but near term and long term bullish .
Previously, we saw a -32% correction. This time, it could be a little higher if we consider the previous neckline support:
The only way I see this paying out differently, is if the price captures the current resistance zone, and CLOSES above it:
__________________
NASDAQ:AAPL

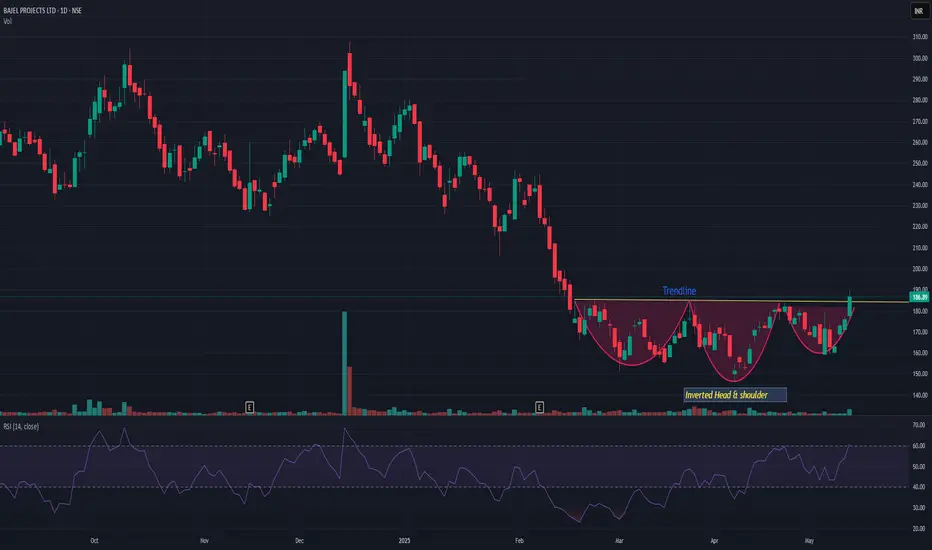
BAJELBAJEL seems a perfect candidate for very short term momentum play. Showing Inverted H&S pattern breakout with decent volume. We may see 18-20% rally from this breakout level. Pattern may confirm pause in recent fall and now showing strong reversal from here. 178 is very strong support. Risk reward is in favor!
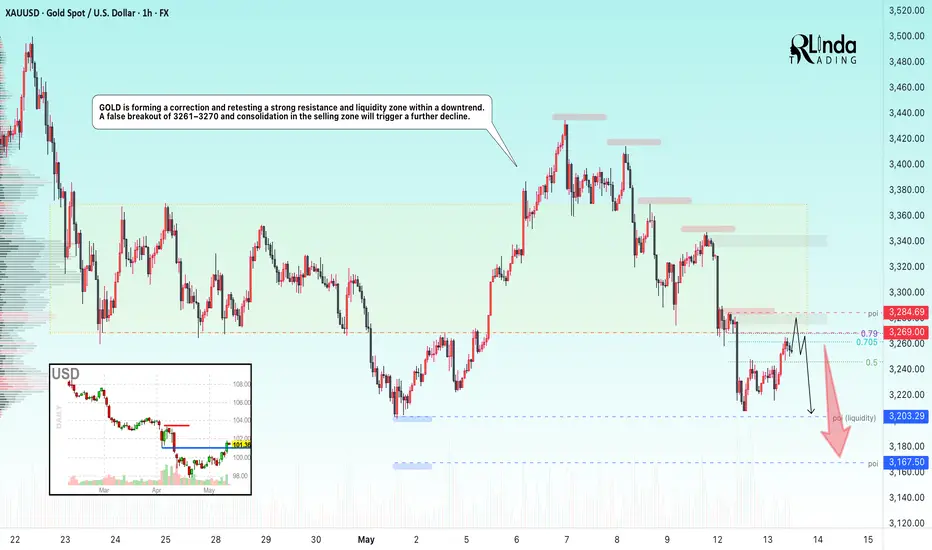
GOLD → Retest resistance before fallingFX:XAUUSD is forming a correction and retesting a strong resistance and liquidity zone within a downtrend. The global trend is one step away from a reversal...
Gold stabilized ahead of the release of US inflation data. After falling 3%, gold is holding steady at around $3,200, consolidating against a weaker dollar. Investors are awaiting US CPI data, which could set a new direction.
Optimism about the US-China trade agreement, geopolitical détente, and profit-taking on the dollar are holding back the price decline. The market is assessing how inflation data will affect Fed policy and demand for safe-haven assets.
Globally, the market doubts that the upward trend will continue, and there are reasons to look for points from which the price could start to fall sharply...
Resistance levels: 3269, 3284
Support levels: 3246, 3200, 3167
The news may cause a shake-up, but if there are no surprises, a false breakout of 3260-3270 and consolidation of prices in the selling zone could trigger a decline to 3200-3150.
Best regards, R. Linda!
SUIUSDT → False breakdown of support before growthBINANCE:SUIUSDT has entered a consolidation phase within a bullish trend. The chart shows a zone of interest and a trigger area that are worth paying attention to...
The coin looks quite positive. An upward trend is forming, which is also supported by the growth of Bitcoin and a relatively positive fundamental background.
Technically, SUI is consolidating between 4.110 and 3.811. Below the support level, a huge liquidity pool has formed, which has not yet been tested. There is a high probability of a false breakdown before the growth continues, but if the market turns out to be more aggressive, buyers may not let the price fall to 3.811, in which case we can consider a breakout of the resistance at 4.11-4.275 and consolidation of the price above these levels with the aim of continuing growth.
Support levels: 3.811, 3.667
Resistance levels: 4.11, 4.275
The movement of Bitcoin shows that the market is gathering liquidity as part of a local correction against the backdrop of a bullish trend. Yesterday, we all witnessed a local liquidation, but there are no reasons for a decline yet. SUI, in an ideal scenario, may test support at 3.811 and form a false breakdown before continuing to grow.
Best regards, R. Linda!

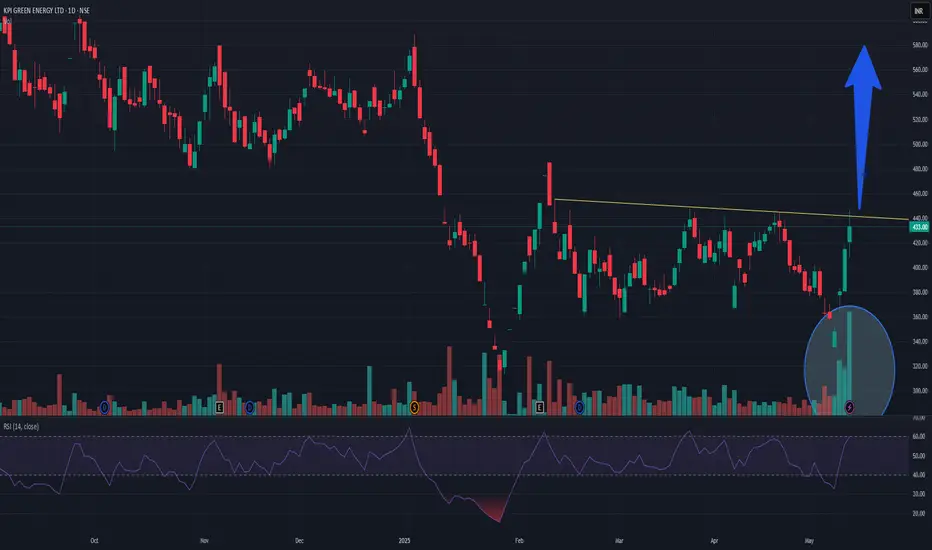
KPIGREENKPIGREEN has posted solid numbers. Technically on trendline breakout. now if it crosses and closes above 448 then it may take a new ride from here. 30-35% from here is very much possible provided that 400 it hold 400 support! Volume also increased in last few sessions. But Close above 448 is very important.
Tesla - The Next 7 Days Decide Everything!Tesla ( NASDAQ:TSLA ) is sitting at a crucial structure:
Click chart above to see the detailed analysis👆🏻
Despite the -60% correction which we have been seeing over the past couple of months, Tesla still continuously validates its overall uptrend. That's exactly the reason for my strong bullish thesis and the assumption, that after we see bullish confirmation, Tesla will reject the current support area.
Levels to watch: $250, $400
Keep your long term vision,
Philip (BasicTrading)

Still Positive
Immediate Resistance is around 149 - 150.
Sustaining this level will move it towards
170.

EURJPY → Storming the resistance. Ready for the rallyFX:EURJPY is rising amid a stronger dollar and positive news about the de-escalation of the trade war. The currency pair is storming the resistance of the range.
The currency pair is forming a retest of resistance. A breakout and consolidation above 164.19 - 164.50 could support the market amid the dollar's growth.
The dollar is strengthening after positive news related to the de-escalation of the trade war. Against this backdrop, the Japanese yen is losing ground, which is generally affecting EURJPY.
A move above the key level will confirm a breakout of the resistance of consolidation, which could trigger a distribution phase...
Resistance levels: 164.19, 166.7
Support levels: 163.15, 162.38
The price has already entered the buying zone, meaning that resistance has been broken. All that remains is to wait for confirmation that the bulls are ready... Consolidation above 164.19 - 164.5 will confirm this, and in that case, we can expect distribution towards 166.7.
Best regards, R. Linda!

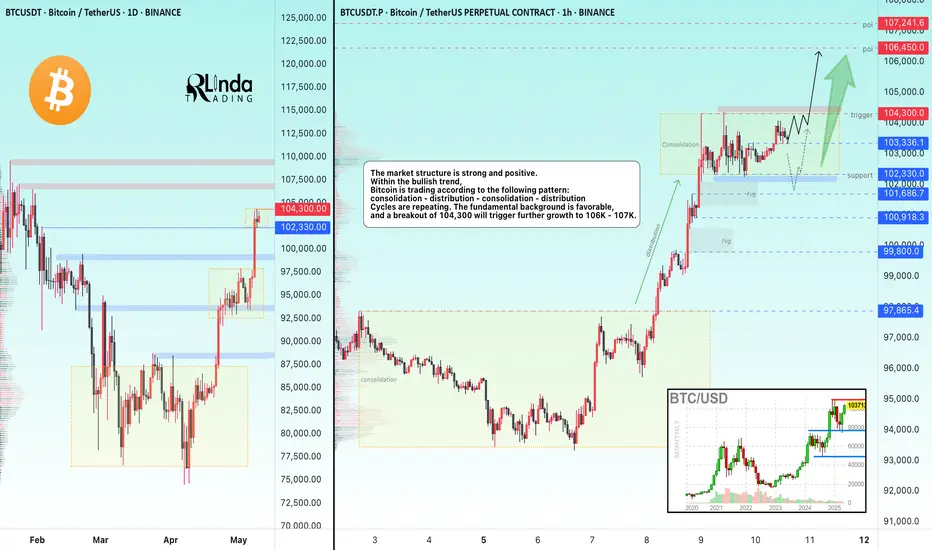
BITCOIN → Consolidation before the rally. 106K - 110K?BINANCE:BTCUSDT , after breaking out of consolidation at 97,860 and distributing to 104,300, has returned to a consolidation phase, which is generally a positive sign for possible continued growth.
The growth of Bitcoin is linked to several reasons:
General improvement in the global market situation — easing of trade conflicts; Expectations of a US Fed rate cut; Influx of investment into Bitcoin ETFs
Technically , we see the price breaking out of its local downtrend and entering a strong distribution phase. The northern train continues to pick up passengers.
At this stage, I would like to draw your attention to the consolidation at 104300 - 102300. A rebound from resistance is currently forming, and we need to monitor the levels of 103300 - 102300 - 101700. These are quite important areas of interest. A false breakdown (liquidity capture) may form before further growth. A return to resistance and the formation of pre-breakout consolidation, for example between 104300 and 103300, will only increase the chances of a breakout of resistance and growth to 106-107K.
Resistance levels: 104300
Support levels: 103300, 102300, 101700
The trend is bullish, with Bitcoin consolidating. The coin is not going to fall (at the moment), but to build up potential, the price may form a false breakdown of support (a deceptive maneuver) before continuing to rise. Retesting the 104300 level could lead to a breakout and upward distribution.
Best regards, R. Linda!
ETHUSDT Breakout & Retrace: Watching the $2,200 Buy Zone!Hey Traders,
In today's session, we're keeping a close eye on ETHUSDT for a potential buying opportunity around the $2,200 zone. After trending downward, Ethereum has successfully broken out of its downtrend and is now undergoing a correction. It’s currently approaching a key support/resistance area at $2,200, which could act as a strong retracement level.
As always, trade safe.
Joe
GOLD → Return to range. Fall from resistance...FX:XAUUSD is reacting to data related to the tariff war. The price is returning to the range and forming a false breakout of resistance. The level of 3370 and the zone of interest at 3387 play a key role.
On Thursday, gold rose to $3,400 amid a weaker dollar, increased demand for safe-haven assets, and continued uncertainty due to US trade policy and tensions in the Middle East and Ukraine. The Fed left rates unchanged and expressed caution in its assessment of the outlook, which also supports gold's rise.
However, in the European session, we are seeing gold react to the trade deal with Britain, most likely due to the easing of tariffs. Now the main focus is on the terms of the deal. We should not forget about China, where the situation remains tense, but everyone is waiting for a resolution.
Resistance levels: 3352, 3369, 3385
Support levels: 3319, 3269
The fundamental backdrop changes several times a day. At the moment, the situation is as follows: the rise of the dollar, the weakening of the tariff war, and the hawkish stance of the Fed may put pressure on gold. Therefore, I expect the decline to continue after a retest of 3370-3386. In this case, the target could be 3319.
Best regards, R. Linda!

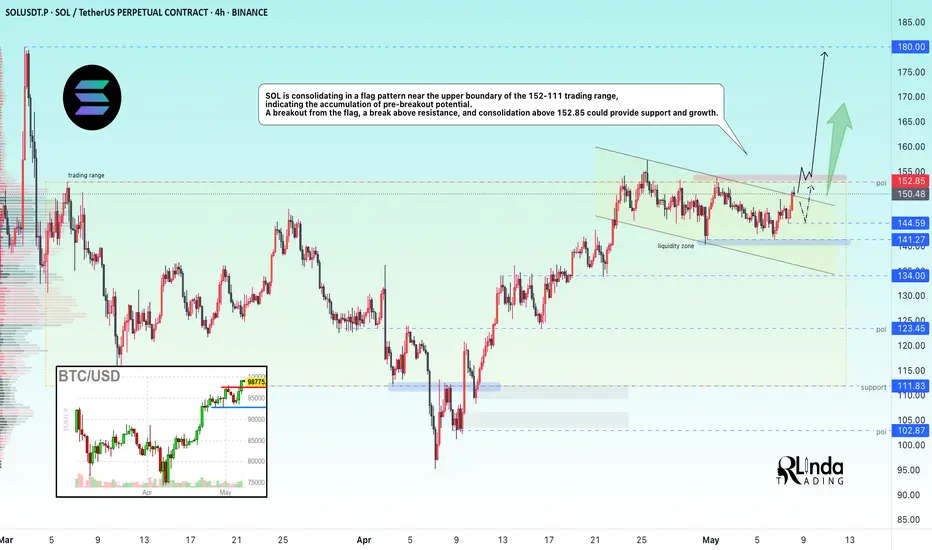
SOLANA → Resistance level and free zone for growth up to 180.0BINANCE:SOLUSDT.P is holding steady and consolidating near the resistance level of the global price range of 152.85–111.85. Thus, the market has signaled that it is in a positive mood. A trigger is ahead...
SOL is forming a flag consolidation near the upper border of the trading range of 152 - 111, which indicates the accumulation of pre-breakout potential. A breakout from the flag, a break of resistance, and consolidation above 152.85 could provide support and growth. The cryptocurrency market is reviving after yesterday's news and relatively positive data in the tariff war. Countries are gradually beginning to agree, which is generally supportive for the crypto market.
Resistance levels: 152.85
Support levels: 144.6, 141.2
A breakout of the resistance range of 152.85 and consolidation of the price above this level will confirm the readiness for further growth. Further on, there is a free zone and the price can easily reach 180.00.
Best regards, R. Linda!
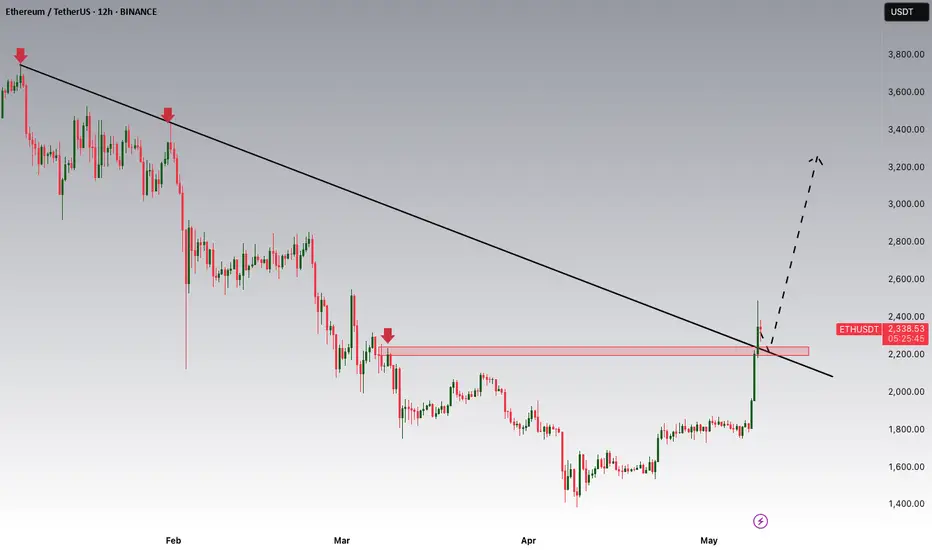
ETH BreakoutDown‑trend break
A sharp, high‑volume candle has punched through the descending trend‑line, giving a clear bullish break of structure.
Resistance → Support flip
The 2 100‑2 150 USDT band that capped price earlier is now a potential support zone. A brief retest that holds would keep the bullish scenario intact.
First objective: 2 500‑2 550 USDT
Liquidity sits there (horizontal line on your chart). It’s a logical partial‑take‑profit area.
Expected pullback
The arrow sketches a throwback toward 2 350‑2 400 USDT to form a higher low after the breakout.
Second objective: 2 800‑3 000 USDT
3 000 is a psychological level and aligns with a higher supply zone. If that breaks, the broader 3 300‑3 600 USDT grey box comes into play.
Invalidation
A 4‑hour close back under ~2 100 USDT or a move below the broken trend‑line would kill the bullish thesis.
The arrow shows a classic breakout → retest → continuation roadmap. As long as ~2 100 USDT holds, it’s a reasonable bullish path—but keep tight risk management in case the retest fails.

Why I'm Bullish on the DXY: A Fundamental Approach!Powell continues to take a cautious tone, emphasizing a wait-and-see approach while acknowledging rising inflation risks, which suggests there's no urgency to cut rates. This leans slightly hawkish, especially compared to the market’s more dovish expectations, and could support some near-term Dollar strength. However, a more sustained move in the USD likely hinges on progress in upcoming trade discussions—particularly with China. Today's FOMC outcome is just one part of the broader picture; the next key signal may come with developments in the coming days. For now, the bias remains USD bullish heading into the London session.
Technically, the DXY has broken its downtrend, signaling a potential shift in momentum. I’ll be watching for a possible retracement toward the 99.700 area, which could serve as a key support level before any further upside continuation.

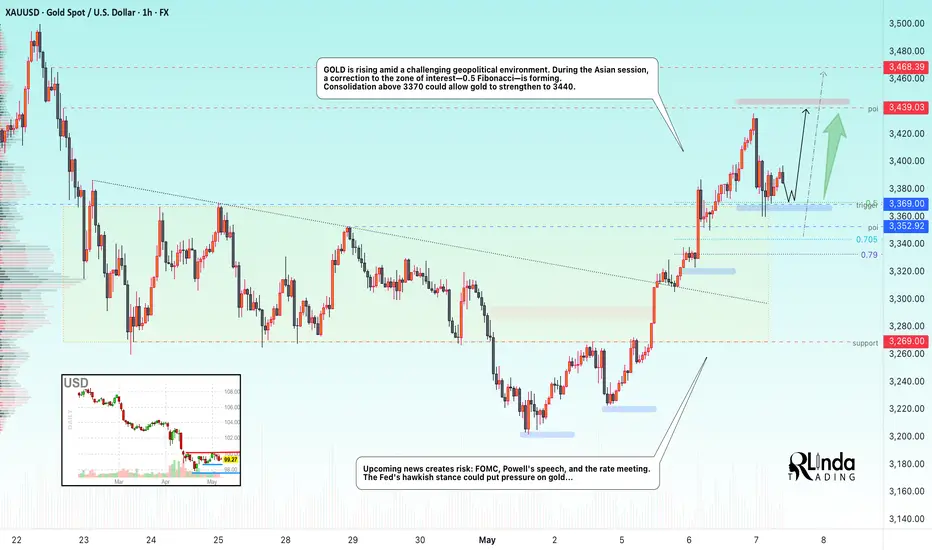
GOLD → The rally has given way to a correction. News aheadFX:XAUUSD is rising amid a challenging geopolitical environment. During the Asian session, a correction to the zone of interest (0.5 Fibonacci) is forming. The situation is quite complex and tense.
On Tuesday, the metal strengthened to 3433 due to tensions in the Middle East, but during the Asian session, gold fell sharply due to optimism surrounding the upcoming US-China trade talks, the strengthening of the dollar, and profit-taking ahead of the Fed's decision.
Investors are waiting for Powell's speech, which will determine the future of interest rate policy.
Despite the decline, gold is supported by ongoing geopolitical risks in the Middle East, Eastern Europe, and South Asia.
Theoretically, if the bulls keep the price above 0.5 Fibonacci, the growth may continue to 3439, as the price has not yet reached the liquidity zone.
Resistance levels: 3439
Support levels: 3369, 3352
However, unpredictable data could trigger a return of the price to the range and a correction to 3323-3300. Risk is posed by upcoming news: FOMC, Powell's speech, and the rate meeting. The Fed's hawkish stance could put pressure on gold...
Best regards, R. Linda!
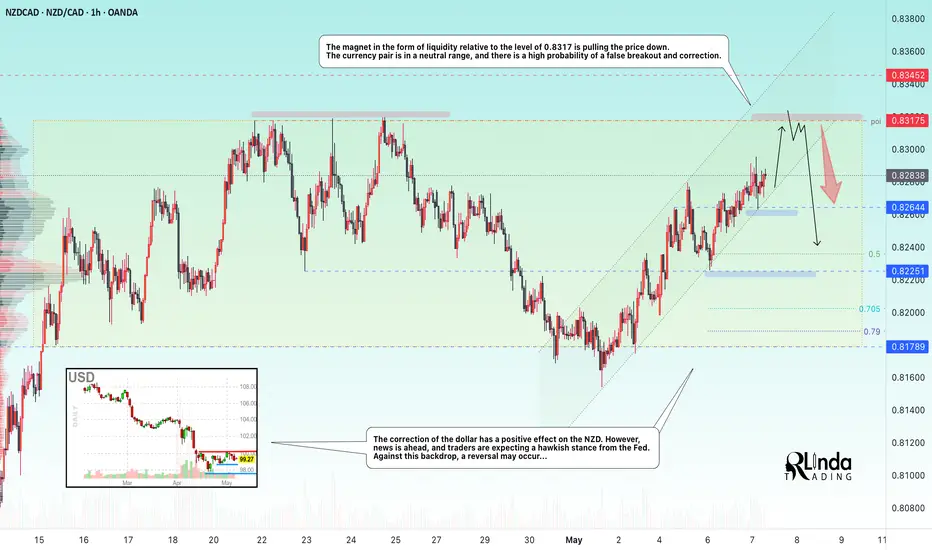
NZDCAD → Intra-range trading. Retest of resistanceFX:NZDCAD is strengthening within a neutral trading range. The currency pair is supported by the dollar's correction, but how long will this last? Ahead of us are the FOMC meeting and Powell's speech...
The focus is on the trading range within which the currency pair continues its local trend. Liquidity around the 0.8317 level is attracting the price. The correction of the dollar is having a positive effect on the NZD. However, news is ahead, and traders are expecting a hawkish stance from the Fed. Against this backdrop, a reversal may occur...
Since the currency pair is in a neutral range, there is a high probability of a false breakout and correction.
Resistance levels: 0.83175
Support levels: 0.82644, 0.8235, 0.8225
The liquidity zone is likely to stop the price (temporarily or reverse it). Further movement depends on fundamental sentiment, but based on rumors about the Fed's position, it is worth carefully analyzing what data the market will receive this evening. A tougher Fed policy or hints of one could strengthen the dollar and weaken currencies...
Best regards, R. Linda!
Nasdaq - Printing The Obvious Bottom!Nasdaq ( TVC:NDQ ) already finished the correction:
Click chart above to see the detailed analysis👆🏻
After we witnessed a minor "crash" of about -25% over the past couple of weeks, the bottom might be in on the Nasdaq. We simply saw another very bullish all time high break and retest and depite the possibility of a second retest, I am (still) extremely bullish at these levels.
Levels to watch: $17.000
Keep your long term vision,
Philip (BasicTrading)

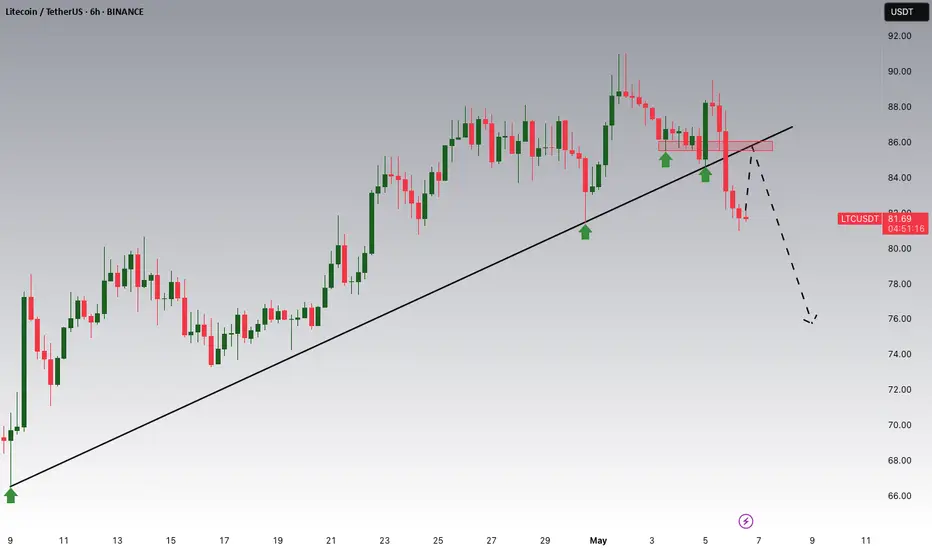
Litecoin Breakout And Potential RetraceHey Traders, in today's trading session we are monitoring LTCUSDT for a selling opportunity around 85 zone, Litecoin was trading in an uptrend and successfully managed to break it out. Currently is in a correction phase in which it is approaching the retrace area at 85 support and resistance area.
Trade safe, Joe.