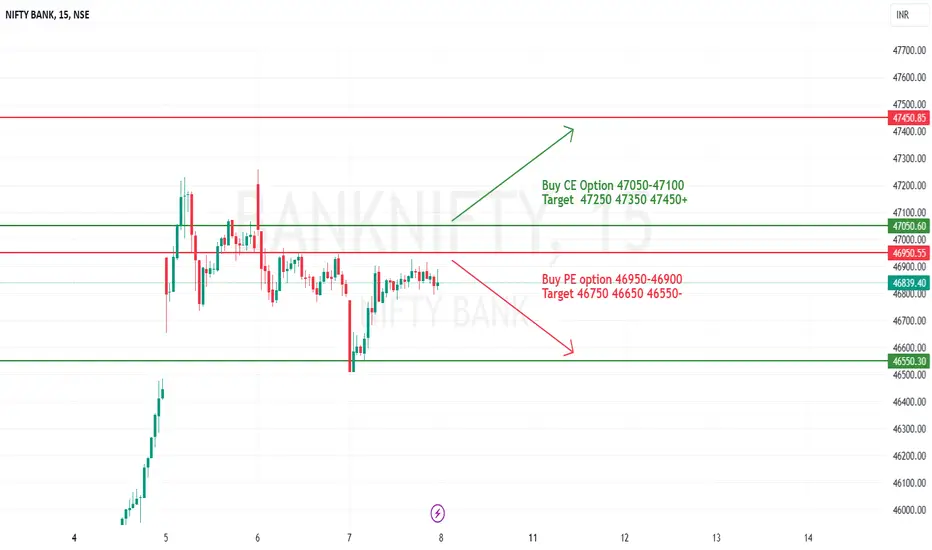
[INTRADAY] #BANKNIFTY PE & CE Levels (08/12/2023) Today will be FLAT opening in BANKNIFTY . After opening if banknifty start trading Below 46950 level then possible downside rally of 400-500 points upto 46550 Level.Any Major upside only expected in case banknifty starts trading Above 47050 level.
Trendpattern
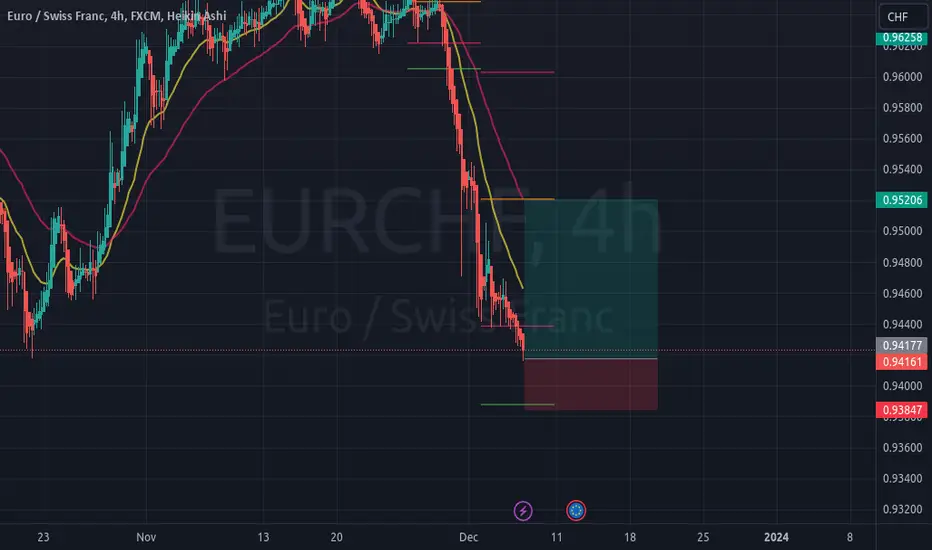
EURCHF - LONGEURCHF is currently lurking around a major support zone. Price could be pulling back up anytime soon to about 0.9520
#NIFTY Intraday Support and Resistance Levels -06/12/2023Nifty will be gap up opening in today's session. After opening nifty sustain above 20870 level and then possible upside rally up to 20990 in today's session. in case nifty trades below 20840 level then the downside target can go up to the 20720 level.

[INTRADAY] #BANKNIFTY PE & CE Levels(06/12/2023) Today will be gap up opening in BANKNIFTY . After opening if banknifty sustain above 47050 level then possible upside rally of 400-500 points upto 47450 Level. Any Major downside only expected in case banknifty starts trading below 46950 level.

#NIFTY Intraday Support and Resistance Levels -05/12/2023Nifty will be gap down opening in today's session. After opening nifty start trading below 20650 level and then possible downside rally up to 20530 in today's session. in case nifty trades above 19770 level then the upside target can go up to the 19890 level.

Infy - Retest, Basing, Momentum- Restest of 1st Trendline
- 0.5 retracement of the first wave
- Strong Momentum
- Enter Between 1500-1520, SL- 1420, T1- 1670, T2- 1820
- Major Resistance - Related to the event, Breakdown from base & Gap Down

BTC Daily Chart 27th November 2023Although there was a recent breakout above the horizontal 38K resistance line, COINBASE:BTCUSD was unable to maintain above this level. We can see on the daily and 4h chart that BTC has evolved into an ascending triangle.
Bullish scenario : An ascending triangle is usually a continuation pattern so more upside is possible if BTC manages to perform a (real) breakout above 38K.
In such a case the upper ascending channel trendline will be back in effect creating resistance around 39K and 40K (40K being a psychological resistance and stronger than 39K IMO).
Bearish scenario : If BTC doesn't stay above 37K it will dorp towards the lowest channel trendline which sits at 36-36,5K at the moment. If BTC has a breakdown from the ascending triangle we can see a further drop towards 32K for a retest (yes, I still haven't given up on the retest :-).
On a longer timeframe, as long as we stay above 32K, the bullrun stays valid.

WTI A+ set upWith the inverse head n shoulder and 8 hour bullish divergence still in play, price dropped to both trendline support during NY open. With this set up, it looks promising to tap the upper trenline as you can see in chart.

Deciphering the Charts: A Closer Look at BTCUSDT's FutureD ear TradingView Community,
B efore I delve into the analysis, it's important to note that I do not consider the current price level as the optimal entry point for a short position. While this prediction suggests a bearish outlook, the ideal entry points lie closer to the horizontal red dotted line. The suggested entry points are specific to my risk appetite, and your approach may differ. Even if you find merit in this prediction, your choice of entries, target prices, stop loss, trail profit parameters, and other safety measures should align with your individual risk tolerance. It's essential to understand that past performance does not guarantee future results.
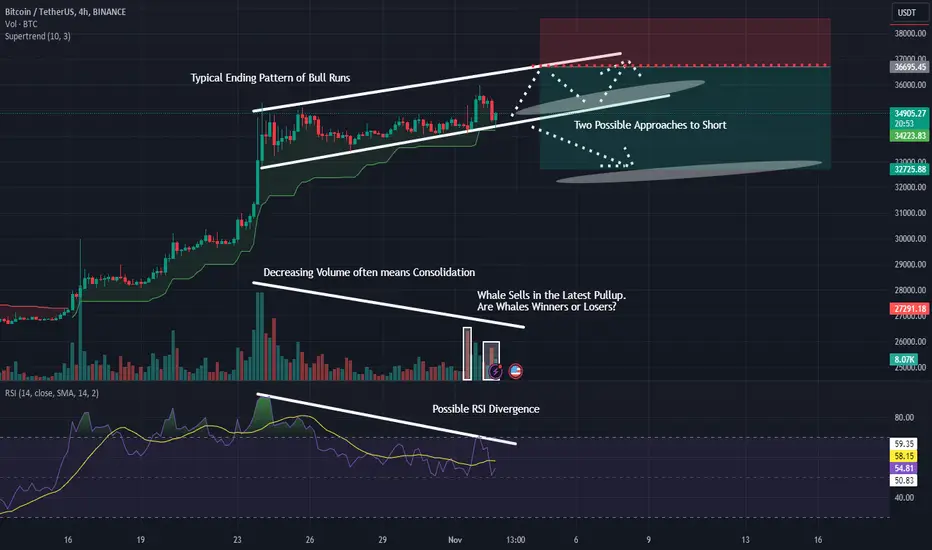
I share a medium-term perspective with the community. This prediction is subject to short-term fluctuations, and its outcome depends on various technical factors aligning. Our AI system, drawing insights from deep neural network analysis, has identified the potential emergence of a bearish chart pattern known as a "rising" pattern, which often marks the end of bullish trends.
S o, what technical indicators support the idea of a bearish rising pattern?
Notably, the volume has consistently decreased between October 24th and November 2nd, suggesting a period of consolidation or more. Historical data indicates that volume patterns often coincide with the conclusion of trends. In this case, the volume indicator implies that the recent bullish trend may be nearing end. It underscores the significance of the volume indicator in relation to channel pattern analysis.
A dditionally, on November 1st and 2nd, there were significant transactions, often referred to as "whale transactions," across major exchanges' spot BTC-USDT markets, primarily involving Bitcoin sales. The red candles in the transparent white boxes on the volume section of the chart represent these selling activities. While I avoid making hasty judgments, some theories in the crypto trading community suggest that whales tend to impact smaller traders. I present this information without taking a stance on the principle, but for those who find it relevant, it's worth considering.
T o illustrate this analysis, I've chosen to use 4-hour candles known for providing a balanced representation that minimizes market noise, making them suitable for weekly or even daily positions. Our AI system has outlined two potential scenarios for future price movements. The price could find support from the current trendline (represented by the bottom white line), leading to continued consolidation, as depicted by the top dotted white arrow. Alternatively, should the mentioned support break, it could pave the way for a more substantial decline, with the bottom dotted white arrow signifying the potential target price. Both scenarios complement our bearish perspective, with the top arrow indicating consolidation before a downturn and the bottom arrow visualizing a more direct fall.
W hile various indicators, such as Relative Strength Index (RSI) divergence, align with the potential scenarios depicted on the charts, it's essential to recognize that this pattern is unconfirmed. There's a chance that we may witness entirely different developments in the coming months. Therefore, I advise a cautious approach safeguarding your existing funds rather than aggressive day trading. Your financial security should always be your top priority.
tl;dr
Position: Short
Current Trend: Bullish
Upcoming Trend: Potentially Bearish
Indicators: Volume Consolidation, Whale Transactions, Rising Supports and Resistances, RSI Divergence
Important: This might not be the best entry. Don't forget your stop loss and trail profit if you decide to put any positions.
Warmest regards,
ELY
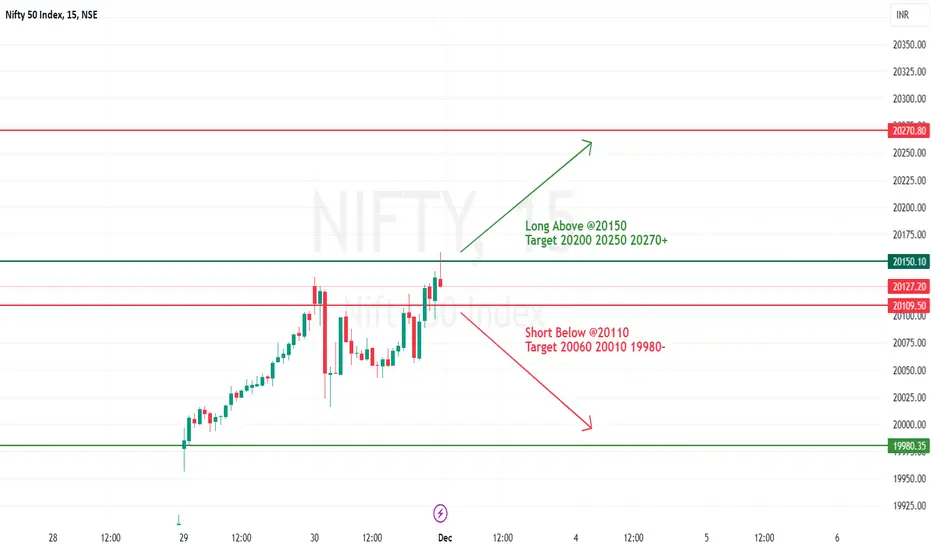
#NIFTY Intraday Support and Resistance Levels - 01/12/2023Nifty will be gap up opening in today's session. After opening nifty sustain above 20150 level and then possible upside rally up to 20270 in today's session. in case nifty trades below 20110 level then the downside target can go up to the 19980 level.
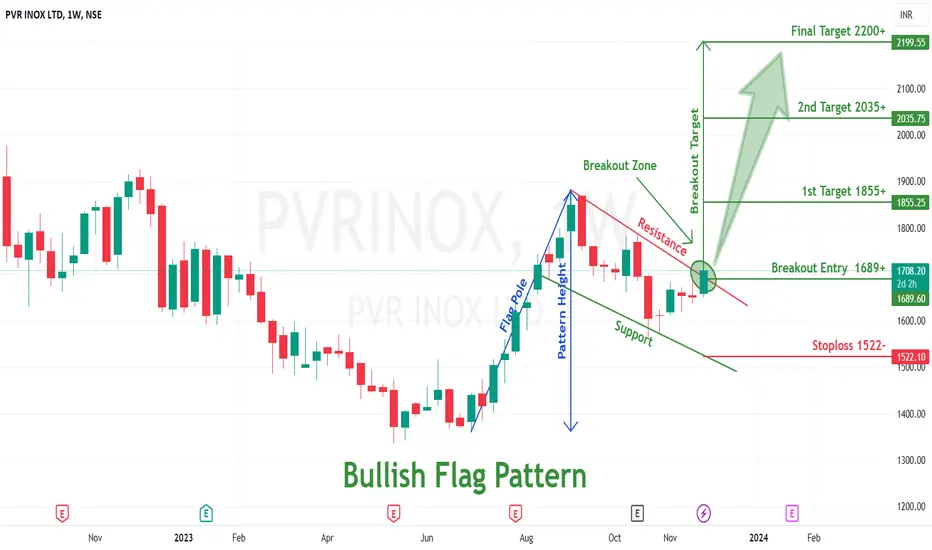
Bullish Flag pattern breakout in PVRINOXPVR INOX LTD
Key highlights: 💡⚡
✅On 1Week Time Frame Stock Showing Breakout of Bullish Flag Pattern.
✅Strong Bullish Candlestick Form on this timeframe.
✅It can give movement up to the Breakout target of 2200+.
✅Can Go Long in this stock by placing a stop loss below 1522-.
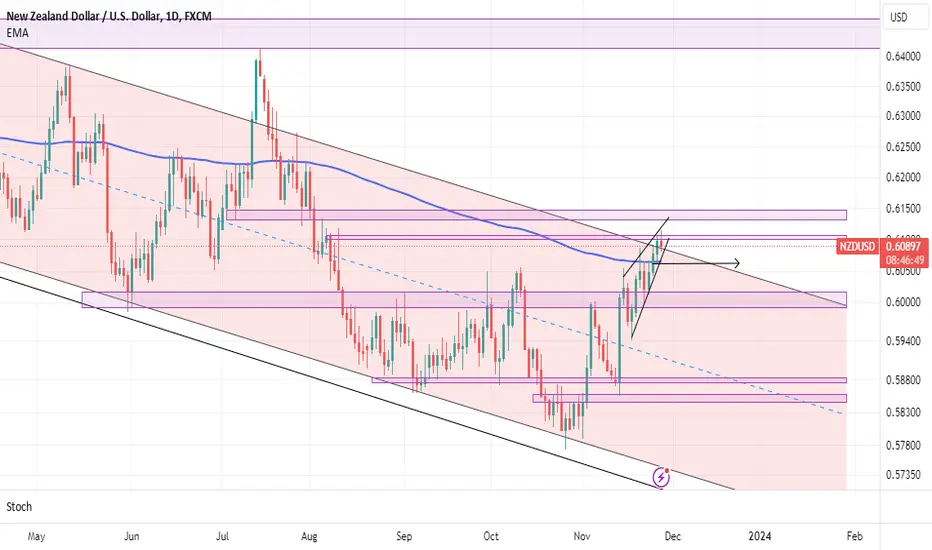
#NZDUSD bearish possibility move We can see price reaching out to the daily timeframe bearish channel upper line, which potentially can act as resistance for the price.
Additionally, we can spot the formation of a rising wedge pattern in the chart, which is intrinsically bearish and is regarded as a reversal formation in an uptrend.
Another factor indicating the loss of bullish momentum is the decrease in cycle amplitude . A decrease in cycle amplitude in an uptrend is an early indication that there may potentially be underling weakness. (use 4 hour time frame chart for this.)
Moreover, we have a static resistance area that previously acted as support and resistance for the price, making it an important area to observe for price reactions.
It's crucial to note that any breakout from the upper side of the rising wedge pattern or the bearish channel would invalidate this analysis.
For taking a position any breakout from below the rising wedge or changing market structure in 4-hour time frame could give us the entry trigger.
If you've found this analysis helpful, please take a moment to like, comment, or share your thoughts with me.
Head & Shoulder pattern breakout in M&MMAHINDRA & MAHINDRA
Key highlights: 💡⚡
✅On 1Day Time Frame Stock Showing Breakout of Head & Shoulder Pattern.
✅Strong Bullish Candlestick Form on this timeframe.
✅It can give movement up to the Breakout target of 1715+.
✅Can Go Long in this stock by placing a stop loss below 1545-.

#NIFTY Intraday Support and Resistance Levels - 29/11/2023Nifty will be gap up opening in today's session. After opening nifty sustain above 19920 level and then possible upside rally up to 20050 in today's session. in case nifty trades below 19890 level then the downside target can go up to the 19770 level.

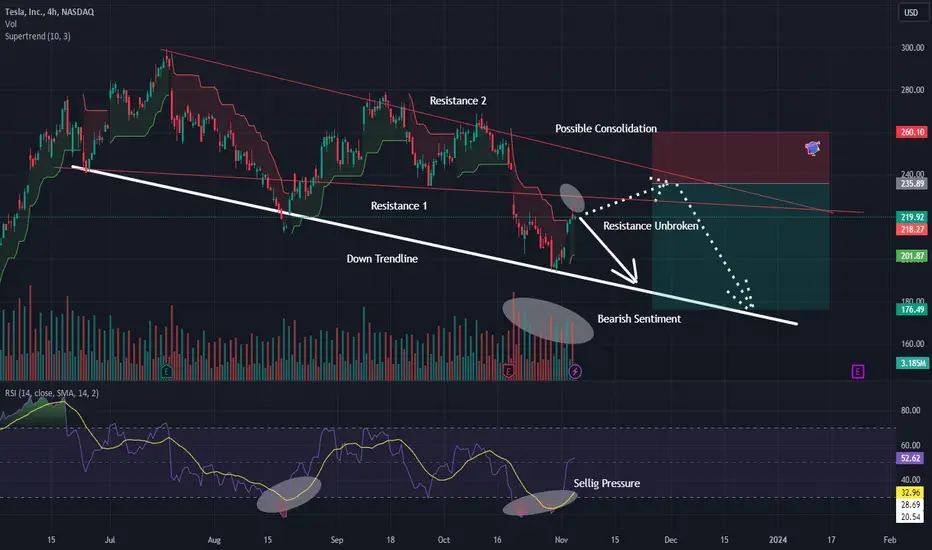
AI-Driven Analysis: TSLA's Possible Outlook and Tactical EntriesDear Esteemed Members of the TradingView Community,
I n our continuous pursuit of precision, we've harnessed the analytical power of cutting-edge AI technology, utilizing a harmonious blend of Autoregressive Integrated Moving Average (ARIMA) and Seasonal Decomposition of Time Series (STL) methodologies to decode the market trends from June 26, 2023, to November 4, 2023.
O ur AI indicates a prevailing bearish sentiment in this time frame, which traditionally corresponds to a sequence of lower lows. The chart exhibits a prominent white trendline, gracefully outlining the descending support trajectory of this bearish trend and pinpointing potential regions for the emergence of new lower lows. Should this trendline remain intact, a target price range for short positions spans from $175 to $195.
F or those contemplating entry into a short position, we suggest closely monitoring the nearest resistance levels. In bearish trends, historical support levels often transition into formidable resistance points. To map these potential hurdles, the AI has nimbly employed the K-Nearest Neighbors (K-NN) algorithm, highlighting two key resistance zones: "Resistance 1" and "Resistance 2." Resistance 1, marked by the vibrant red line, stands as the immediate barricade, while Resistance 2, also vividly red, awaits in the wings should Resistance 1 be breached. These insights have inspired us to craft two scenarios for your strategic consideration.
I n Scenario 1, we envisage Resistance 1 rejecting the price action, ushering in a descent towards the coveted target price zone. In Scenario 2, an alternate narrative unfolds, where the bulls surge past Resistance 1, eventually carving out a consolidation phase between the two resistance lines. Ultimately, this tactical hiatus is followed by an ebbing of market enthusiasm, permitting the anticipated descent into the target zone.
A perceptive examination of the volume reveals an uptick in selling pressure on TSLA, commencing on October 17, 2023. The red volume candles in the white circle signify an influx of market sell transactions, surpassing the norm. This pattern aligns with a prevailing bearish sentiment, setting the stage for a potential decline in keeping with our bearish expectations.
W hile on the indicators, the Relative Strength Index (RSI) appears. It's a tool often wielded together with others by seasoned traders. Although we've already discussed various indicators, it's worth casting an eye over the RSI. The RSI is signaling a persistent selling inclination in the market, displaying no discernible signs of waning. When considered in conjunction with the volume data and AI-derived insights, it further bolsters the case for impending bearish continuations.
tl;dr version:
T o sum up, here's a snapshot of the elements of our analysis:
Position: Short
Trend: Bearish
Entry: Near Resistance 1 or Resistance 2 (depicted in red)
Target Price Zone: $175-$195
Stop Loss: Positioned above the noted resistances
Indicators: ARIMA, STL, K-NN, Volume Candle Analytics, Trendline Analytics, RSI
H owever, please be mindful that this analysis is not an investment advice. Past performance is not indicative of future results. The trading parameters should be in line with your unique risk tolerance. It's crucial to undertake your individual research and remember to implement a range of safeguards, such as Stop Loss, Trail Profit, Target Price, Trade Timeout, and Liquidity Check. The ever-fluctuating market can often spring surprises, venturing into scenarios that may differ significantly from those outlined in this analysis.
Warm regards,
Ely
Managing Positions with Parallel ChannelVideo tutorial:
• How to identify downtrend and uptrend line
• How to draw parallel channel correctly
• Confirming a change in trend (using trendline itself)
• Managing positions with parallel lines
- Profits
- Risks
- Knowing its volatility
Micro Natural Gas Futures & Its Minimum Fluctuation
0.001 per MMBtu = $1.00
Code: MNG
Disclaimer:
• What presented here is not a recommendation, please consult your licensed broker.
• Our mission is to create lateral thinking skills for every investor and trader, knowing when to take a calculated risk with market uncertainty and a bolder risk when opportunity arises.
CME Real-time Market Data help identify trading set-ups in real-time and express my market views. If you have futures in your trading portfolio, you can check out on CME Group data plans available that suit your trading needs tradingview.sweetlogin.com

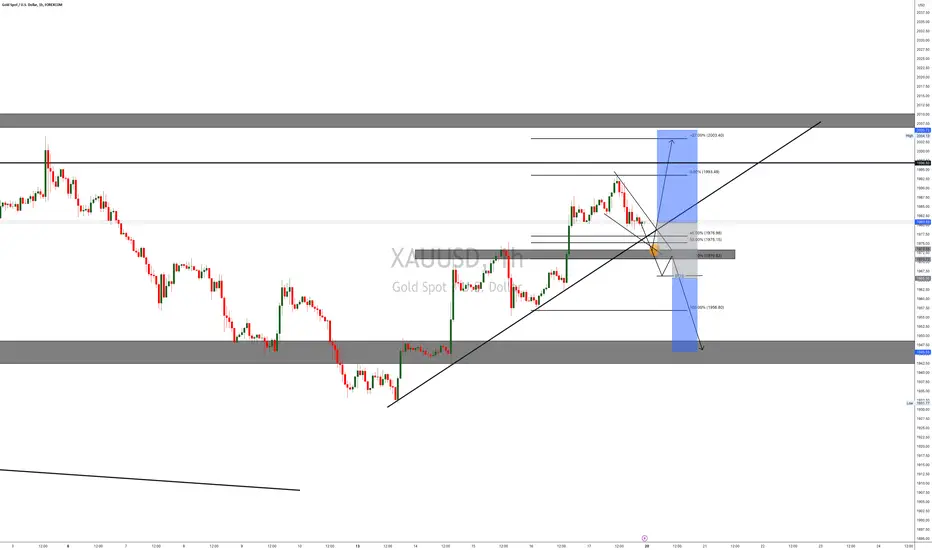
BUY TRADE SETUP ON XAUUSDHey Traders,
Check out this technical analysis on XAUUSD.
Gold is currently trading with bullish momentum, so anticipate a retest of the broken resistance level and consider entering buy positions.
Keep a close eye on this; it could play out in either direction.
EURGPB STILL HOLDING OUR BULLISH ORDER FLOW EURGBP Triggered sell stops after new impact run the lows for momentum to be stabilized upwards. This is how important to keep note of news regardless to your stoploss


[INTRADAY] #BANKNIFTY PE & CE Levels(21/11/2023) Today will be gap up opening in BANKNIFTY . After opening if banknifty sustain above 43550 level then possible upside rally of 400-500 points upto 43950 Level. Any Major downside only expected in case banknifty starts trading below 43450 level.

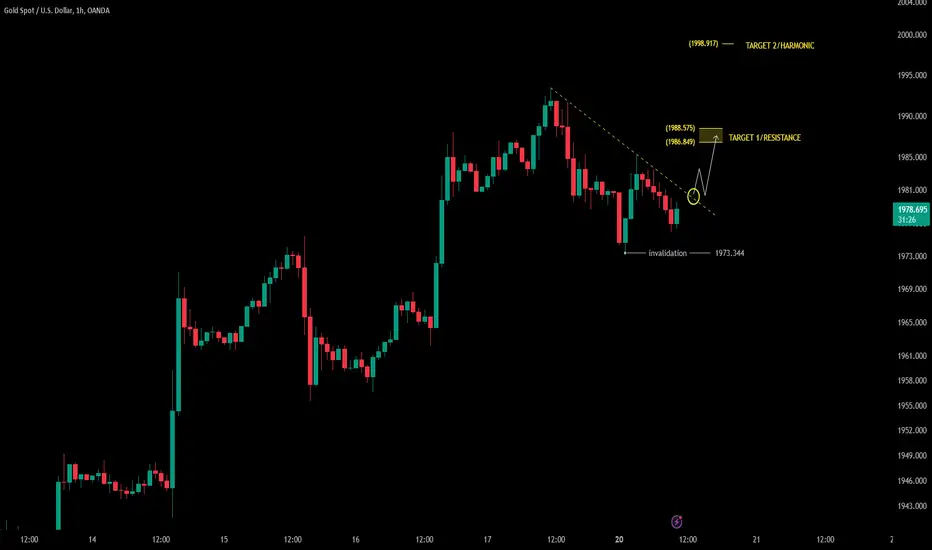
GOLD: Potential bullish consolidationFrom a technical perspective, if Gold triggers trendline breakout, another bullish consolidation is possible, and the price should approach the resistance area in the short term. At the same time, if the swing manages to maintain a support area, we do not exclude the development of a harmonic structure with a target around 2,000. At the moment, we are still below the trendline.
Trade with care
Like | Share | Comment
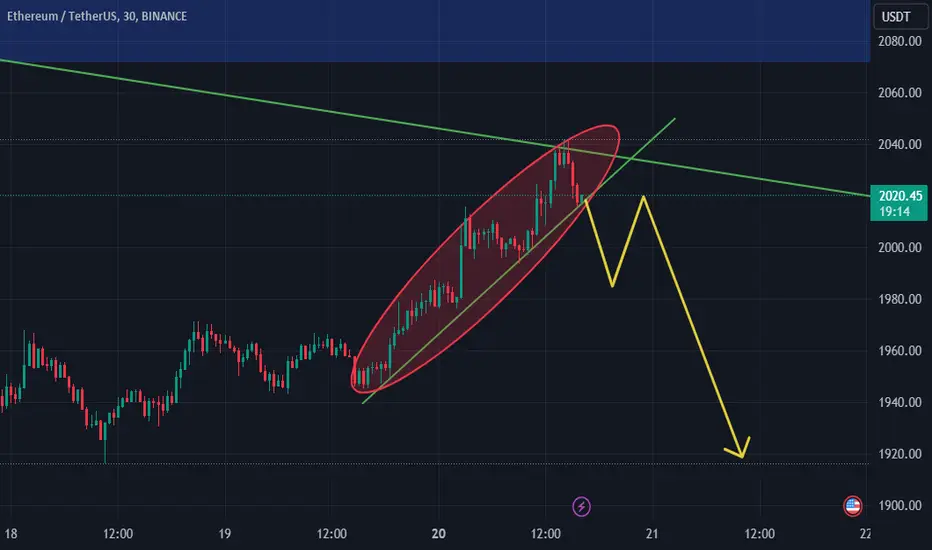
ETH/USDT bearish weekly trendGiven that Ethereum is moving inside a triangle on the weekly time frame, I expect Ethereum to be completely bearish in the coming week.
In addition, you can enter good sell positions after the break of the specified microtrend
Reversal Candidate Strong Reversal Candidate!
GOCLCORP
1- Stock Bouncing off Demand Zone
2- 50-SMA Acting Dynamic Support
3- Recent Swing Will Act as Invalidation Level.
Keep on Radar.
Potential Upside Candidate!
#stocks #trading #investing
