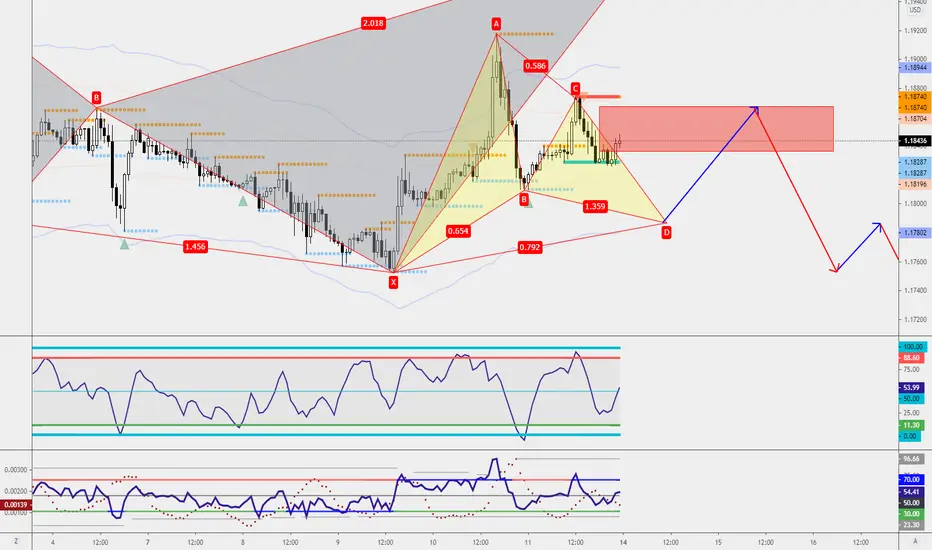
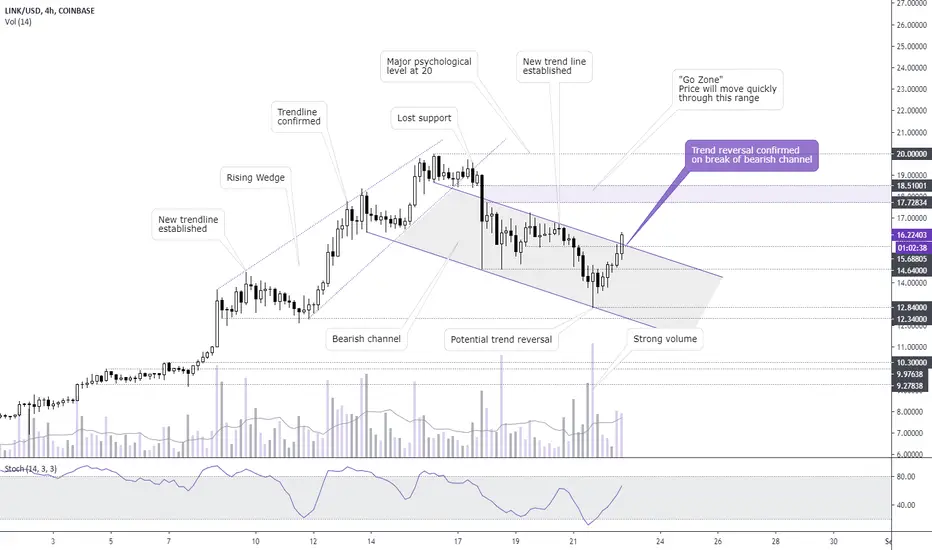
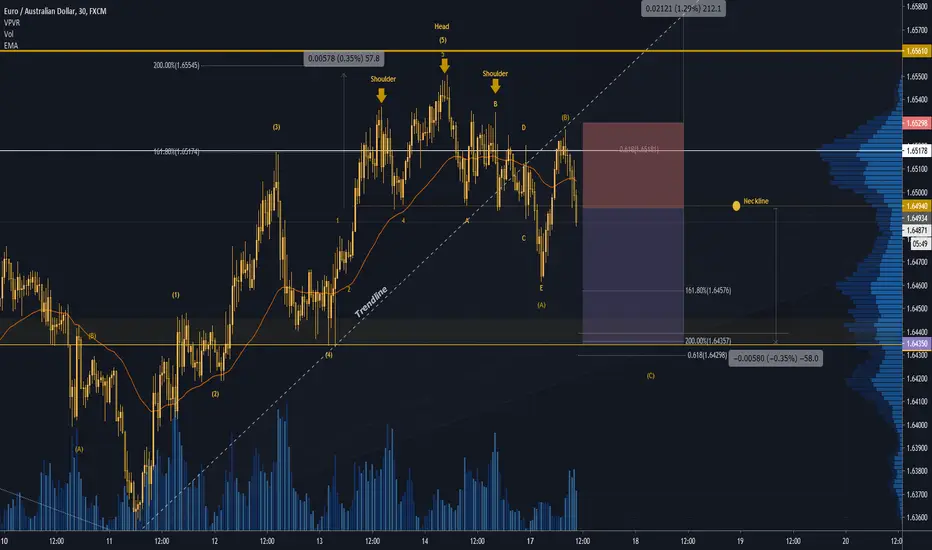
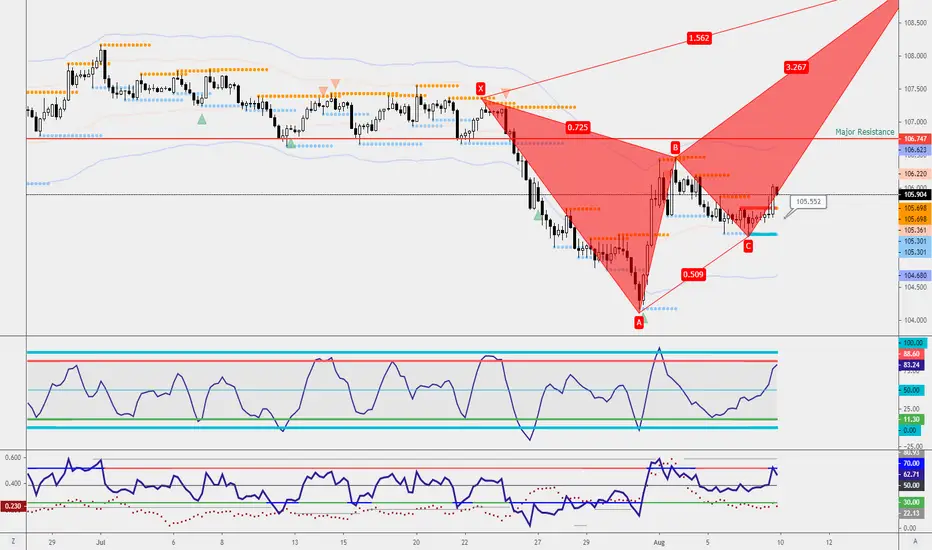
EURUSD-Weekly Market Analysis-Sep20,Wk3This week I'm looking for a trend reversal/ counter-trend trading opportunity on the EURUSD. In short, I'm looking for a selling opportunity. Even when there is a potential Bullish Gartley in play, I'm looking for the shorting opportunity after it has hit its target area(red box).
Trendreversal
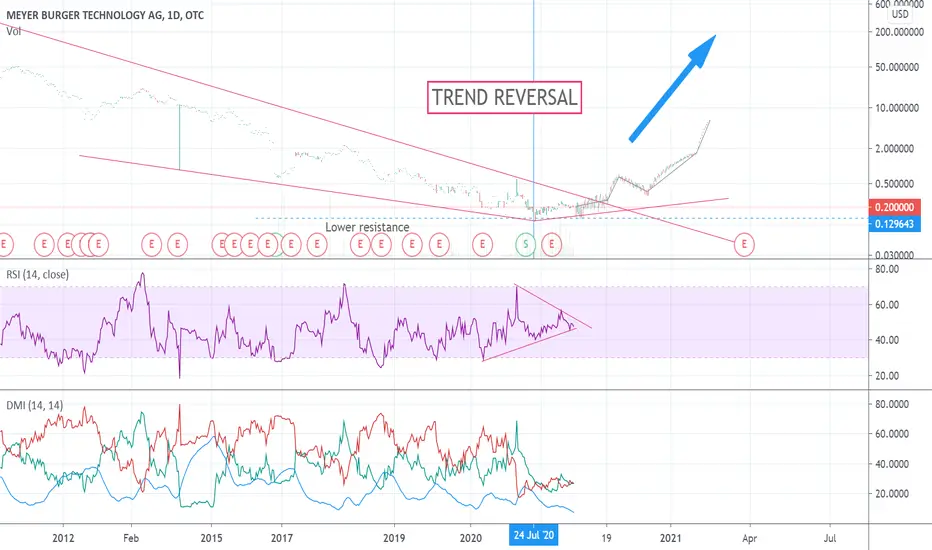
Bottomed out, trend reversal?Did we just see a trend reversal of the Swiss Company Meyer Burger.
The Company just announced, that they will produce solar panels in Germany.
A brave decision.
Having a look in the history, we saw an overall trend in Europe. Solar production companies started in the 2010s, but failed to succeed due to the strong Asian competitors and cheap production conditions.
The current situation and thoughts to bring back local production could lead to an success.
The history of the stock shows a fall from 358 Doller to 20 Cent.
The change of energy sources away from coal could lead this current penny stock back to a proper stock.
The future will show the potential!
EURUSD - Chart went up nicely today as expectedLooks like we got ourselves a nice bullish jump as expected.
1D: For now we see a comeback to the ascending trendline that start on may 14th. For now today's and yesterdays candle stick patterns combined seem to show a trend reversal. Why? because today was a good day and markets we're pushing prices up, but also because the candlestick pattern shows us a 'piercing line' which is a possible trend reversal signal. Let's see where we're standing tomorrow.
Also checkout my previous TA linked below for a multiple timeframe analysis.
Trade safe, stay safe!
______________________________________________________________________________________________________
I'm purely a beginner in technical analysis . Please hit like, follow if you like my ideas or place a comment if you wish.
Any of your feedback is my motivation to keep going and to learn more about Technical Analysis!

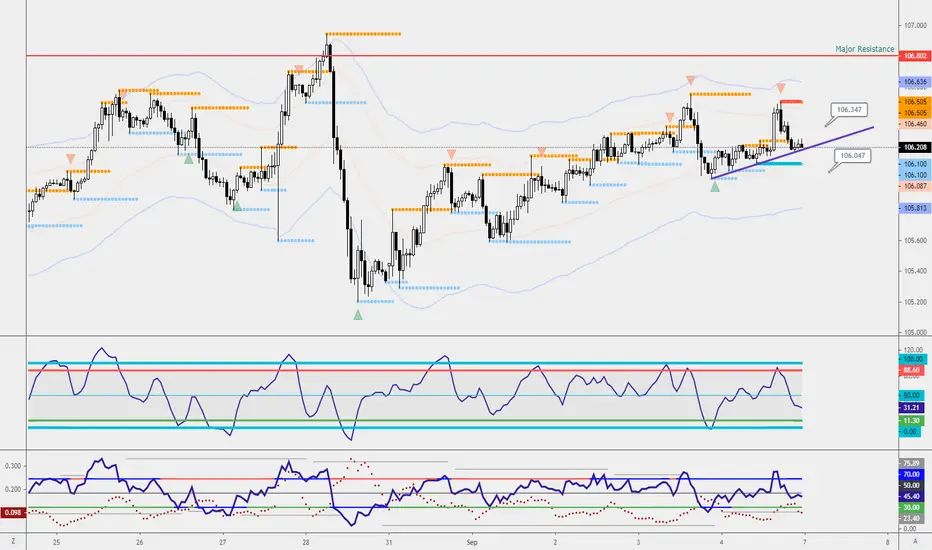
USDJPY-Weekly Market Analysis-Sep20,Wk2This trendline will be the deal-breaker if the market didn't break and close below the trendline, I will be waiting for a buying opportunity as a counter-trend or even a trend reversal trade. However, if the market break and close at 106.04 or lower, I will be waiting for a retracement back to 106.34 to look for a shorting opportunity for this trend trading opportunity.
Reversal of H1 TrendWe are looking at USDCAD on H1.
We have higher bottoms and higher peaks. These are the signs of forming a new trend.
When a trend is in its beginning, it is much more likely to continue. Therefore, we will look for opportunities to enter buys.
What we have to take into account and be especially careful today is that it is the first Friday. I guess it's clear to everyone what this means - big job movements in both countries.
The news comes out at the same time and we expect to see a big movement. Therefore, you MUST place a stop loss!
You can choose to enter a trade after or during the news. This will reduce the risk, but it is possible to miss a lot of movement!

$FSLY Daily H&S $SPY $SPX $AAPL $NET -- the $FSLY daily chart looks like it may be showing signs of reversal with this pretty clear h&s + TRIX bear cross nearing -- might be a good short entry very soon :D
USDCAD AT HUGE DAILY SUPPORTI expect to see a bit of congestion around this level of 1.30000 but we are only just coming into it now. Ill be looking for longer term buy trades but not just yet as its not very often we see price spike into these major levels and change direction that quickly.. most traders should know these levels, so do big institutional traders (big banks) and that is where they take advantage of the average. I am starting to talk to far into the future now, but often on big term reversals from these major levels we will see price develop a nice buy trade and give all the right signals but then make a final push down back through the level taking out a heap of stop losses then quickly changing direction into original bias...

EURCADEURCAD has been creating a wedge, currently did not create lower low, but double bottom with divergence on the support zone + harmonics pattern that's currently consolidating in the zone. I am waiting for a break of structure, retest of EMA 20(pink) and rejection.

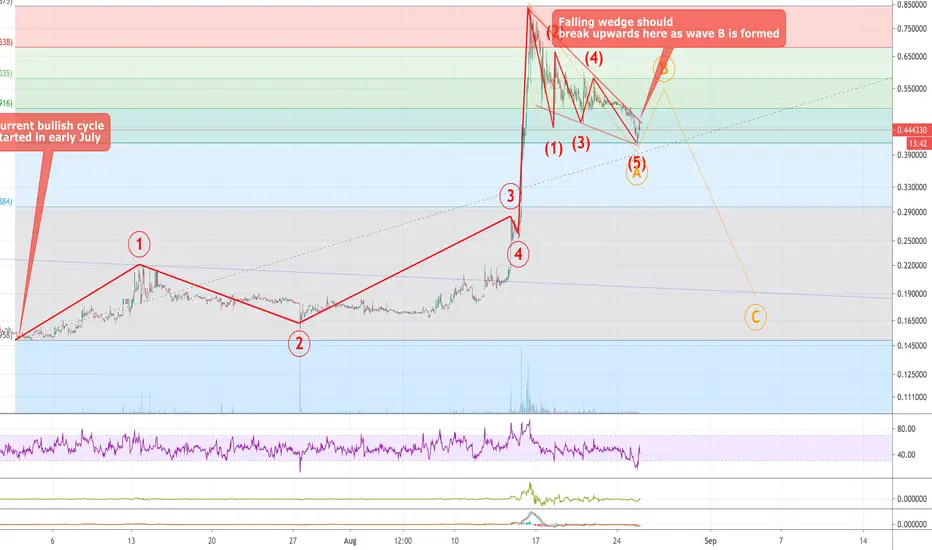
Trading OXT: Has topped & headed for full retraceDisclaimer: This is not financial advice
High leverage trading is all about entries, you need to have patience and to not let fear of missing out drive you into opening rushed positions. Map out your trades in advance and wait for the right entry. Our aim is to capture quick & safe profits, not to predict the future, this is possible only if we plan ahead and wait for a good entry. So if you're nervous and itching to open a position then take a few deep breaths and don't trade!
OXT seems to have just completed a bullish impulse wave that started on July 2nd and has finalised corrective wave A at exactly the 61% Fib level. For those unfamiliar with Elliott terminology, A is the first wave of an ABC correction. B is next, which also seems to have started. We will have a confirmation of this as soon as we break out of the wedge marked by the red lines. The first target for B wave is the 50% Fib level (0.49), this is a good spot for some high leverage shorts. Shouldn't it hold then the next level 31% Fib level at $0.579. Once wave B is completed then wave C should started. The target for wave C, estimated based on how deep A has been, is around 0.168. This means that should the current formation (which I plan to trade) be confirmed then the price should almost fully retrace the gains achieve since July 2. Right now I will wait for wave B to form and will be looking for shorts in the 50% Fib area first and 32% next.
Entry: 0.49 SL: 0.54 TP1: 0.30 TP2: 0.18
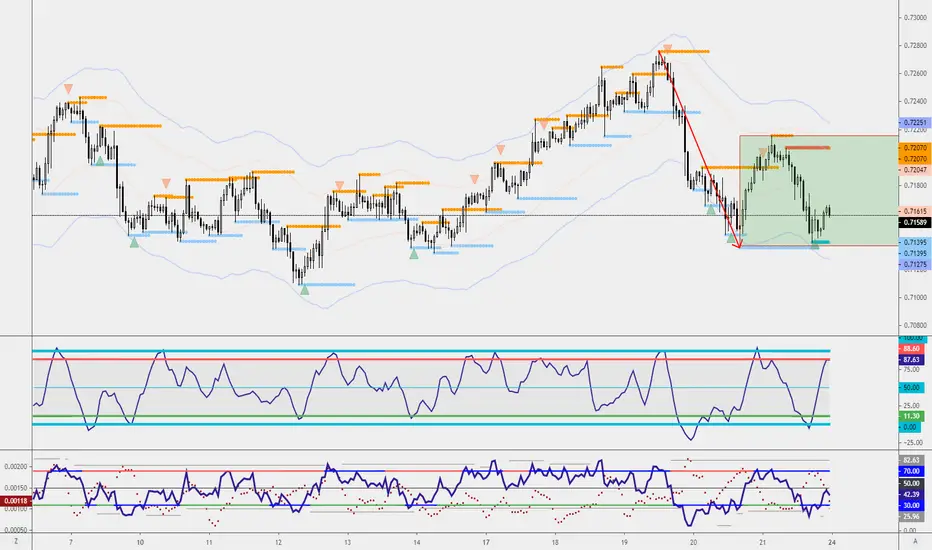
AUDUSD - Bearish Flag (23 Aug 2020)Waiting for a retest of the support level at 0.7147 to look for a long opportunity. If the market hit 0.7209, I'm looking at bearish flag pattern trading opportunity as a trend-reversal trade setup.
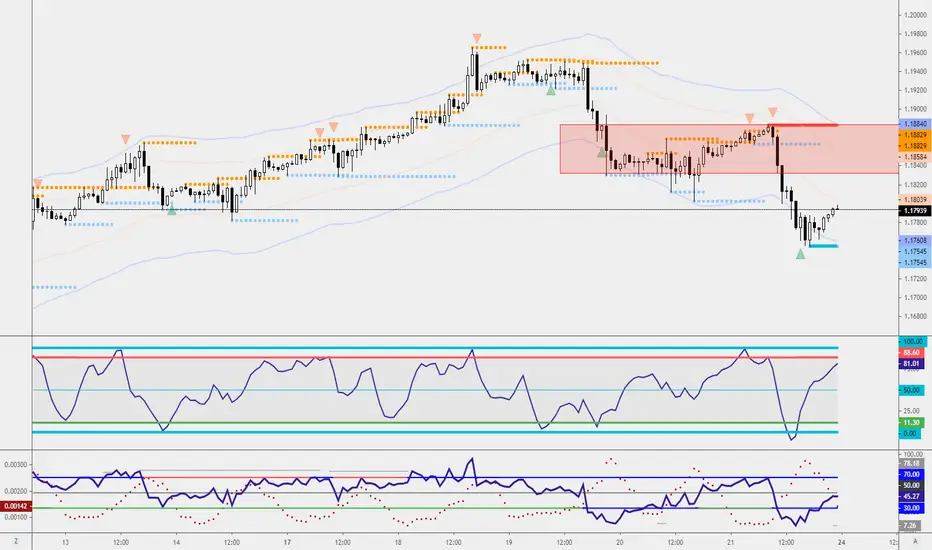
EURUSD-Weekly Market Analysis-Aug20,Wk4Waiting for a shorting opportunity within the sell zone, this will be a trend reversal trade I'm looking to engage as the Daily Chart shows RSI Divergence.
It could be as simple as a retest of previous support level turn resistance or a bearish bat pattern form within the sell zone to engage the trade.
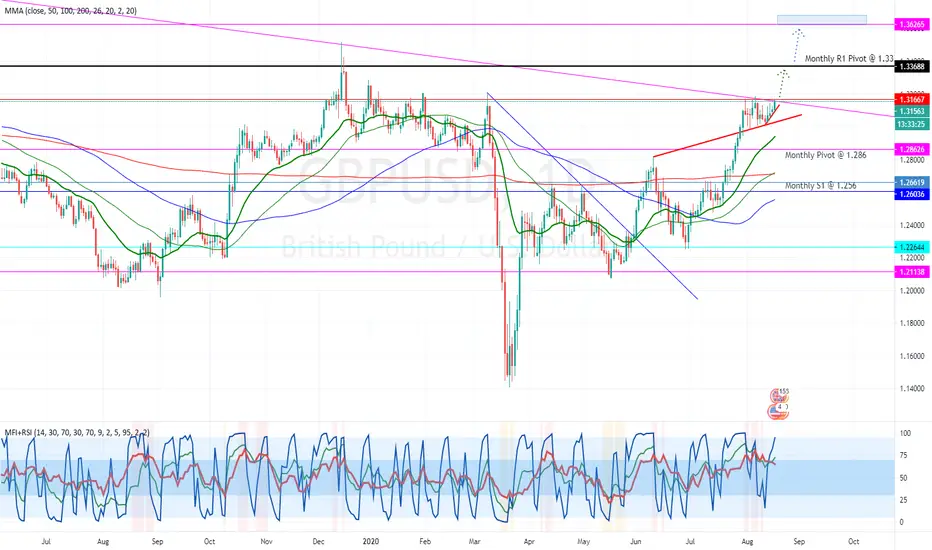
Trend reversal for GBPUSD?Long Trade Idea for GBPUSD. We have arrived at the edge of the diagonal bearish trend-line going back as far as early 2018. If we break here it will be the start of a new bullish trend with more dollar weakening to be expected in the medium to long term. Initial bullish targets will be at the Monthly R1 @ 1.336 with a medium a term target closer to the Monthly R2 @ 1.362. The final target would be in the region of the Yearly R1 pivot @ 1.385. Initial stop loss to be placed @ 1.308
EUR/AUD SELL SIGNAL Hey tradomaniacs,
welcome to a new free trading-setup.
Notice: This is meant to be a preparation for you! As always we will have to wait for a confirmation!
EUR/AUD: Daytrade-Preparation
Market-Sell: 1,64930
Stop-Loss: 1,65300
Take-Profit: 1,64350
Stop-Loss: 37 pips
Risk: 0,5 % - 1%
Risk-Reward: 1,60
LEAVE A LIKE AND A COMMENT - I appreciate every support! =)
Peace and good trades
Irasor
Wanna see more? Don`t forget to follow me.
Any questions? PM me. :-)
false breakout reversalprice broke out and failed to close above the previous structure which give us a signal to go short.

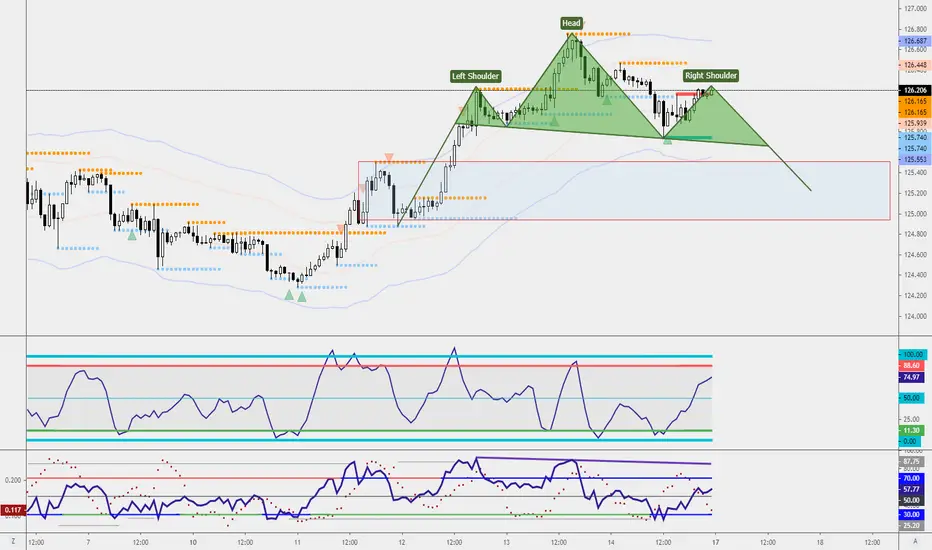
EURJPY - Head and ShouldersCan't wait for market to open and I'll dive in for a shorting opportunity on this head and shoulders setup. EURJPY may collapse beyond the head and shoulder setup as the RSI Divergence is spotted on the daily chart which may be the start of a trend reversal setup.
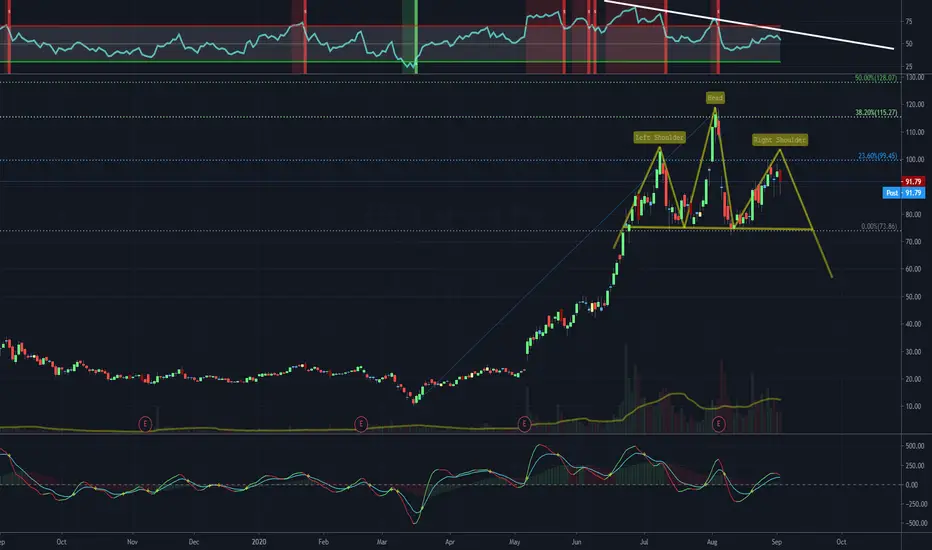
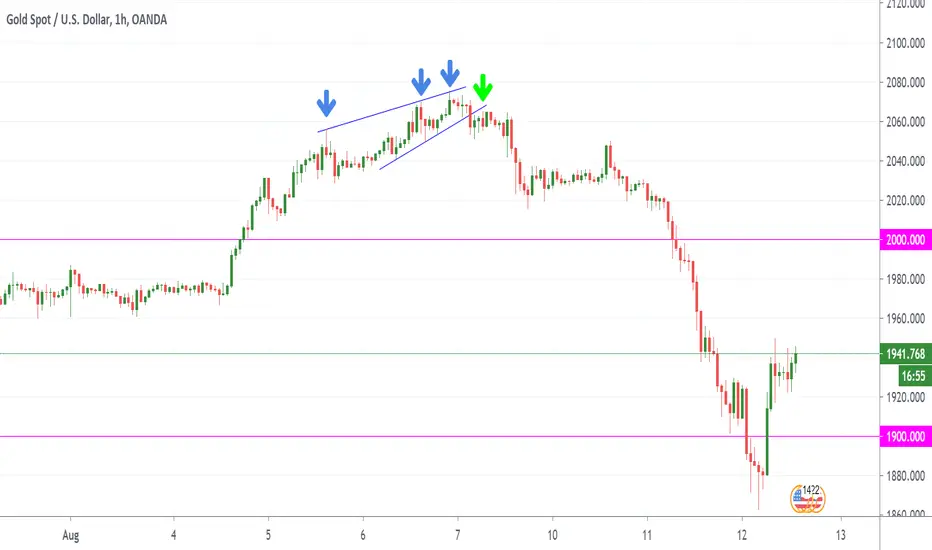
GOLD - Using price patterns to time reversals of trends.With the market watching out for Gold to hit the $2000 level, once this occurred and broke higher you have to always be cautious and take a step back before jumping into any longer term trend continuation plays.
When new record highs or lows get established in any market that is highly liquid, its good to keep your options open and try and look at the market with also a contrarian point of view as well.
To many new and novice traders will just expect prices to keep climbing and jump into the move with no account for strategy, analysis or more importantly a study of price.
Looking at Gold, we wanted to keep an open mind and read the price action especially when your looking for counter trend moves as this will lower the probability of a trade but when you are patient and follow the structure of price you can get some good nuggets of information that can really help you time your trade.
As you can see on the 1 Hour chart, price was moving up nicely until it formed a bearish 3 drive pattern in the process. This pattern can be a good indicator of price exhaustion especially when you can see these being formed on no less then a 1 Hour time frame.
Once we saw the pattern complete, that alone is not enough, we need to be patient and find a lower trend line, preferably with multiple hits registered on the line for if this breaks to the down side as well, this not only gives us good reason to enter the trade short but it allows for greater timing and accuracy of the trade.
We would look to place our stop just above the 3rd and final drive high to start with, as we are trading the pattern so there is no need to place it very far away.
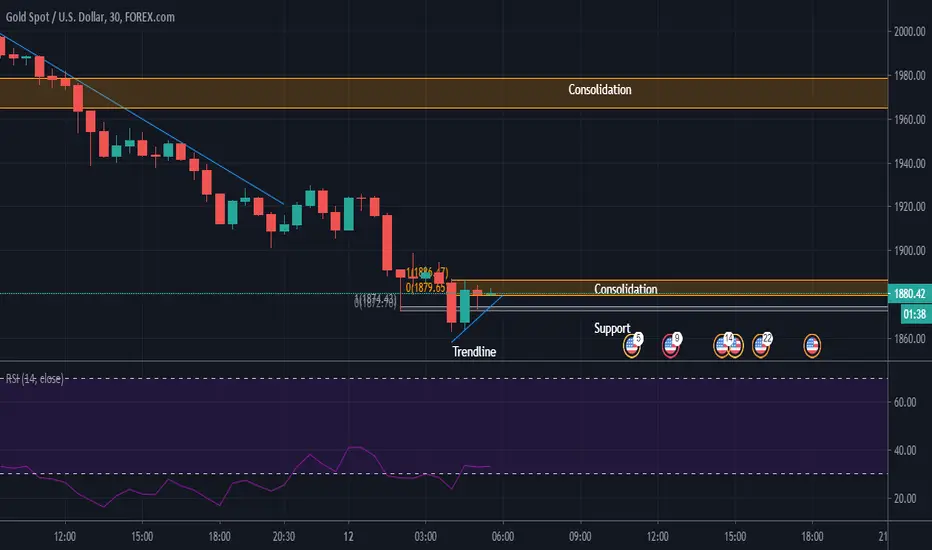
XAU/USD 30M Chart - It's a Buy Signal!As you can see that the candle is now moving upwards and hits its Support twice in the chart of 30 Minutes. Now, its in the consolidation period and it will change the trend to UP. So its a pure buy signal, let me know if I am wrong!
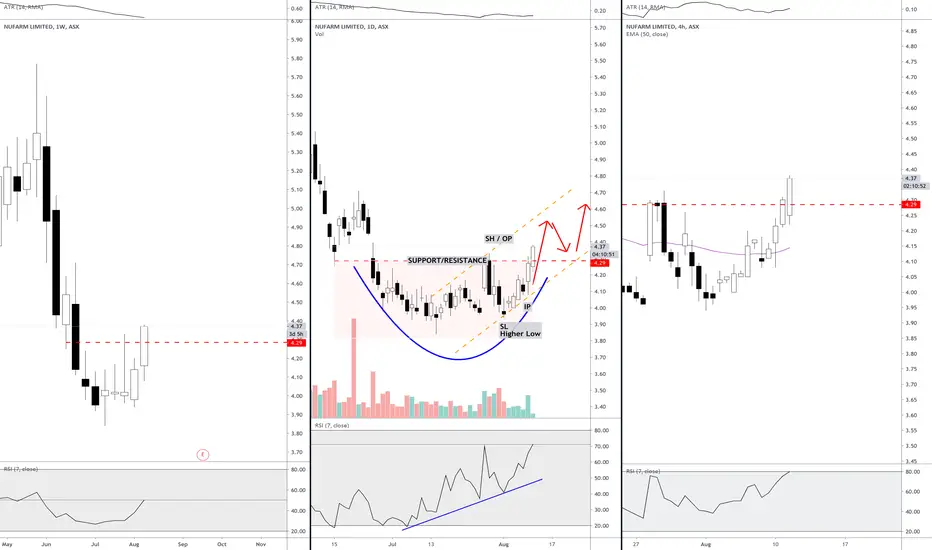
NUF - TRADE PLANInverse head & shoulders
Divergence
Lower high, trend reversal
Bull channel
break and retest supply demand zone
USDJPY-Weekly Market Analysis-Aug20,Wk2With the look of the structure and the Fibonacci level, there's a high chance that the market is set up for a trend reversal trade. I'm waiting for a retracement back to 105.55 for a trend-reversal buying opportunity. I'll look closely on how the candle react at the major resistance.

EURUSD video top-down AnalysisHello everyone, here is the top-down analysis for EURUSD, feel free to request any pair/instrument or ask any questions in the comment section below.
Best of luck!
