How To Setup & Use The Trend Trading IndicatorThis video gives an in depth explanation of each setting of the Trend Trading Indicator so you can understand how to set up the indicator properly and get your desired results.
We cover the following:
Master trend signals and settings
How to configure your master trend signal timeframes correctly
How to get rid of signals when the market is ranging
Each type of extra signal: strong all timeframe trends, pullbacks during strong trends, trend score signals and more
What timeframes and settings to use for intraday trading
Customizing the settings to get the results that fit your trading style
Make sure to test out your settings on various markets using historical data to ensure you have the indicator performing according to your specific parameters.
If you have any questions about using the indicator or the settings, feel free to reach out to us.
Happy Trading :)
Trendstrengthindicator

GOEV -Canoo reverses while TSLA slumps into earnings LONGGOEV was in the $ 4.50 to $5.50 range 1-2 months ago and on the 60 minute chart appears to
be in a round bottom or doble bottom reversal concurrently with TSLA continuing to fall on
the expectation of an earnings miss. GOEV's last earnings was a beat. It burned about half the
cash that the analysts forecasted. The relative trend index indicator suggests a trend up is
developing. A red flag is that volume is at or below the running mean. My plan is to watch
GOEV for a rise in trading volumes before entertaining a long trade here. The Price Volume
product Trend is helpful in that regard. While it currently has a positive slope it is minimal.
I will watch for something a bit steeper. I am expecting the Price Momentum Oscillator will
soon cross the horizontal zero and provide another entry signal.

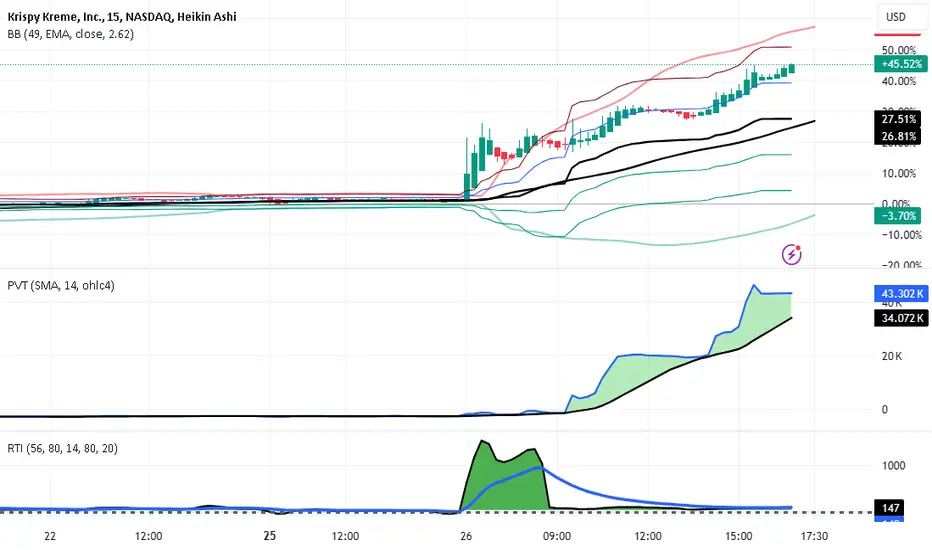
DNUT - Krispy jumped and then got a sugar high LONGDNUT from no where on a 15 minute chart moved late on Monday and then continued on
Tuesday, the trend indicator is thick suggesting continuation again for another day. Donuts sold
good for St. Patrick's Day. I am in this since yesterday. Added at the opening bell and the
lunch hour. It is risk free as the stop loss is above the average entry. Looks like more
bullish continuation tomorrow.
Introducing the Volatility Adjusted ADX (VADX)In this video, Stock Justice introduces you to the Volatility Adjusted ADX (VADX), a powerful tool that combines trend strength and market volatility. Learn how to customize your settings for optimal analysis and how this indicator, with its proprietary mathematical formulation, offers a nuanced perspective on market dynamics. Discover the benefits of normalized data and how to read and interpret the VADX line in conjunction with other indicators. All of this, delivered in Stock Justice's engaging style, will empower your technical analysis toolkit. Be ready to trade safe, trade smart!

