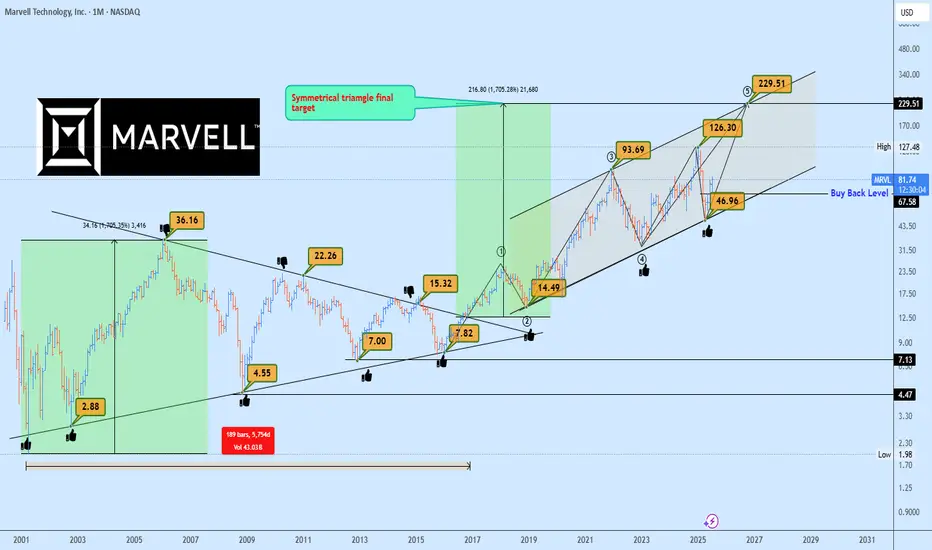
MRVL Massive 15-Years Symmetrical Breakout Targets AheadMarvell Technology (MRVL) has just completed a monumental breakout from a 15-years symmetrical triangle, a rare and powerful long-term accumulation structure. This type of macro consolidation typically precedes a major directional expansion, and in this case, the breakout confirmed bullish continuation.
Currently, MRVL is forming a rising channel structure, with price bouncing cleanly from the lower boundary confirming demand and the continuation phase of the macro move.
The 1:1 projection from the symmetrical triangle gives us a clear target trajectory, with the final leg potentially extending to $229, aligning perfectly with the upper boundary of the rising channel.
In the short to mid-term, the ideal buyback opportunity rests near $67.50, should the market retest previous breakout support or the lower boundary of the channel once more. This zone offers asymmetric risk-to-reward potential for long-term investors and swing traders alike.
Key Targets
📈 $67.50 – Buyback Opportunity Zone
📈 $229 – Rising Channel Top / 1:1 Expansion Target
A breakout this large is no coincidence, it’s backed by years of price compression and institutional positioning. Now is the time to watch closely.
📩 Drop your view in the comments and share your stock requests for quick analysis.
Only stock assets will be accepted under this post.
Triangle
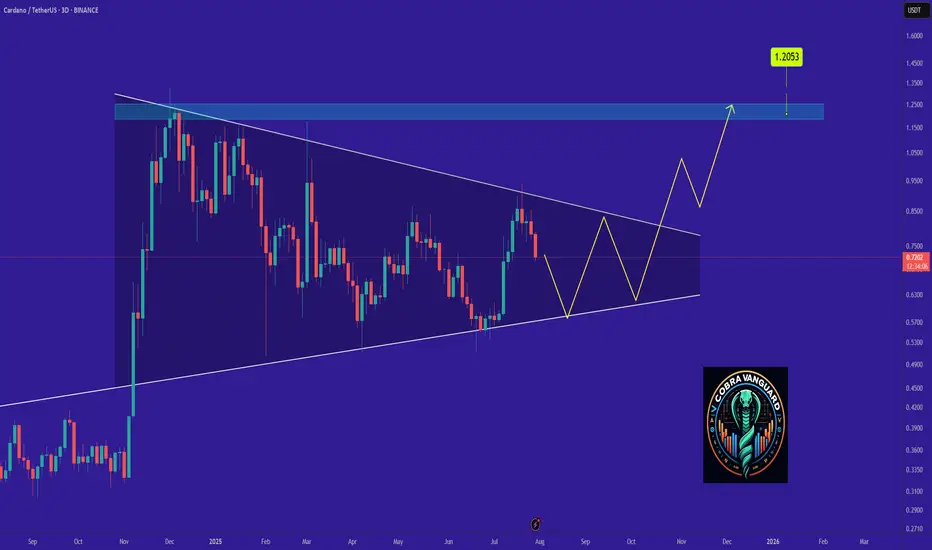
ADA Ready for PUMP or what ?The price on the 3d timeframe is within a triangle, which can create some uncertainty about which direction it will move. Here, we should wait to see which side of the triangle the price breaks out from. Remember, the trend is our friend.
Best regards CobraVanguard.💚
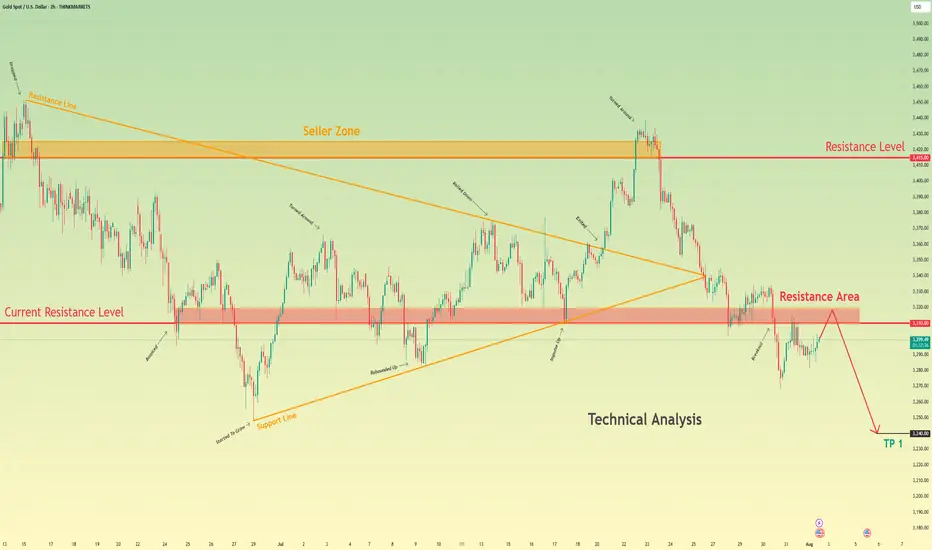
Gold can reach resistance area and then continue to fallHello traders, I want share with you my opinion about Gold. Over an extended period, the price action of Gold has been contained within a large descending triangle, a pattern characterized by a series of lower highs testing a descending resistance line and a relatively flat support base. The major seller zone around the 3415 resistance level has consistently capped upward rebounds, establishing a clear downward pressure on the asset. The most critical recent development has been a decisive breakdown, where the price broke below a key ascending trend line and, more importantly, below the horizontal support at 3310. This structural break has shifted the immediate market dynamics, turning the former support area of 3310 - 3320 into a new ceiling of resistance. The primary working hypothesis is a short scenario based on the principle of a breakdown and retest. It is anticipated that the price will attempt a corrective rally back towards this new resistance area around 3310. A failure to reclaim this level, confirmed by a strong rejection, would validate the breakdown and signal the continuation of the larger downward trend. Therefore, the tp for this next bearish leg is logically placed at the 3240 level. This target represents a significant area of potential support and a measured objective following the resolution of the recent consolidation. Please share this idea with your friends and click Boost 🚀
Disclaimer: As part of ThinkMarkets’ Influencer Program, I am sponsored to share and publish their charts in my analysis.
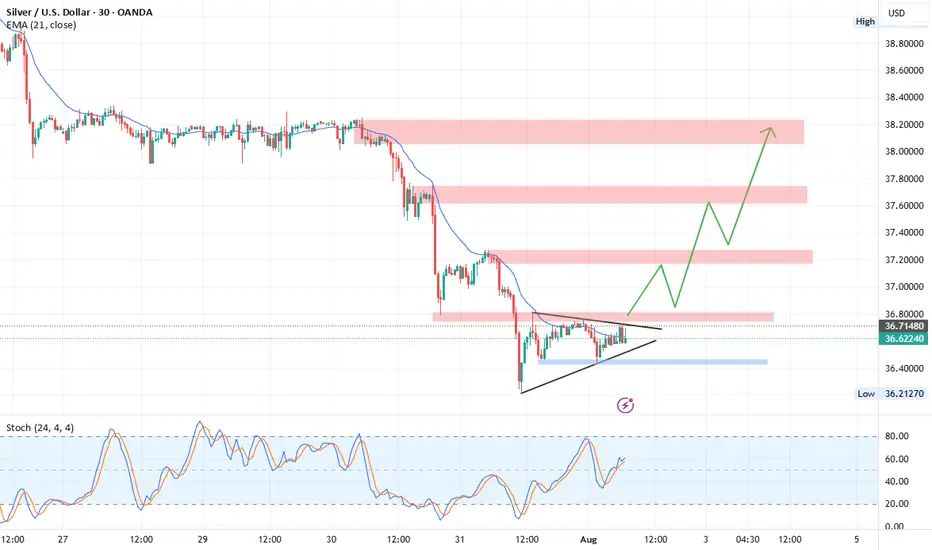
XAGUSD Technical Outlook (Silver/USD)Currently, Silver is trading inside a symmetrical triangle formation , signaling a potential breakout.
Upside Scenario:
A breakout above 36.80 resistance may trigger strong bullish momentum. The next target zone lies at 37.18 – 37.30, which is a relatively weak resistance and could potentially form a Head and Shoulders pattern . If momentum continues, Silver could extend gains toward 37.75 and 38.00 resistance levels.
Downside Scenario:
If the triangle breaks to the downside, we may see a short corrective move toward 3 6.25 – 36.20 support zone before any possible rebound.
Overall, the chart structure currently favors an upside breakout with continuation toward higher resistance zones.
EURO - Price can turn around of support level and rise to $1.165Hi guys, this is my overview for EURUSD, feel free to check it and write your feedback in comments👊
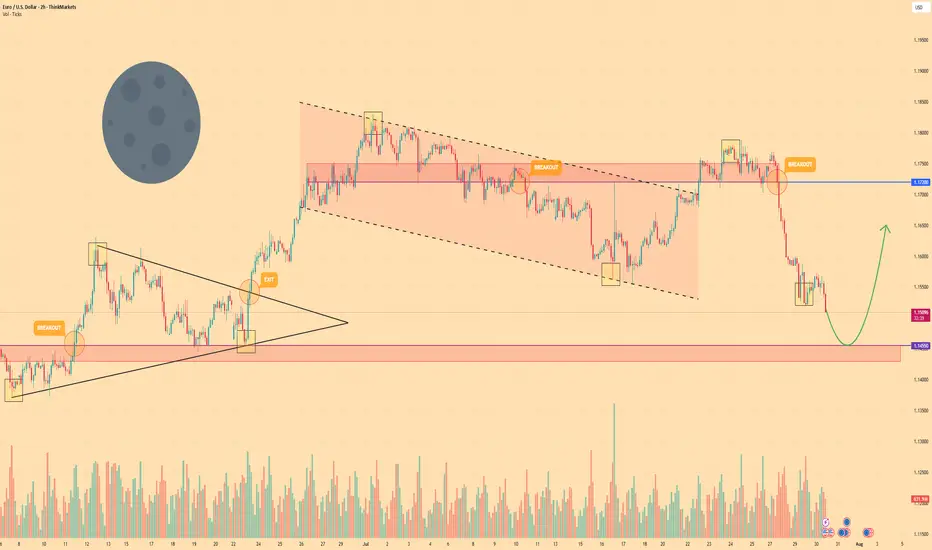
The market structure shifted after a breakout from a prior triangle pattern pushed the price higher.
This rally met resistance, and a new bearish trend emerged, creating a distinct falling channel.
The asset made several rotations inside this channel, with the most recent upswing failing at the $1.1720 resistance zone.
That failure to break higher initiated the current strong bearish impulse driving the price down.
Euro is now approaching a critical area of demand, the horizontal support zone near $1.1455.
I expect that buyers will defend the $1.1455 support level, causing a reversal that will carry the price towards the $1.1650 target.
If this post is useful to you, you can support me with like/boost and advice in comments❤️
Disclaimer: As part of ThinkMarkets’ Influencer Program, I am sponsored to share and publish their charts in my analysis.
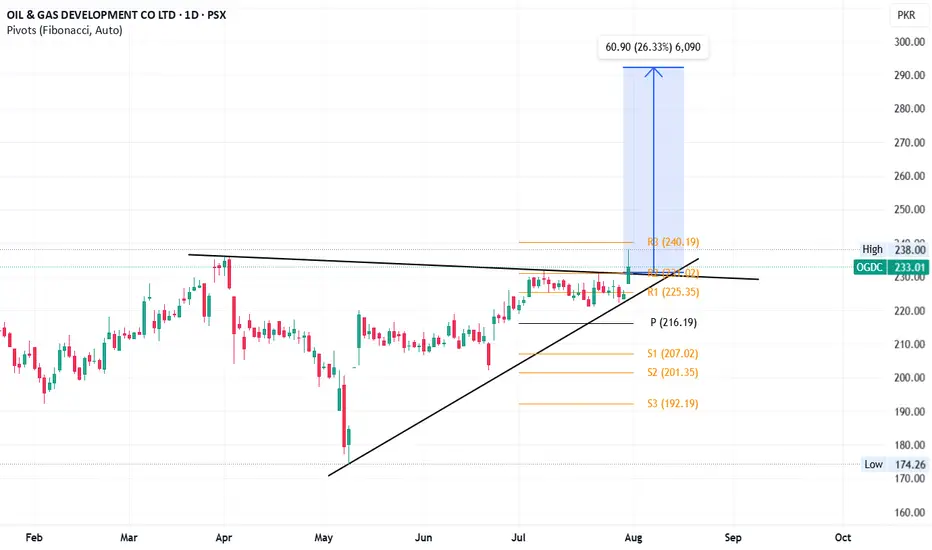
OGDC Breakout?On a daily timeframe, OGDC has given breakout of a triangle pattern. This will open up doors for it to move towards its all-time high i.e. ~290 region.
This is my personal opinion, not a buy / sell call.
All other indicators e.g. RSI, Stoch and MACD are bullish as well.
TSLA LONGQuite a simple set up. Confirmation is still needed on 3d, and daily. Bullish candles and volume is desperately needed for validation of symmetrical setup.
Volatility incoming. Break of ATH with strength leads to price discovery into $500+.

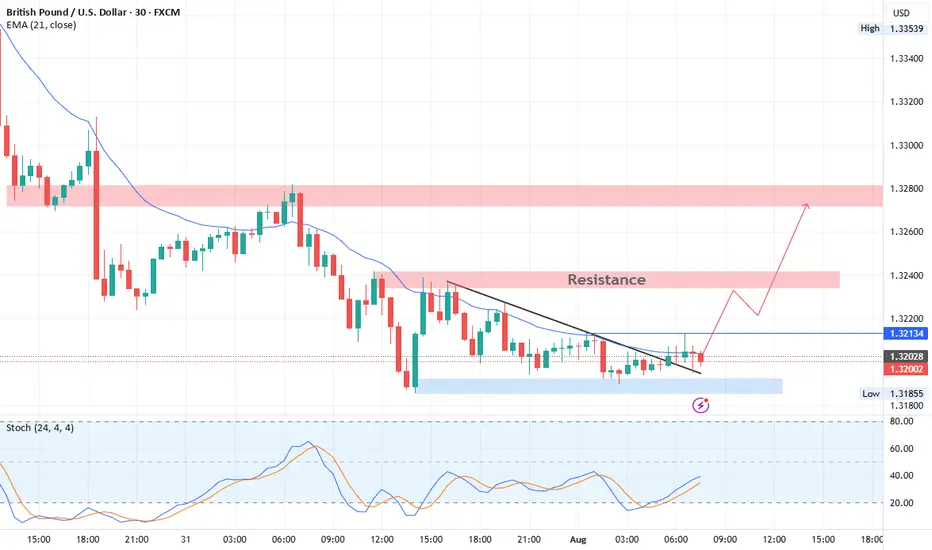
GBPUSD Technical BreakdownTrendline Breakout:
Price has decisively broken above a short-term descending trendline, signaling a potential shift in intraday momentum from bearish to bullish.
Support Zone (1.3185 – 1.3195):
This demand area has provided a strong base, with multiple successful rejections confirming buyer interest.
Resistance Levels:
Near-term resistance: 1.3213 (minor breakout level – watch for retest)
Key upside targets: 1.3240 followed by the major supply zone at 1.3275 – 1.3290
📈 Trade Outlook:
Bias: Bullish above 1.3213
Entry Idea: Look for bullish confirmation on a retest of 1.3213 as support
Targets:
TP1: 1.3240
TP2: 1.3275 – 1.3290
Invalidation: A sustained move below 1.3185 would invalidate the setup and reopen downside risk.
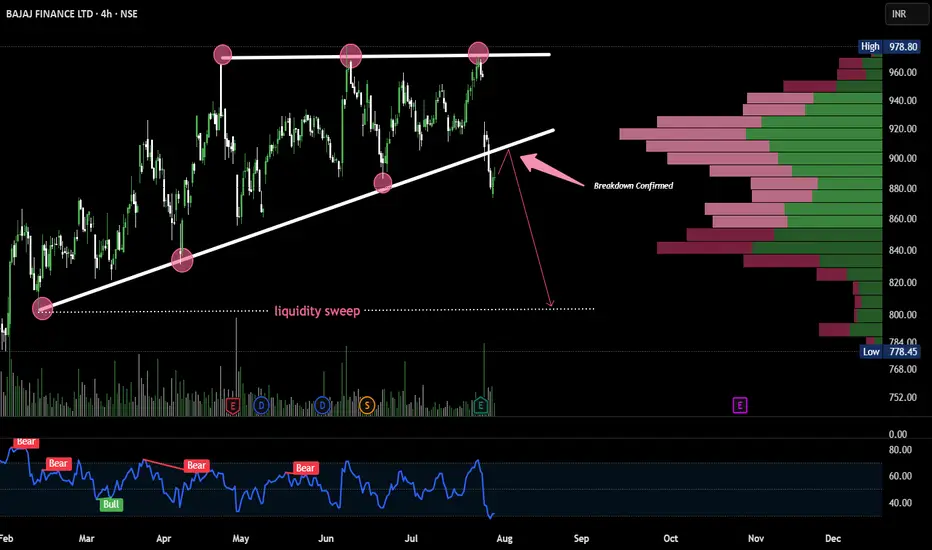
Ascending Triangle busted- Bajaj finance 📉 Bajaj Finance Breakdown Alert 🚨
Ascending Triangle busted!
Bearish RSI Divergence + Trendline Break = Trouble brewing.
High volume node - ₹920 could cap any retest.
Next support zone?
👀 ₹840–₹800 range looks like the battleground!
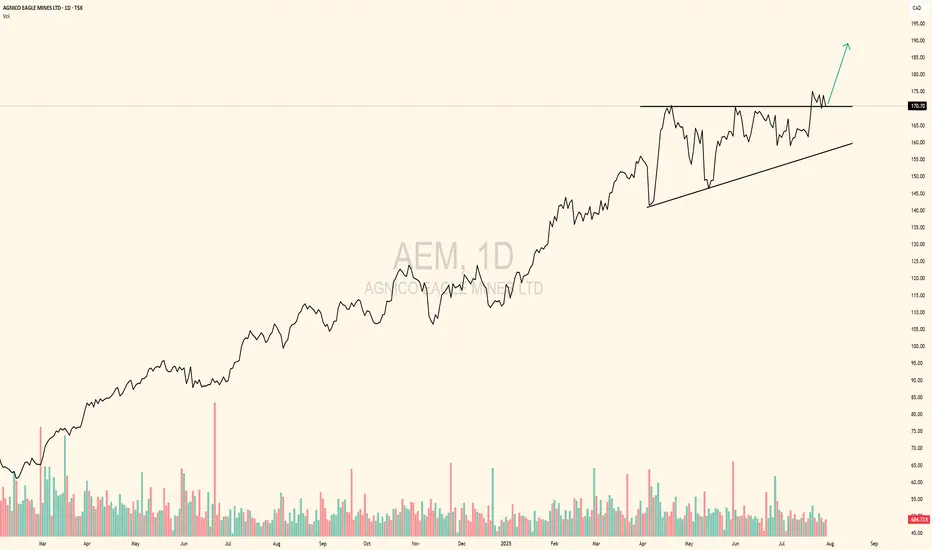
Lettuce hands will buy back at higher pricesAs the market capitulated on gold miners after FOMC, amazing earnings came out after the market closed.
Those sellers will fomo back in at higher prices.
Ascending triangle breakout to commence.
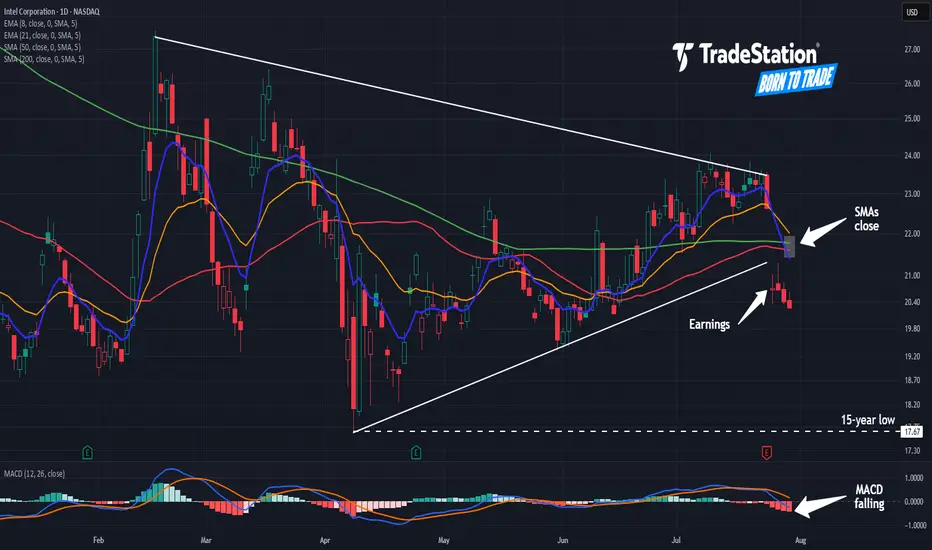
Intel: Still Not Cheap Enough?Intel has been falling for years, but some traders may think it’s still not cheap enough.
The first pattern on today’s chart is the series of higher lows since April, combined with lower highs since February. That converging range is a potential consolidation pattern.
Second, the chipmaker broke that range by gapping lower on Friday following a weak quarterly report.
Third, traders may eye $17.67 as the next important level. That April low was also the lowest price since August 2010.
Fourth, the 50-day simple moving average (SMA) inched toward the 200-day SMA this month but failed to cross above it. Is a longer-term bearish trend in effect?
Next, the 8-day exponential moving average (EMA) is below the 21-day EMA and MACD is falling. Both of those signals may be consistent with bearishness in the short term.
Finally, INTC is an active underlier in the options market. (Its average daily volume of about 350,000 contacts ranks 10th the S&P 500, according to TradeStation Data.) That could help traders take positions with calls and puts.
TradeStation has, for decades, advanced the trading industry, providing access to stocks, options and futures. If you're born to trade, we could be for you. See our Overview for more.
Past performance, whether actual or indicated by historical tests of strategies, is no guarantee of future performance or success. There is a possibility that you may sustain a loss equal to or greater than your entire investment regardless of which asset class you trade (equities, options or futures); therefore, you should not invest or risk money that you cannot afford to lose. Online trading is not suitable for all investors. View the document titled Characteristics and Risks of Standardized Options at www.TradeStation.com . Before trading any asset class, customers must read the relevant risk disclosure statements on www.TradeStation.com . System access and trade placement and execution may be delayed or fail due to market volatility and volume, quote delays, system and software errors, Internet traffic, outages and other factors.
Securities and futures trading is offered to self-directed customers by TradeStation Securities, Inc., a broker-dealer registered with the Securities and Exchange Commission and a futures commission merchant licensed with the Commodity Futures Trading Commission). TradeStation Securities is a member of the Financial Industry Regulatory Authority, the National Futures Association, and a number of exchanges.
Options trading is not suitable for all investors. Your TradeStation Securities’ account application to trade options will be considered and approved or disapproved based on all relevant factors, including your trading experience. See www.TradeStation.com . Visit www.TradeStation.com for full details on the costs and fees associated with options.
Margin trading involves risks, and it is important that you fully understand those risks before trading on margin. The Margin Disclosure Statement outlines many of those risks, including that you can lose more funds than you deposit in your margin account; your brokerage firm can force the sale of securities in your account; your brokerage firm can sell your securities without contacting you; and you are not entitled to an extension of time on a margin call. Review the Margin Disclosure Statement at www.TradeStation.com .
TradeStation Securities, Inc. and TradeStation Technologies, Inc. are each wholly owned subsidiaries of TradeStation Group, Inc., both operating, and providing products and services, under the TradeStation brand and trademark. When applying for, or purchasing, accounts, subscriptions, products and services, it is important that you know which company you will be dealing with. Visit www.TradeStation.com for further important information explaining what this means.
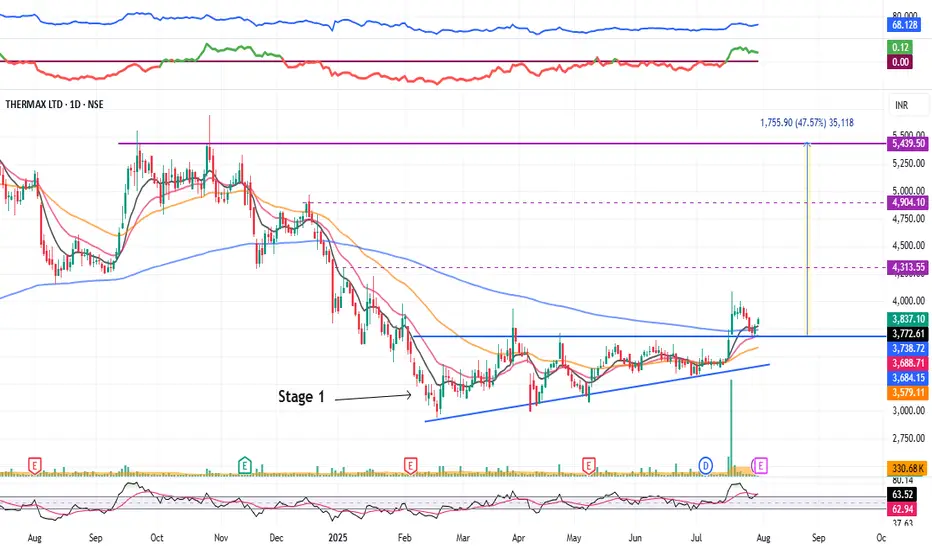
Thermax : Stage 1 Breakout (1-3 Months)#Thermax #stage1nreakout #ascendingtrianglepattern #patternbreakout #trendingstock #swingTrading
Thermax : Swing Trading
>> Stage 1 Breakout + Retest done
>> Ascending Triangle @ bottom of Downtrend
>> Trending setup in stock
>> Good strength & Recent Volume Buildup
>> Low Risk High Reward Trade
Swing Traders can lock profit at 10% and keep trailing
Pls Boost, comment & Follow for more Analysis
Disc : Charts Shared are for Learning Purpose & not a Trade recommendation. Pls consult a SEBI Registered Advisor before taking position in it
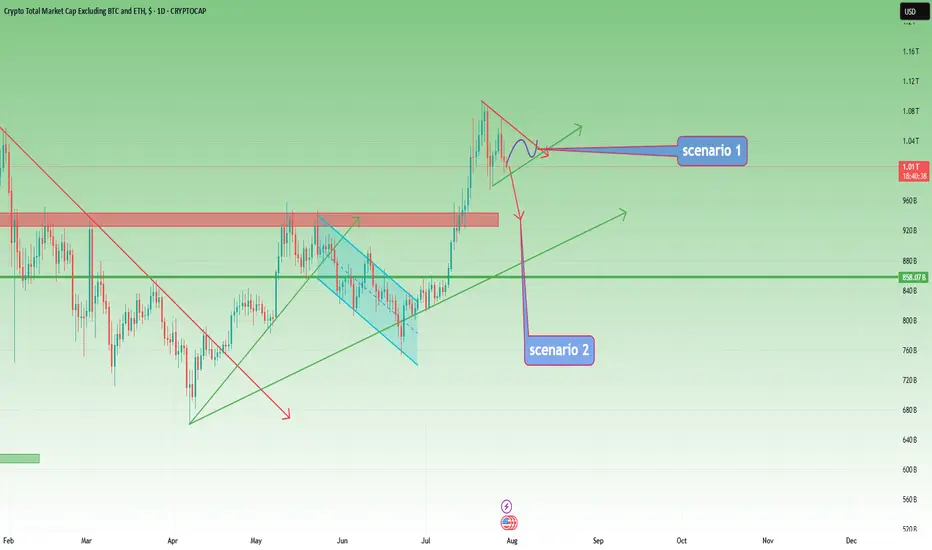
TOTAL3 – Still Bullish, But Waiting for Clarity
In my previous analysis on TOTAL3, I mentioned the high probability of a correction, but also noted that I didn’t expect the 925–940B zone to be reached.
And indeed, price reversed early — finding support around 975B before moving higher.
However, after a push up to 1.07T, the market has started to pull back again.
📊 Current Outlook – Two Scenarios I’m Watching:
Bullish Triangle:
Price may continue to consolidate into a symmetrical triangle, then resume the uptrend from there.
Deeper Pullback into Support:
The market could retest the 925–940B zone, a key support area, before bouncing back up.
⚠️ Bearish Reassessment?
Of course, if price breaks back below 925B and stays there, we’ll have to reconsider the bullish case.
But for now, the trend remains intact, and there’s no technical reason to panic.
📌 My Plan:
I already hold a bag of alts, and I’m not adding for now.
I’ll wait until the pattern becomes clearer — whether it’s a triangle breakout or a dip into support.
Until then, I’m sitting comfortably on what I already hold.
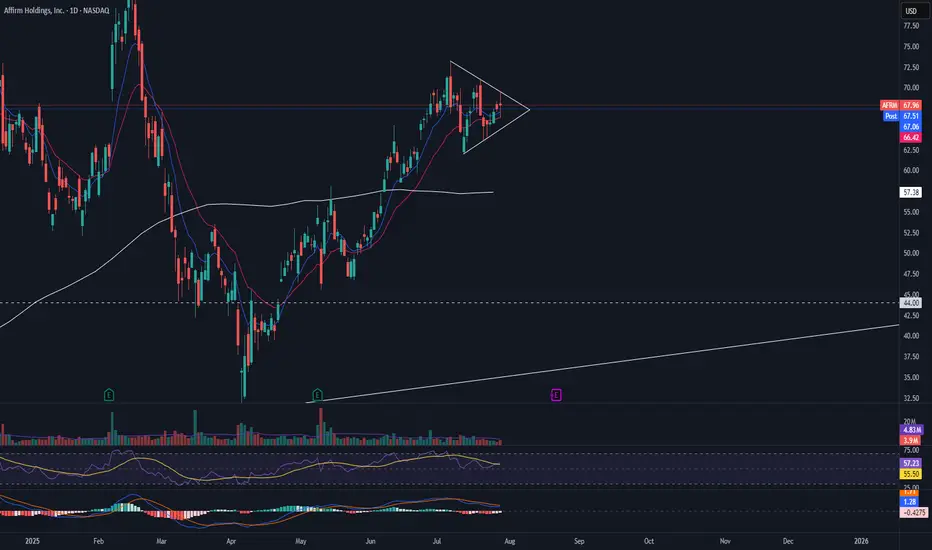
AFRM pre earnings triangleAFRM is currently in a symmetrical triangle with RSI and MACD beginning to show the pattern may come to an end. I would want to see this triangle break with volume before entering a long position.
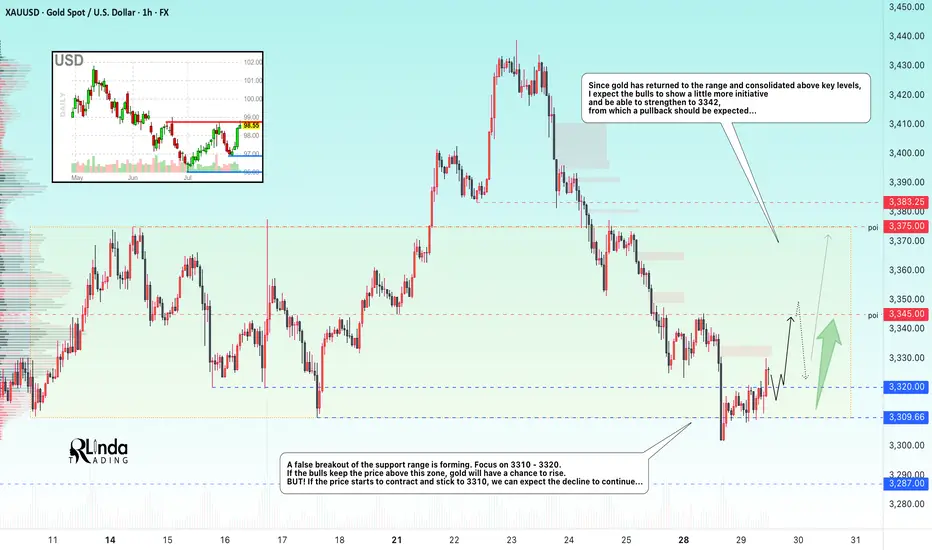
GOLD → Formation of a trading range. 3345?FX:XAUUSD confirms support for the local range. A false breakdown has formed and the price has returned to the buying zone. We are waiting for the bulls to take the initiative...
Gold is trying to recover after falling to $3302, remaining under pressure ahead of key events in the US: the publication of GDP data and the Fed's decision on interest rates. Support is provided by a pause in the dollar's growth, expectations of an extension of the US-China trade truce, and growing demand for safe-haven assets amid a surge in oil prices due to the threat of new sanctions against Russia. However, the sustainability of growth is in question: the dollar may strengthen thanks to optimism about the US economy and progress in negotiations.
A false breakdown of the support range is forming. Focus on 3310-3320. If the bulls keep the price above this zone, gold will have a chance to grow. BUT! If the price starts to contract and stick to 3310, we can expect the decline to continue...
Resistance levels: 3345, 3375
Support levels: 3320, 3310, 3287
The two-day movement has most likely exhausted its potential, or the market has decided to recover slightly due to the unpredictability factor. A false breakdown of support could trigger a pullback to the strong level of 3345, from which a rebound could form (either before growth or before the continuation of the decline; it is necessary to monitor the reaction and the market background...).
Best regards, R. Linda!
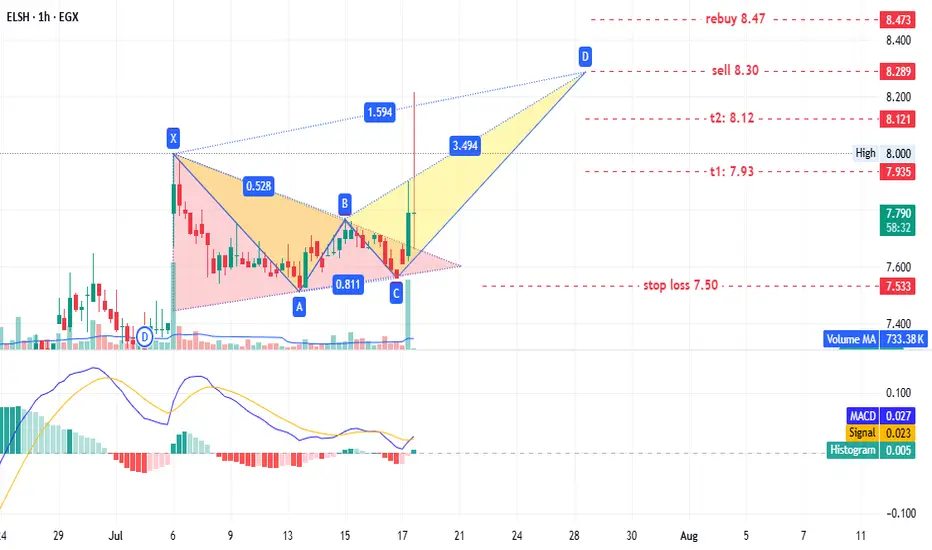
ELSH - old player EGX:ELSH timeframe: 1 hour.
A triangle pattern was identified, targeting 8.20. No new entry is recommended for shareholders, but if prices retest the triangle pattern at 7.65–7.60, it could present a low-risk entry opportunity.
This may also form a potential bearish Gartley pattern with targets:
- T1: 7.93
- T2: 8.12
- T3: 8.30 (sell point)
Stop loss: 7.50.
If prices continue rising and close above 8.47, consider rebuying what was sold at 8.30.
Disclaimer: This is not financial advice, only our analysis based on chart data. Consult your account manager before investing.
Good luck!
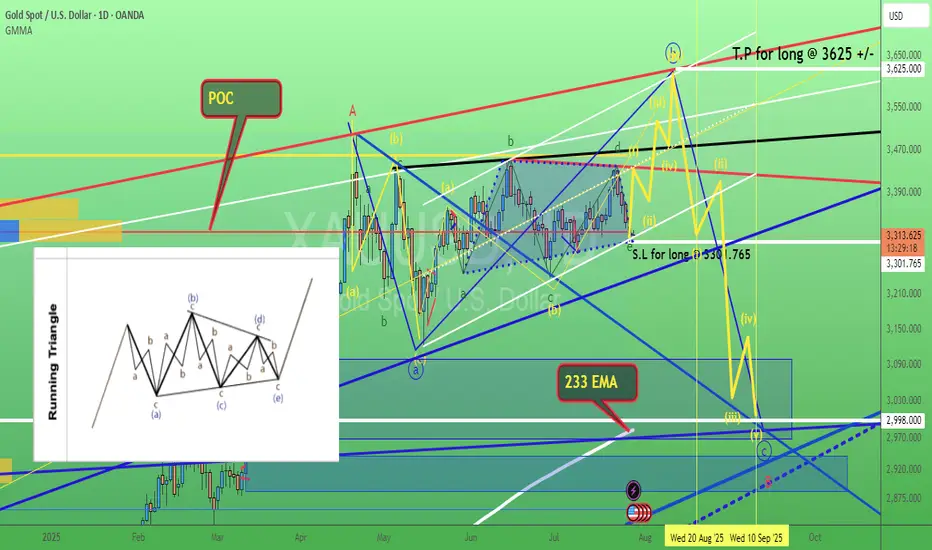
Gold. wave e (green) of triangle possible reached. 29/July/25XAUUSD based on speed of chart + confluence zone 1) Channel Support 2) POC of volume profile 3) Trendline support. Gold probably completed its wave e (green) of triangle.
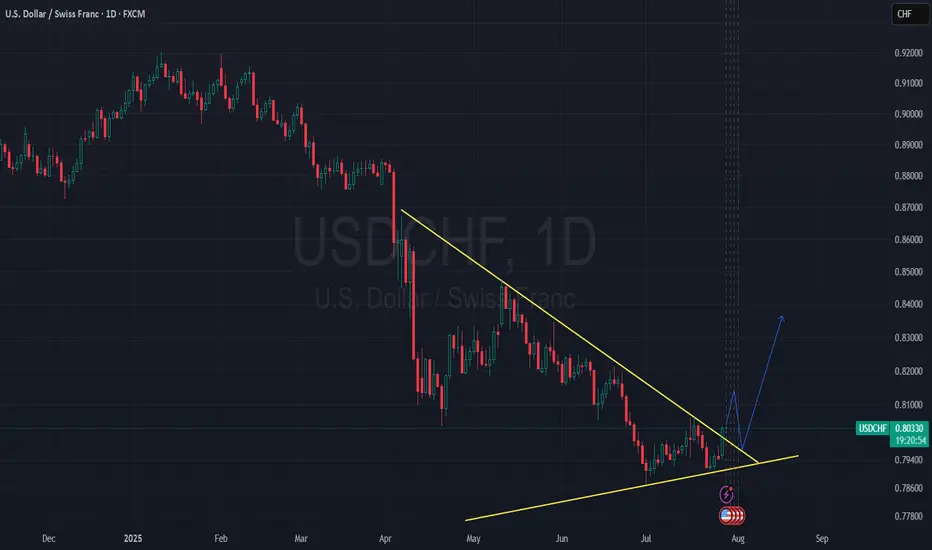
USD/CHF Just Broke Out of an Ascending Triangle - LONG📈 Price has just broken out of an ascending triangle pattern.
I’m now patiently waiting for a retest of the breakout zone to explore a potential long opportunity.
Let’s see if the market gives us a clean entry! 💹🧠
Wall Street's Billion-Dollar BNB Bet Fuels ATHBNB Ignites the Altcoin Market as Wall Street Giants Place Billion-Dollar Treasury Wagers
A perfect storm of technological advancement, surging institutional adoption, and bullish market sentiment has catapulted BNB into the stratosphere, setting the entire altcoin market alight. The native token of the sprawling BNB Chain ecosystem has not only shattered its previous all-time highs but is now the subject of unprecedented attention from major Wall Street players, who are lining up to pour billions into the digital asset. This confluence of factors has analysts and investors buzzing, with predictions of a continued explosive rally that could see BNB’s value enter uncharted territory in the coming months.
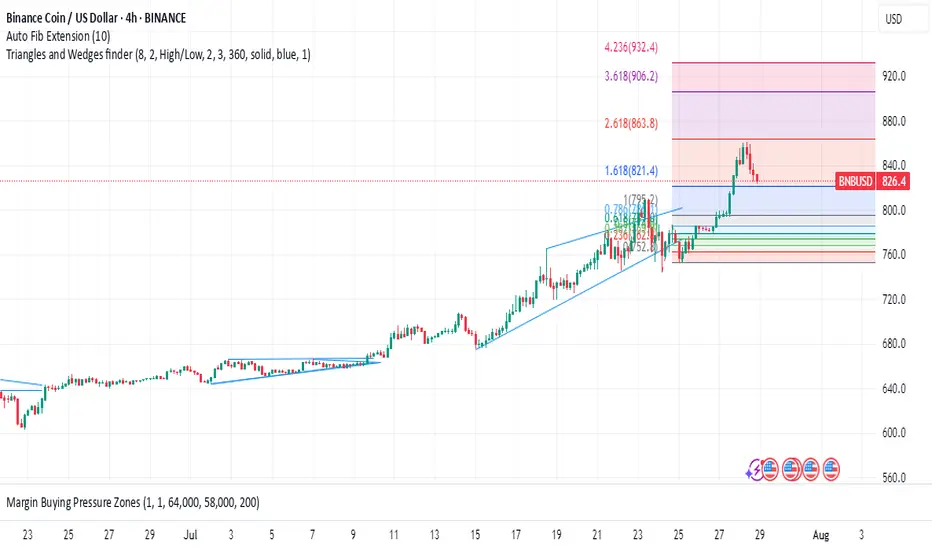
The price action has been nothing short of spectacular. In a powerful surge in late July 2025, BNB systematically broke through previous resistance levels, climbing to record peaks of over $860. This rally propelled its market capitalization to soar past $115 billion, a figure that eclipses that of established global giants like Nike. The move signaled more than just a momentary spike; it represented a fundamental repricing of the asset, driven by a narrative that has shifted from one of retail speculation to one of serious, long-term institutional conviction.
At the heart of this frenzy is a seismic shift in how traditional finance views BNB. The token is rapidly transitioning from a utility asset for a cryptocurrency exchange into a strategic reserve asset for corporate treasuries, following a path previously paved by Bitcoin. This new wave of "BNB Treasury" strategies is creating a structural demand floor and signaling a maturation of the asset class that few could have predicted just a few years ago.
The Institutional Stampede: A Billion-Dollar Bet on BNB
The most significant catalyst behind BNB’s recent ascent is the dramatic and public entry of institutional capital. A series of stunning announcements have revealed a coordinated and well-capitalized effort by publicly traded companies and investment firms to acquire substantial BNB holdings for their corporate treasuries.
Leading the charge is a landmark initiative by CEA Industries Inc., a Nasdaq-listed company, in partnership with the venture capital firm 10X Capital and with the backing of YZi Labs. The group announced an audacious plan to establish the world's largest publicly listed BNB treasury company. The strategy involves an initial $500 million private placement, comprised of $400 million in cash and $100 million in crypto. However, the full scope of the ambition is staggering: through the exercise of warrants, the total capital raised for the purpose of acquiring BNB could reach an astounding $1.25 billion.
This move is not being made in a vacuum. The deal has attracted a veritable who's who of institutional and crypto-native investors, with over 140 subscribers participating. The list includes heavyweights like Pantera Capital, GSR, Arrington Capital, and Blockchain.com, indicating widespread and sophisticated belief in the long-term value proposition of the BNB ecosystem. The leadership team for this new treasury venture further underscores its institutional credibility, featuring David Namdar, a co-founder of Galaxy Digital, and Russell Read, the former Chief Investment Officer of CalPERS, one of the largest public pension funds in the United States.
The CEA Industries and 10X Capital venture is the flagship of a growing armada of institutional interest. Before this headline-grabbing announcement, other companies had already signaled their bullish stance. Windtree Therapeutics, a biotech firm, disclosed it had secured $520 million through an equity line of credit to purchase BNB for its treasury. Similarly, the Nasdaq-listed Nano Labs expanded its own holdings to 128,000 BNB tokens, valued at over $100 million. Adding to the wave, Liminatus Pharma, another US-based biotech company, unveiled its own dedicated investment arm, the "American BNB Strategy," with the goal of deploying up to $500 million into BNB over time.
Collectively, these publicly announced plans represent more than $600 million in direct accumulation, with the potential for well over a billion dollars in buying pressure hitting the market. This institutional influx is fundamentally different from retail-driven rallies. These entities are not typically short-term traders; they are establishing long-term strategic positions. By allocating significant portions of their treasuries to BNB, they are effectively removing a large swath of the token's supply from the liquid market, creating a supply shock that can have a profound and lasting impact on price. This trend enhances BNB’s legitimacy, positioning it as a viable, institutional-grade reserve asset and providing a powerful new narrative for its continued growth. The market reaction to this news was immediate and explosive, not only for BNB but also for the companies involved. CEA Industries' stock (ticker: VAPE) skyrocketed over 600% in a single day, demonstrating the immense investor appetite for regulated, publicly-traded vehicles that offer exposure to the BNB ecosystem.
The Maxwell Upgrade: A High-Performance Engine for Growth
While the flood of institutional money has provided the high-octane fuel for BNB's rally, the engine driving its fundamental value has been meticulously upgraded. The recent "Maxwell" hard fork, implemented on the BNB Smart Chain (BSC) at the end of June 2025, represents a pivotal technological leap forward, dramatically enhancing the network's performance and scalability.
Named after the physicist James Clerk Maxwell, the upgrade was engineered to push the boundaries of blockchain efficiency. Its core achievement was the near-halving of the network's block time. Previously, BSC produced a new block approximately every 1.5 seconds; post-Maxwell, that interval has been slashed to a blistering 0.75 to 0.8 seconds. This move to sub-second block times effectively doubles the network's transaction speed and throughput.
For users, the impact is tangible and immediate. Transactions are confirmed faster, decentralized applications (dApps) feel more responsive, and the overall user experience is significantly smoother. Whether trading on a decentralized exchange (DEX), engaging with a DeFi lending protocol, or playing a blockchain-based game, the latency has been drastically reduced.
The Maxwell upgrade was not a simple tweak but a comprehensive overhaul powered by three key technical proposals:
1. BEP-524: This proposal was directly responsible for reducing the block interval, accelerating transaction confirmations and improving the responsiveness of dApps, making interactions in DeFi and GameFi feel closer to real-time.
2. BEP-563: With blocks being produced at twice the speed, the network's validators need to communicate and reach consensus much more quickly. This proposal enhanced the peer-to-peer messaging system between validators, strengthening the consensus process and reducing the risk of synchronization delays or missed blocks.
3. BEP-564: To further accelerate data synchronization across the network, this proposal introduced new message types that allow validator nodes to request and receive multiple blocks in a single, efficient message, ensuring the entire network remains stable and in sync despite the increased tempo.
The real-world impact of these technical improvements was almost immediate. In the month the Maxwell upgrade was rolled out, the 30-day decentralized exchange (DEX) volume on the BNB Chain soared to a record-breaking $166 billion. This figure surpassed the combined DEX volumes of major competitors like Ethereum and Solana, cementing BNB Chain's position as a leader in decentralized trading activity. PancakeSwap, the largest DEX on the chain, was a major beneficiary, handling the lion's share of this volume.
This surge in on-chain activity demonstrates a powerful feedback loop: technological enhancements attract more users and developers, which in turn drives up transaction volume and network utility, further increasing the value of the native BNB token. The Maxwell upgrade has solidified BNB Chain’s reputation as a high-performance, low-cost environment, making it an increasingly attractive platform for high-frequency traders, arbitrage bots, and a wide array of decentralized applications that demand both speed and reliability. The upgrade has also been credited with a significant increase in user engagement, with active addresses on the network surging 37% in the 30 days following its implementation, a growth rate that starkly outpaced competitors.
How High Can It Go? Analysts Eye $2,000 Cycle Top
With institutional floodgates opening and the network’s underlying technology firing on all cylinders, the question on every investor's mind is: how high can BNB price go? Market analysts are increasingly bullish, with many seeing the recent all-time highs as merely a stepping stone to much loftier valuations.
A price target of $1,000 is now widely considered a conservative short-to-medium-term goal. Some technical analysts, looking at the price charts, see a clear path to this milestone, potentially as early as August 2025. They point to BNB’s price action within a long-term ascending channel, with the upper trendline of this channel suggesting a target near the $1,000 mark. This level also aligns with key Fibonacci extension levels, adding technical weight to the prediction.
Beyond the four-figure mark, some of the most compelling forecasts come from analysts studying historical chart patterns, or "fractals." Market analyst BitBull, for instance, has drawn parallels between the current market structure and a pattern observed between 2018 and 2021. During that period, BNB’s price consolidated within a large ascending triangle pattern before breaking out and embarking on a monumental 920% rally. A similar multi-year ascending triangle has just seen a decisive breakout, suggesting history may be poised to repeat itself.
Based on this fractal analysis, BitBull projects a potential cycle top for BNB in the range of $1,800 to $2,000, which could be reached by early 2026. The analyst notes that even if the current rally only captures a fraction of the momentum seen in the previous cycle, a move past $1,000 by the end of the year seems highly plausible. A more aggressive interpretation of the ascending triangle breakout even suggests a speculative target as high as $3,900, though such a move would depend on ideal market conditions.
The derivatives market is also flashing bullish signals, reinforcing the positive sentiment. Open interest in BNB futures contracts—the total value of all active positions—has surged to an all-time high of over $1.7 billion. This indicates that a growing amount of capital is being deployed to bet on the future direction of BNB's price. Furthermore, funding rates have turned positive, meaning traders with long positions are willing to pay a premium to maintain their bullish bets, a sign of strong conviction in continued upward momentum.
This combination of fundamental drivers—soaring institutional demand and a supercharged network—along with bullish technical patterns and derivatives market activity, creates a powerful case for a sustained and significant appreciation in BNB's value. While the crypto market remains inherently volatile and no outcome is guaranteed, the confluence of positive factors currently surrounding BNB is undeniable. The token has set the altcoin market abuzz, not just by reaching new price peaks, but by fundamentally redefining its role in the digital asset landscape, transforming from a simple utility token into a cornerstone of Wall Street's burgeoning crypto treasury strategies. The journey into price discovery has just begun.
Ethereum Price Eyes $5K as Frenzy Fuels Supply ShockEthereum's Ascent: A Perfect Storm of Institutional Frenzy, Dwindling Supply, and Shifting Market Dominance
A palpable sense of anticipation is building in the cryptocurrency market, and its focal point is increasingly not on the reigning king, Bitcoin, but on its heir apparent, Ethereum. A confluence of powerful forces—ranging from bullish proclamations by Wall Street titans and an unprecedented institutional buying spree to compelling on-chain metrics and a shifting market structure—is painting a picture of a potential paradigm shift. The world's second-largest cryptocurrency is not just rallying; it appears to be on the precipice of a significant breakout, with some analysts eyeing targets that would shatter its previous all-time highs. This is not merely a story of price appreciation but a narrative of a "quiet takeover," where Ethereum's fundamental strengths and evolving role in the digital asset economy are finally being recognized by the world's largest financial players.
The chorus of bullish voices has grown louder in recent months, led by influential figures like billionaire investor and Galaxy Digital CEO, Mike Novogratz. A long-time crypto proponent, Novogratz has become increasingly vocal about his conviction that Ethereum is poised to outperform Bitcoin in the near future. He has repeatedly stated that Ethereum has a "really powerful narrative" and that market conditions are aligning for a significant upward move. Novogratz's thesis is built on a simple yet potent economic principle: a demand shock colliding with an already constrained supply. He predicts that Ethereum could outperform Bitcoin in the next three to six months, a bold statement given Bitcoin's own impressive performance.
The catalyst for this potential outperformance, according to Novogratz, is the flood of institutional capital now targeting Ethereum. This isn't just speculative interest; it's a strategic shift by major companies to hold ETH as a treasury reserve asset. This trend, he argues, is creating a supply crunch that will inevitably drive prices higher. The billionaire has identified the $4,000 mark as a critical psychological and technical level. In his view, a decisive break above this price point would launch Ethereum into a phase of "price discovery," where past resistance levels become irrelevant and the asset's value is determined by the sheer force of market demand. Novogratz believes Ethereum is "destined" to repeatedly challenge this $4,000 ceiling, suggesting that a breakout is a matter of when, not if.
This bullish sentiment from one of crypto's most respected voices is not occurring in a vacuum. It is underpinned by a dramatic and sustained price rally that has seen Ethereum's value surge by an astonishing 75% since late June. This powerful uptrend is not fueled by retail FOMO alone; rather, it is the result of a verifiable and accelerating wave of institutional adoption.
The primary engine behind this rally has been the launch and subsequent success of spot Ethereum Exchange-Traded Funds (ETFs). These regulated financial products have opened the floodgates for institutional investors to gain exposure to ETH without the complexities of direct custody. The inflows have been nothing short of staggering. In one remarkable instance on July 25th, Ethereum ETFs registered a net inflow of $452.8 million in a single day, with BlackRock's ETHA fund accounting for the lion's share at $440.1 million. This figure represents a dramatic escalation from the sub-$100 million daily inflows seen in early July, indicating a multifold jump in institutional buying pressure. In a single week, these ETFs absorbed a massive $2.18 billion, showcasing the voracious appetite of big money for a piece of the Ethereum network.
The impact of these ETF inflows is being magnified by a phenomenon known as a "supply shock." Analysts have noted that in a three-week period, ETFs purchased an amount of ETH equivalent to what the network would issue over 18 months. This aggressive absorption of the available supply from the open market, at a time when supply is already constrained due to staking and other factors, creates a powerful upward pressure on price.
The institutional frenzy is not limited to passive ETF investments. A new and significant trend has emerged: the rise of the "Ethereum treasury company." Mirroring the strategy pioneered by MicroStrategy with Bitcoin, corporations are now beginning to add substantial amounts of ETH to their balance sheets, viewing it as a strategic asset and a yield-bearing investment through staking.
Leading this charge is SharpLink Gaming, an online technology company that has made headlines with its aggressive accumulation of Ether. The company recently purchased an additional 77,210 ETH, worth approximately $295 million, in a single transaction. This purchase alone was more than the total net issuance of new Ether over the preceding 30 days. Following this acquisition, SharpLink's total holdings soared to over 438,000 ETH, valued at more than $1.69 billion. This makes SharpLink one of the largest corporate holders of Ethereum, second only to Bitmine Immersion Tech.
SharpLink's strategy is clear and ambitious. The company has filed to increase its stock sale from $1 billion to $6 billion, with the majority of the proceeds earmarked for further ETH purchases. The appointment of Joseph Chalom, a 20-year veteran of the world's largest asset manager, BlackRock, as its new co-CEO, lends further institutional credibility to its crypto-centric strategy. The company has also been vocal about its belief in the Ethereum network, with a recent social media post declaring, "Banks close on weekends. Ethereum runs 24/7." This sentiment captures the essence of why institutions are drawn to the programmable, always-on nature of the Ethereum blockchain.
Other companies, such as BitMine Immersion Technologies and the upcoming Ether Machine, which plans to list on Nasdaq, are also amassing significant ETH treasuries. BitMine has reported holdings of over 566,000 ETH, worth more than $2 billion. Collectively, these corporate players are creating a significant and sustained source of demand, locking up large portions of the circulating supply. This corporate buying spree is a powerful vote of confidence in Ethereum's long-term value proposition, extending far beyond its utility as a digital currency.
The torrent of institutional capital and corporate accumulation is vividly reflected in Ethereum's on-chain data. The network is buzzing with activity, providing a transparent window into the scale of the current buying pressure. One of the most telling metrics has been the explosion in on-chain volume. Over a recent three-week period, on-chain ETH volume surged by an incredible 288%, reaching a staggering $10.38 billion. This indicates a deep and liquid market with robust participation.
Even more compelling is the activity of large holders, colloquially known as "whales." Analysis of blockchain data reveals a sharp increase in the number of "mega whale" addresses—those holding 10,000 ETH or more. Since early July, over 170 new mega whale addresses have appeared on the network. This trend strongly suggests that the massive inflows from ETFs are not just being held by custodians but are being translated into direct, long-term accumulation by large, well-capitalized entities. These are typically "strong hands" that are less likely to sell in response to short-term market fluctuations, providing a stable base of support for the price.
Furthermore, the weekly volume of large transactions, defined as those exceeding $100,000, has hit its highest level since the peak of the 2021 bull run, totaling more than $100 billion in a single week. This explosion in whale activity, coinciding with Ethereum's price breakout into the high $3,000s, confirms that "smart money" is actively and aggressively positioning itself in the market. This is not the speculative froth of a retail-driven rally but the calculated maneuvering of institutional players.
Adding another layer to Ethereum's bullish case is a significant shift in the broader cryptocurrency market landscape: the steady decline of Bitcoin's dominance. Bitcoin dominance, which measures BTC's market capitalization as a percentage of the total crypto market cap, has been trending downwards. This indicates that capital is beginning to flow out of Bitcoin and into alternative cryptocurrencies, or "altcoins," with Ethereum being the primary beneficiary.
This phenomenon, often referred to as a "quiet takeover," signals growing confidence in Ethereum's relative strength. While Bitcoin has already set new all-time highs in the current cycle, Ethereum has yet to surpass its 2021 peak, suggesting it has more room to run. Analysts note that as Bitcoin's momentum has somewhat stalled, investors seeking higher returns are rotating into Ethereum, which offers a compelling combination of a strong narrative, institutional adoption, and significant upside potential.
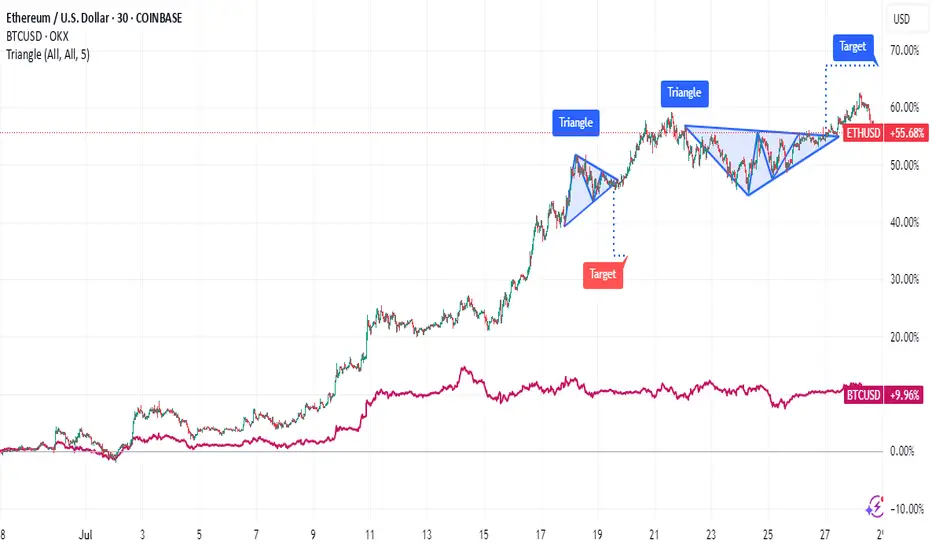
The outperformance is stark when looking at recent returns. In the last 30 days, while Bitcoin posted respectable gains of around 11%, Ethereum surged by over 61%. This divergence is a classic sign of a market beginning to favor altcoins, a period often dubbed "altcoin season." Ethereum, as the leader of the altcoin pack, typically paves the way for broader rallies across the ecosystem. A rising Ethereum price and declining Bitcoin dominance create a fertile ground for other altcoins to flourish, with some analysts predicting double-digit returns for many smaller projects if Ethereum can successfully break the $4,000 barrier.
From a technical perspective, Ethereum's price chart is flashing multiple bullish signals, suggesting that the recent rally could be the start of a much larger move. Analysts are closely watching several key formations that have been developing over a long period. One of the most significant is a massive consolidation pattern. After a prolonged period of trading within a range, a breakout from such a pattern often leads to a powerful and sustained trend. Some analysts believe a breakout is imminent, with initial price targets set between $4,800 and $5,000.
Even more compelling is the challenge to a 3.7-year descending trendline. This long-term resistance has capped Ethereum's upward movements for years. A decisive weekly close above this trendline would be a major technical victory for the bulls, invalidating the long-term bearish structure and opening the door for a parabolic advance. Technical analysts often view the breach of such a long-standing trendline as a powerful signal of a major trend reversal and the beginning of a new bull market phase.
Should Ethereum successfully break out of its current consolidation and clear the $4,000 to $4,200 resistance zone, chart analysis suggests there is very little historical resistance until the $4,800 to $5,000 range. Some of the more bullish forecasts, looking at the ETH/BTC trading pair and other long-term models, even project potential targets between $7,300 and $10,000 in this market cycle.
Despite the overwhelmingly bullish picture, the path to new all-time highs is unlikely to be a straight line. The $4,000 level has proven to be a formidable barrier. Recently, Ethereum's price was firmly rejected near this psychological milestone, leading to a period of cooling volatility and raising concerns about a potential short-term selloff. The failure to break through has caused some buying pressure to weaken, and on-chain data has shown a temporary decrease in large whale transactions following the rejection.
This price action highlights the classic tug-of-war between buyers and sellers at a key resistance level. Some traders who have enjoyed the 75% run-up may be tempted to take profits, creating selling pressure. The Relative Strength Index (RSI), a momentum indicator, has also shown signs of being "overheated," suggesting that a period of consolidation or a minor correction could be healthy and necessary before the next leg up.
However, a key positive sign is that despite the rejection, buyers have not given up much ground. The price has continued to consolidate just below the resistance area, indicating that dips are being bought and that underlying demand remains strong. This type of price action, where an asset persistently hovers near a major resistance level without a significant pullback, is often a precursor to an eventual breakout.
Crucially, while retail sentiment and short-term trading metrics might show some hesitation, the institutional tide shows no sign of ebbing. Spot ETF inflows have remained consistently positive, providing a steady stream of buying pressure that counteracts short-term selling. This suggests that while there may be some turbulence in the immediate future, the larger, more powerful trend is being driven by long-term institutional accumulators who are less concerned with short-term price swings.
In conclusion, Ethereum finds itself at a historic crossroads, propelled by a perfect storm of fundamental and technical tailwinds. The narrative is no longer just about its technological promise as a world computer but about its emergence as a mature, institutional-grade asset. The vocal support of financial titans like Mike Novogratz, the verifiable flood of institutional capital through ETFs, and the strategic shift by corporations to hold ETH in their treasuries are creating a demand shock of unprecedented scale.
This is being met with a supply that is increasingly constrained, thanks to staking and the aggressive accumulation by these new, large players. On-chain data confirms this story, with volumes and whale activity reaching levels not seen since the last bull market peak. As Bitcoin's dominance wanes, Ethereum is stepping into the spotlight, ready to lead the next phase of the market cycle.
While the $4,000 resistance remains a key hurdle to overcome, and short-term volatility is to be expected, the underlying forces at play suggest a powerful current pulling Ethereum towards new horizons. The "quiet takeover" is becoming louder by the day. A breakout above $4,000 could unleash a wave of price discovery, potentially pushing Ethereum to $5,000 and beyond, and in the process, reshaping the very landscape of the digital asset ecosystem. The stage is set for Ethereum's ascent, and the world is watching.
Bitcoin Correction Maturing – Long Setup Brewing!Bitcoin ( BINANCE:BTCUSDT ) has fallen by more than -4% over the past day.
Let's take a look at the reasons for the decline.
One of the key reasons behind Bitcoin’s decline in the past 24 hours ( July 25 ) could be the reduced likelihood of Jerome Powell being replaced as Chair of the Federal Reserve.
In recent days, market participants were speculating that Donald Trump might replace Powell — a scenario that was considered bullish for risk assets like Bitcoin. However, recent reports of a meeting between Trump and Powell, and signs that Powell might not be dismissed, have weakened this fundamental narrative.
This meeting may signal a truce or reduced tension between Trump’s team and Powell , which could imply a continuation of current Fed policies. That’s bad news for Bitcoin, as it removes a potential psychological tailwind from the market and dampens speculative sentiment.
As a result:
Over $500 million in liquidations(Long Positions) occurred
Weak inflows into Bitcoin ETFs
A stronger U.S. Dollar Index ( TVC:DXY )
And declining Gold( OANDA:XAUUSD ) prices over the past two days
all added additional selling pressure on BTC. Now let's take a look at Bitcoin's conditions on the 4-hour time frame .
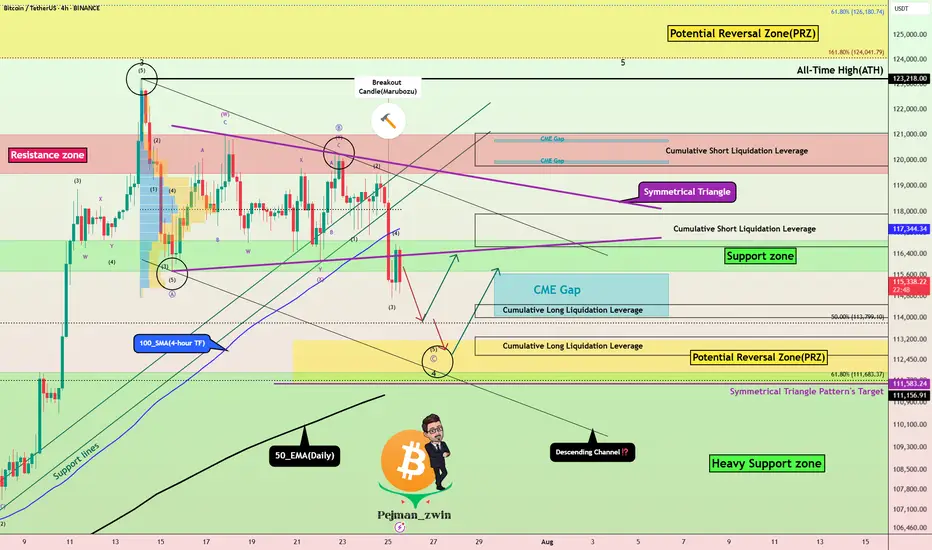
Bitcoin currently appears to have broken the Support zone($116,900-$115,730) , Support lines , 100_SMA(4-hour TF) , and the lower line of the Symmetrical Triangle Pattern with a bearish Marubozu candle .
Note : In general, trading was difficult when Bitcoin was inside a symmetrical triangle (about 10 days).
It also seems that the pullback to these zones has ended and Bitcoin is waiting for the next decline .
In terms of Elliott Wave theory , Bitcoin appears to be completing microwave 5 of microwave C of major wave 4 . There is a possibility that main wave 4 will create a descending channel and complete at the bottom of the descending channel (at Potential Reversal Zone(PRZ) ).
I expect Bitcoin to start rising again after completing the CME Gap($115,060-$114,947) from Cumulative Long Liquidation Leverage($114,480-$114,000) or Cumulative Long Liquidation Leverage($113,284-$112,603) near the PRZ and Heavy Support zone($111,980-$105,820) .
Cumulative Short Liquidation Leverage: $117,904-$116,665
Cumulative Short Liquidation Leverage: $121,046-$119,761
Do you think Bitcoin has entered a major correction, or does it still have a chance to create a new ATH?
Please respect each other's ideas and express them politely if you agree or disagree.
Bitcoin Analyze (BTCUSDT), 4-hour time frame.
Be sure to follow the updated ideas.
Do not forget to put a Stop loss for your positions (For every position you want to open).
Please follow your strategy and updates; this is just my Idea, and I will gladly see your ideas in this post.
Please do not forget the ✅' like '✅ button 🙏😊 & Share it with your friends; thanks, and Trade safe.
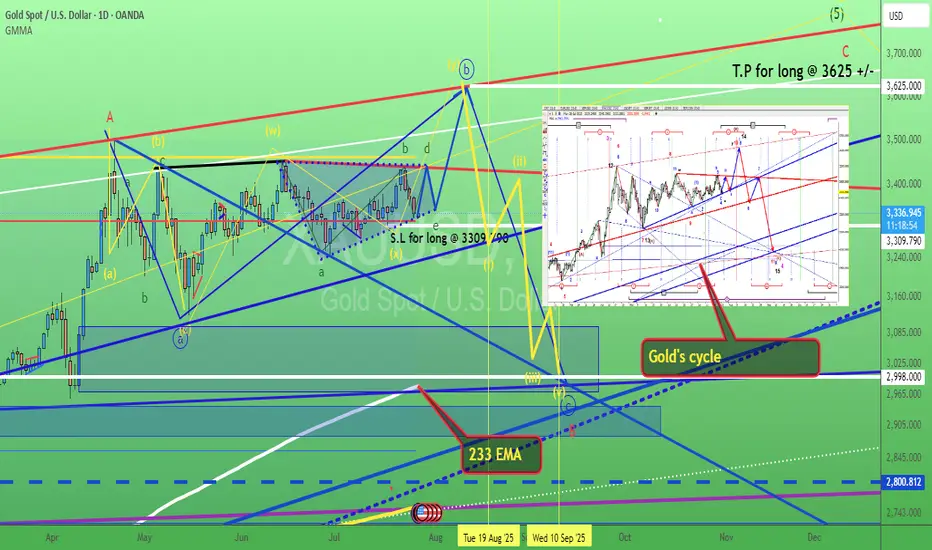
Gold. Bull Trap "triangle". 28/July/25XAUUSD, by checking gold latest speed of chart with its cycle. we might have a bull 'trap" triangle. A base for rallying to ATH again before a very deep pullback toward 233 Daily EMA which have not been "touched" for long time...
LUPINLupin Fut broke out of classic descending triangle pattern on daily charts with all 3 indicators suggesting strong buy.
Risk:Reward 1:3
Could b bough wih mentioned stoploss & targets.
