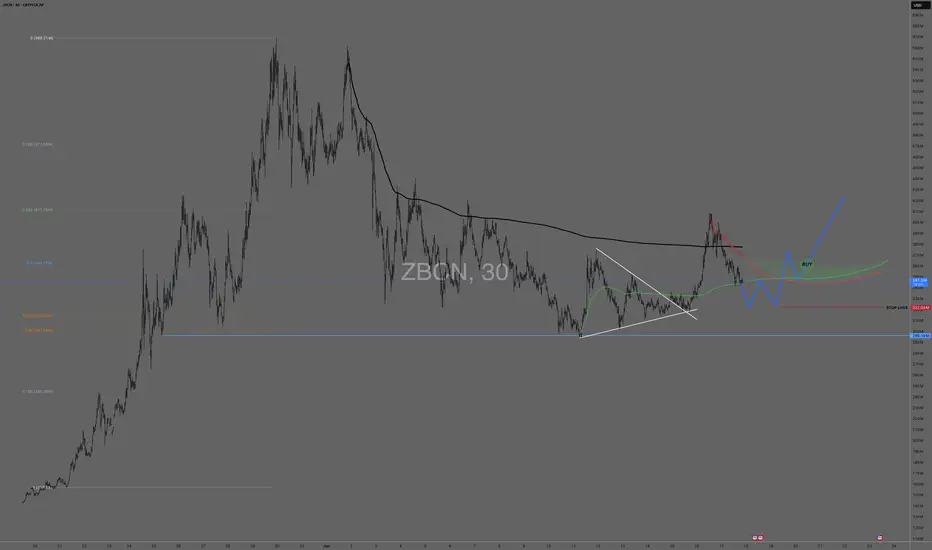
ZBCN: Looking for support to hold and AVWAP's regained
CRYPTOCAP:ZBCN
D/30m chart
We have had out first real pullback on the daily. It's holding the midline, held the GP. I played the break of the triangle on Sunday and took it to the ATH AVWAP (black). I'm wanting the same squeeze that threw that triangle north to hold as support now as buyers defend their positions.
I want to see a shake out below that green AVWAP, I want it to hold and proceed higher. then and only then do we stalk our entry.
I want a break and a pullback test of that red/green AVWAP. If I see that, its a buy on the other side of the "V".
Triangle
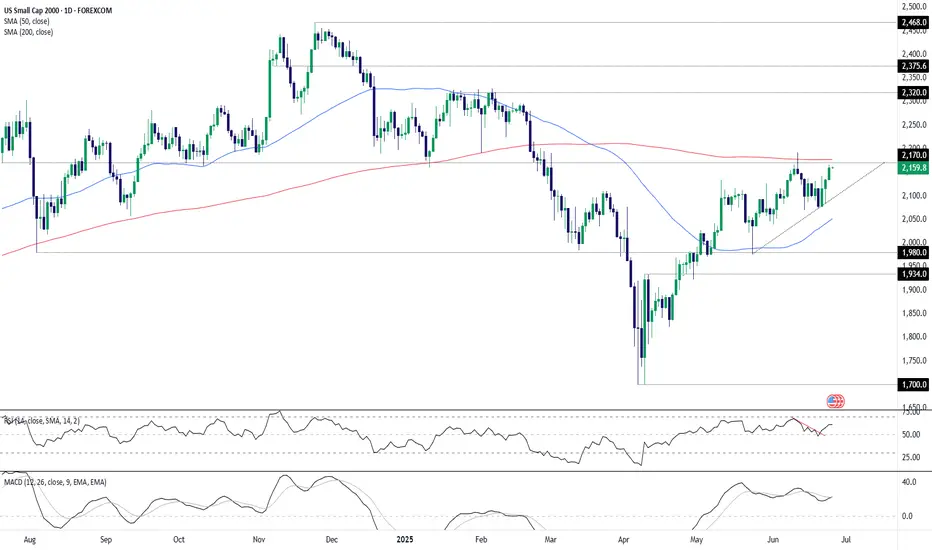
U.S. Small Caps Eye Breakout as Fed Rate Cut Bets BuildUnless it’s accompanied by a recession, there are few things U.S. small cap stocks enjoy more than rate cuts—especially given how many rely on the kindness of others to fund their growth ambitions. With another soft core PCE report expected at the end of the week, and with some Fed officials signalling a preparedness to cut rates again as soon as July, the ducks look to be lining up for a potential bullish break in the U.S. Small Cap 2000.
Recent price action backs this up, coiling within an ascending triangle on the daily chart just beneath horizontal resistance at 2170 and the key 200-day moving average just above. Price momentum is also on board, with RSI (14) breaking its downtrend and moving further above 50. MACD has crossed the signal line above zero, reinforcing the bullish message.
One look at how price has interacted with the 200-day moving average in the past suggests the higher probability play would be to wait for a break and close above the level before establishing longs, allowing a stop to be placed beneath it or 2170 for protection against reversal.
2320 looms as an obvious target, coinciding with a known resistance level. If hit, traders can assess whether to cut, hold or reverse the trade depending on how price reacts at that level.
Good luck!
DS
OLLI - 6 months ASCENDING TRIANGLE══════════════════════════════
Since 2014, my markets approach is to spot
trading opportunities based solely on the
development of
CLASSICAL CHART PATTERNS
🤝Let’s learn and grow together 🤝
══════════════════════════════
Hello Traders ✌
After a careful consideration I came to the conclusion that:
- it is crucial to be quick in alerting you with all the opportunities I spot and often I don't post a good pattern because I don't have the opportunity to write down a proper didactical comment;
- since my parameters to identify a Classical Pattern and its scenario are very well defined, many of my comments were and would be redundant;
- the information that I think is important is very simple and can easily be understood just by looking at charts;
For these reasons and hoping to give you a better help, I decided to write comments only when something very specific or interesting shows up, otherwise all the information is shown on the chart.
Thank you all for your support
🔎🔎🔎 ALWAYS REMEMBER
"A pattern IS NOT a Pattern until the breakout is completed. Before that moment it is just a bunch of colorful candlesticks on a chart of your watchlist"
═════════════════════════════
⚠ DISCLAIMER ⚠
Breakout Area, Target, Levels, each line drawn on this chart and any other content represent just The Art Of Charting’s personal opinion and it is posted purely for educational purposes. Therefore it must not be taken as a direct or indirect investing recommendations or advices. Entry Point, Initial Stop Loss and Targets depend on your personal and unique Trading Plan Tactics and Money Management rules, Any action taken upon these information is at your own risk.
═════════════════════════════

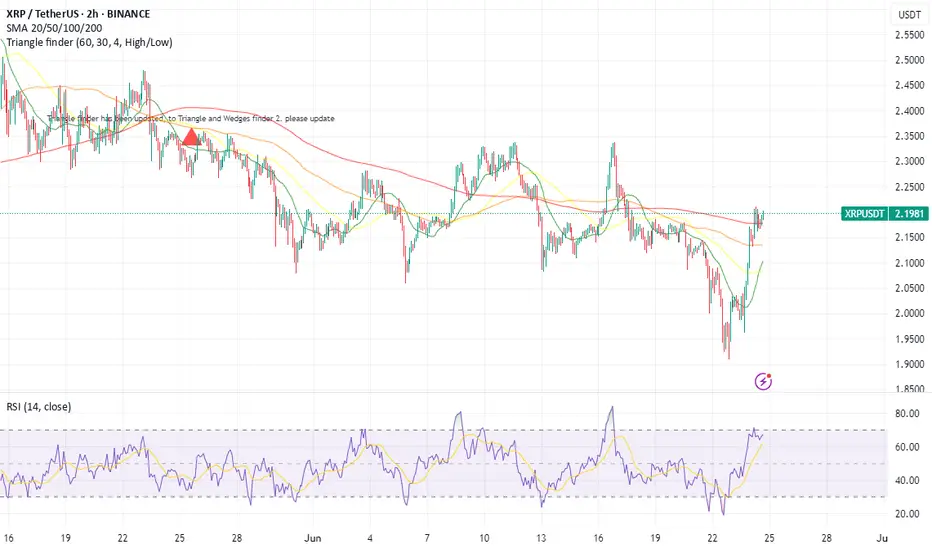
XRP Price Soars Past $2.15: Next Stop $2.38? XRP Price Prediction: What’s Next After Breaking $2.15 Resistance?
Ripple’s XRP has been making waves in the cryptocurrency market, recently breaking above the critical $2.15 resistance level and surging nearly 8% in the last 24 hours to trade at $2.18. With a further 9% climb in recent sessions and open interest jumping to $3.77 billion, the coin is showing strong bullish momentum. Analysts are now eyeing targets of $2.33 and even $2.38 in the near term. But what lies ahead for XRP after this breakout? Is this the start of a sustained rally, or could resistance at higher levels cap the gains?
________________________________________
XRP Price Action: Breaking Key Resistance at $2.15
XRP’s recent price surge has caught the attention of traders and investors alike. After trading in a consolidation range for weeks, the cryptocurrency initiated a fresh increase from the $1.92 zone, gaining momentum as it approached the $2.00 level. A significant development came when XRP broke above a key bearish trend line with resistance at $2.00 on the hourly chart of the XRP/USD pair (data sourced from Kraken). This breakout was followed by a decisive move past the $2.15 resistance, a level that had previously capped upward movements.
Currently, XRP trades above $2.18, sitting comfortably above the 100-hourly Simple Moving Average (SMA), a widely watched indicator of short-term trend direction. The price action over the last 24 hours shows an 8.2% increase, with some sessions recording gains as high as 14%, particularly following geopolitical developments like the Iran-Israel ceasefire, which boosted risk assets across markets. This recovery from the $1.90 low demonstrates strong buying interest and renewed confidence in XRP’s potential.
The immediate question for traders is whether XRP can sustain this momentum. The next resistance zone lies between $2.20 and $2.33, with some analysts even targeting $2.38 based on rising open interest and market volume. A close above $2.18 in the coming hours could signal the start of another leg up, while failure to hold this level might see a pullback toward $2.10 or lower.
________________________________________
Technical Analysis: Bullish Indicators and Key Levels to Watch
To understand XRP’s potential trajectory, let’s dive into the technical indicators and key levels shaping its price action.
Support and Resistance Levels
• Support: The $2.10 level, previously a resistance, now acts as a near-term support alongside the 100-hourly SMA. A break below this could see XRP test the $2.05 zone, with further downside potential to $1.92 if bearish pressure mounts.
• Resistance: The immediate hurdle lies at $2.20, a psychological barrier that has historically posed challenges. Beyond this, $2.33 emerges as a critical target, as breaking this level could confirm a short-term bullish continuation. Analysts also highlight $2.38 as a feasible target if momentum persists.
Moving Averages and Trend Indicators
XRP’s position above the 100-hourly SMA is a bullish sign, indicating that buyers are in control of the short-term trend. Additionally, the price recently crossed above the 50-hourly SMA during its 14% surge, further reinforcing the bullish outlook. The convergence of these moving averages suggests that a golden cross—a bullish signal where a shorter-term average crosses above a longer-term average—could be forming on lower timeframes, potentially attracting more buyers.
Relative Strength Index (RSI)
The RSI on the hourly chart currently sits around 65, indicating that XRP is approaching overbought territory but still has room to run before reaching extreme levels (above 70). This suggests that the current rally could extend further, provided no major negative catalysts emerge.
Volume and Open Interest
One of the most encouraging signs for XRP bulls is the surge in trading volume and open interest. Open interest in XRP futures has jumped to $3.77 billion, reflecting growing speculative interest and confidence in further price gains. High volume accompanying the breakout above $2.15 adds credibility to the move, as it indicates genuine market participation rather than a low-liquidity pump.
Symmetrical Triangle Pattern
On the longer-term charts, XRP has been forming a 334-day symmetrical triangle, a consolidation pattern often preceding major breakouts. Analysts predict that this pattern could resolve between July and September 2025, with potential targets ranging from $2 to $5 depending on the direction of the breakout. The recent move above $2.15 could be an early indication of bullish intent, though confirmation of a full breakout from the triangle remains months away.
________________________________________
XRP Price Prediction: Short-Term Outlook (Next 24-48 Hours)
Given the current momentum, XRP appears poised for further gains in the immediate term. Analysts predict a potential 7% move toward $2.33 within the next 24 hours if the price maintains its position above $2.18. This target aligns with the upper boundary of the recent trading range and represents a key Fibonacci retracement level from the prior downtrend.
However, traders should remain cautious of the $2.20 resistance zone, where selling pressure could emerge. A failure to close above this level on the hourly or 4-hour charts might trigger profit-taking, leading to a pullback toward $2.10 or $2.05. On the flip side, a decisive break above $2.20 with strong volume could pave the way for a test of $2.33 and potentially $2.38 in the coming days.
________________________________________
What XRP Users Are Talking About This Week: Rumors, Predictions, and Debates
The XRP community has been abuzz with discussions this week, fueled by the coin’s impressive price action and broader market developments. Here are some of the key topics dominating conversations on platforms like Twitter, Reddit, and crypto forums:
1. Geopolitical Impact on XRP: The recent Iran-Israel ceasefire has been credited with boosting risk-on sentiment across markets, including cryptocurrencies. Many XRP holders believe this event contributed to the 14% surge that saw the price reclaim $2.00, with some speculating that further de-escalation could drive additional gains.
2. Regulatory Clarity for Ripple: Ongoing debates about Ripple’s legal battle with the U.S. Securities and Exchange Commission (SEC) continue to influence sentiment. While a resolution seems closer than ever, with rumors of a potential settlement circulating, uncertainty remains a key concern. A favorable outcome could act as a major catalyst for XRP, potentially pushing it toward new highs.
3. Adoption and Utility: XRP users are excited about Ripple’s continued partnerships with financial institutions for cross-border payments. Recent announcements of pilot programs in new regions have fueled speculation that increased adoption could drive organic demand for XRP, supporting long-term price appreciation.
4. Price Predictions: Community predictions range from conservative targets of $2.50 in the near term to more ambitious forecasts of $5 or higher by the end of 2025. Much of this optimism hinges on the symmetrical triangle breakout expected next year, as well as broader market trends like the Bitcoin halving in 2024.
These discussions highlight the mix of optimism and caution within the XRP community. While the recent breakout has bolstered confidence, many users remain wary of external factors like regulatory developments and macroeconomic conditions that could impact the coin’s trajectory.
________________________________________
XRP Climbs 9% as Open Interest Jumps to $3.77B: Eyes $2.38 Target
XRP’s 9% climb in a recent session, coupled with open interest soaring to $3.77 billion, underscores the growing interest from both retail and institutional traders. Open interest represents the total value of outstanding derivative contracts, and its sharp increase suggests that market participants are betting on continued price movement—likely to the upside given the current trend.
This surge in open interest aligns with XRP’s break above $2.15, reinforcing the notion that the rally has strong backing. Analysts now eye a $2.38 target, which corresponds to the 61.8% Fibonacci retracement level from the previous major swing high to low. Achieving this target would require sustained buying pressure and a break above the $2.33 resistance, but the current market dynamics suggest it’s within reach if no major sell-offs occur.
However, high open interest also introduces the risk of volatility. If the price fails to break higher and sentiment shifts, a wave of liquidations could amplify downside moves. Traders should monitor funding rates on futures platforms to gauge whether speculative positions are becoming overly leveraged, as this could signal an impending correction.
________________________________________
Ceasefire Boosts XRP Recovery: Bullish Continuation
Above $2.33?
The geopolitical landscape has played a surprising role in XRP’s recent recovery. Following a low of $1.90 amid broader market uncertainty, the announcement of a ceasefire between Iran and Israel injected optimism into risk assets, including cryptocurrencies. XRP responded with a 14% jump to reclaim the $2.00 level, a move that has since solidified with the break above $2.15.
This recovery highlights XRP’s sensitivity to external catalysts. While technical factors like resistance levels and chart patterns drive day-to-day price action, macro events can act as significant tailwinds or headwinds. If the ceasefire holds and global markets remain stable, XRP could see continued buying interest from investors seeking exposure to high-growth assets.
The key level to watch now is $2.33. A break above this resistance with strong volume could confirm a short-term bullish continuation, potentially targeting $2.38 or higher. Conversely, if geopolitical tensions resurface or broader market sentiment sours, XRP might struggle to maintain its gains, with $2.10 acting as the first line of defense.
________________________________________
When Will XRP Price Hit All-Time High? Timeline Revealed
XRP’s all-time high (ATH) of $3.84, reached during the 2017-2018 bull run, remains a distant target for many holders. However, recent technical developments and market trends provide clues about when the coin might approach or surpass this level.
Symmetrical Triangle Breakout: July–September 2025
As mentioned earlier, XRP has been forming a 334-day symmetrical triangle on the weekly chart, a pattern characterized by converging trendlines as price swings narrow over time. Such patterns often precede significant breakouts, with the direction determined by market sentiment at the time of resolution. Analysts predict that this triangle could break between July and September 2025, offering a window for a major price move.
If the breakout is bullish, targets range from $2 (a conservative estimate based on prior resistance) to $5 (a more optimistic projection based on the triangle’s height). A $5 target would represent a new ATH, surpassing the 2018 peak by over 30%. This scenario assumes favorable market conditions, including a broader crypto bull run potentially triggered by the Bitcoin halving in 2024.
Factors Influencing an ATH
Several factors could influence whether XRP reaches a new ATH within this timeline:
• Regulatory Resolution: A positive outcome in Ripple’s SEC lawsuit could remove a major overhang, unlocking significant upside potential.
• Market Cycles: Crypto markets often follow cyclical patterns, with bull runs occurring every 3-4 years. If 2025 aligns with the next cycle peak, XRP could ride the wave to new highs.
• Adoption Growth: Increased use of XRP for cross-border payments through RippleNet could drive organic demand, supporting a higher price floor.
• Macro Environment: Favorable economic conditions, such as low interest rates or stimulus measures, could boost risk assets like XRP.
While predicting an exact date for an ATH is impossible, the July–September 2025 window provides a reasonable timeframe for a potential breakout. Investors should remain attentive to technical confirmation and external catalysts as this period approaches.
________________________________________
XRP Price Reclaims Key Resistance: Are More Gains on the Horizon?
XRP’s reclaiming of the $2.10 and $2.15 levels marks a significant milestone in its recovery from the $1.92 low. This move above key resistance zones suggests that bullish momentum is building, with the potential for further gains if higher levels are breached.
The price is now trading above $2.18, and a close above $2.20 could signal the start of a fresh increase. However, the $2.20-$2.33 range remains a critical battleground. Bulls will need to defend recent gains while pushing for a decisive break above these levels to confirm the next leg up. If successful, targets of $2.38 and beyond come into play, aligning with analyst predictions and Fibonacci extensions.
On the downside, a failure to hold $2.10 could see XRP retest lower supports at $2.05 or $1.92. Such a pullback would not necessarily invalidate the bullish trend but could delay the anticipated rally toward higher targets. Traders should use stop-loss orders and monitor volume trends to manage risk during this volatile period.
________________________________________
Long-Term XRP Price Prediction: $2 to $5 by 2025?
Looking beyond the immediate term, XRP’s long-term outlook remains optimistic, contingent on several key developments. The symmetrical triangle pattern, if resolved bullishly, could propel XRP toward $2-$5 by the end of 2025. This range accounts for both conservative and aggressive scenarios, with the higher end assuming a full market cycle peak and positive catalysts like regulatory clarity.
Even in a more cautious scenario, XRP appears well-positioned to reclaim its prior highs above $3 if adoption continues to grow and broader crypto sentiment remains favorable. Key drivers include Ripple’s expansion into new markets, potential listings on major exchanges post-SEC resolution, and technological upgrades to the XRP Ledger that enhance scalability and utility.
However, risks remain. Regulatory setbacks, competition from other payment-focused cryptocurrencies, and macroeconomic downturns could cap XRP’s upside. Investors with a long-term horizon should diversify their portfolios and remain adaptable to changing market conditions.
________________________________________
Conclusion: XRP’s Path Forward After $2.15 Breakout
XRP’s recent breakout above the $2.15 resistance has ignited optimism among traders and investors, with the coin now trading at $2.18 after an 8.2% surge in 24 hours. Technical indicators like the 100-hourly SMA and rising open interest of $3.77 billion support a bullish near-term outlook, with targets of $2.33 and $2.38 in sight if momentum holds. The geopolitical boost from the Iran-Israel ceasefire and ongoing community discussions about adoption and regulation further fuel the narrative of potential gains.
In the short term, XRP must overcome resistance at $2.20 to confirm the next leg up, while holding support at $2.10 to avoid a pullback. Looking further ahead, the symmetrical triangle pattern suggests a major breakout window between July and September 2025, with price targets ranging from $2 to $5—potentially marking a new all-time high if conditions align.
While challenges like regulatory uncertainty and market volatility persist, XRP’s current trajectory indicates that more gains could be on the horizon. Traders and investors should stay vigilant, monitoring key levels, volume trends, and external catalysts to capitalize on this evolving opportunity. Whether XRP sustains its rally or faces a correction, one thing is clear: the cryptocurrency remains a focal point of excitement and speculation in the ever-dynamic crypto market.
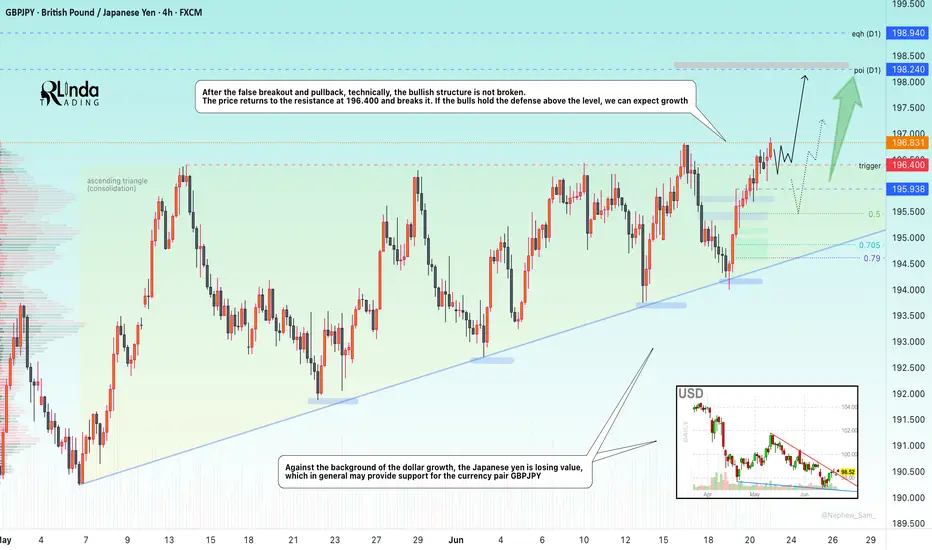
GBPJPY → Assault on the resistance 196.400FX:GBPJPY under the pressure of the bull market breaks through the resistance with the aim of possible continuation of growth and retest of the liquidity zone
Against the background of the dollar growth, the Japanese yen is losing value, which in general may provide support for the currency pair GBPJPY
The currency pair, after a false breakout of the key resistance and a small correction, technically, the bullish structure has not broken. The price returns to the resistance at 196.400 and breaks it. If the bulls hold their defenses above the level, we can expect a rise
Resistance levels: 196.400, 198.24
Support levels: 195.94, 195.45
Consolidation above 196.400, retest and break of 196.93 may trigger continuation of the growth. Zones of interest 198.24, 198.94
Regards R. Linda!
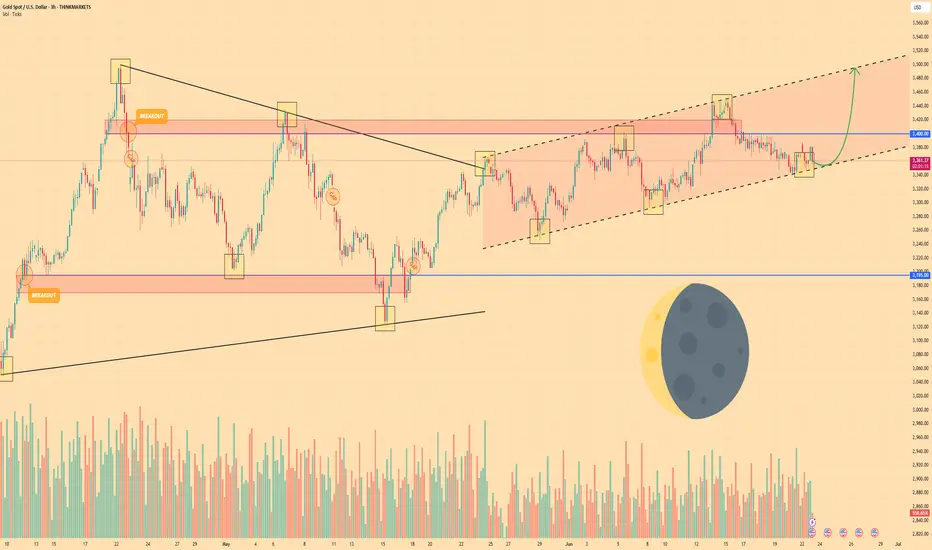
GOLD - Price can rise in channel to $3495 resistance lineHi guys, this is my overview for XAUUSD, feel free to check it and write your feedback in comments👊
After price started to trades inside triangle, it made an impulse up, breaking two levels, after which turned around.
Price dropped to $3195 level, breaking resistance level, and made a first gap, after which rose to resistance line.
Then Gold in a short time declined to support line, making a two gaps again and then bounced up from support line.
Gold exited from triangle and continued to move up inside rising channel, where it first made a correction.
In channel, price grew higher than $3400 level, but recently turned around and fell to support line.
Now, I expect that Gold can bounce from this line and rise to $3495 resistance line, breaking resistance level.
If this post is useful to you, you can support me with like/boost and advice in comments❤️
Disclaimer: As part of ThinkMarkets’ Influencer Program, I am sponsored to share and publish their charts in my analysis.
HelenP. I Gold may continue to decline to support levelHi folks today I'm prepared for you Gold analytics. After dropping from the support zone, the price of Gold found temporary support near the trend line and started to rise again. The upward movement was sharp and even created a gap while breaking through the previous support level, which then acted as resistance. For some time, the price hovered around this resistance area but failed to gain enough strength to break higher. Eventually, Gold pulled back to the trend line and began consolidating within a triangle pattern. Inside this structure, it managed to break above the resistance zone again, but this breakout turned out to be false. The price quickly reversed and dropped, breaking through the resistance level and exiting the triangle to the downside. This breakdown also shows that the bullish momentum has weakened significantly. Now, Gold is trading near the trend line again, showing hesitation and a lack of strong bullish continuation. Given this technical behavior, I expect a small rise toward the trend line, followed by a continued drop toward the support level at 3320. That’s the area I’m watching as my current goal. If you like my analytics you may support me with your like/comment ❤️
Disclaimer: As part of ThinkMarkets’ Influencer Program, I am sponsored to share and publish their charts in my analysis.

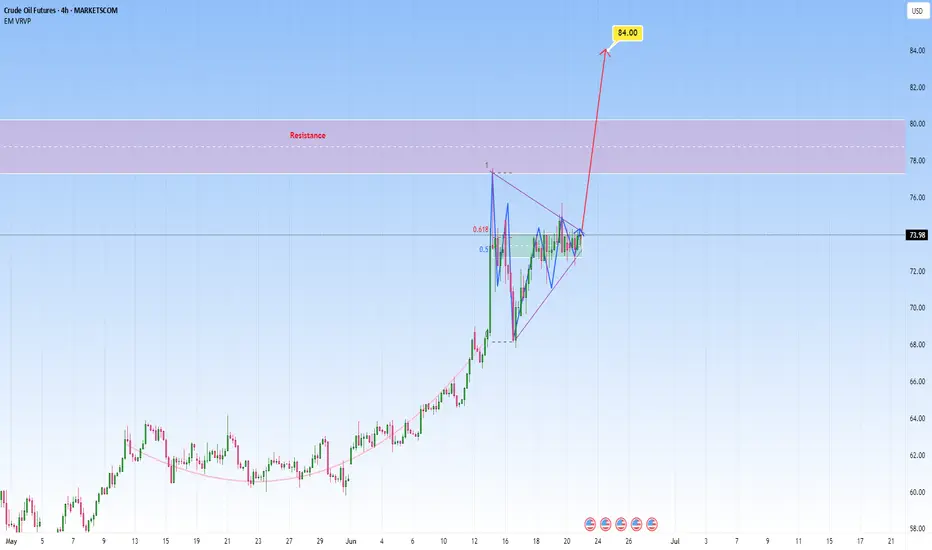
|Symmetrical Triangle| Squeeze in Crude OilCrude oil is currently forming a symmetrical triangle pattern, a classic squeeze formation with price compressed into a tight range. Symmetrical triangles typically act as continuation patterns, favoring the prevailing trend, and in this case, on the daily chart, the trend is well established: a bullish trend with high volume. As the dominant trend is clearly bullish, and volume has remained relatively high throughout the consolidation, it supports furthermore the potential for continuation to the upside.
On the Bollinger band the squeeze is more visible, and suggests diminishing volatility, which is often followed by expansion. Unlike earlier price action before consolidation, recent sessions are exhibiting larger candlestick bodies accompanied by pronounced wicks on both ends. Meaning adding confluence to our potential breakout. These conditions create a buildup of potential momentum in the market, exactly what fuels explosive breakouts when key levels are breached.
Though such pattern can also serve as a reversal signal when broader macro conditions shift.
But, and this is a big but, beyond the chart, the geopolitical context is intensifying. The Israel-Iran conflict continues to escalate, and with the most recent reports of direct US involvement, that is the strikes on Iranian nuclear infrastructure, the risk on crude oil is rising. The possibility of Iranian retaliation, introduces serious potential for supply disruption, as any military response or blockade would likely trigger a sharp spike in the price.
This confluence of technical breakout potential and geopolitical instability makes this setup particularly potent. If we get a confirmed breakout above the triangle and a clean close above the 77–79 zone, combined with global uncertainty and potential supply shocks, could put the $84-85 target well within reach in the near term. Beyond that, should geopolitical tension escalate, oil could accelerate toward $90 or even $100.
In short, this is a high-stakes moment. If price does break out, it won’t just be a technical move, it will ride a wave of volume, volatility, and geopolitical narrative.
With all this in mind, one should be watching closely for volume confirmation, breakout structure, and any major headlines from the Middle East as the situation develops.
2 potential breakout targets for the symmetrical triangle on xrpDepends on if the green trendline is the more valid top trendline or the light blue one is. *not financial advice*

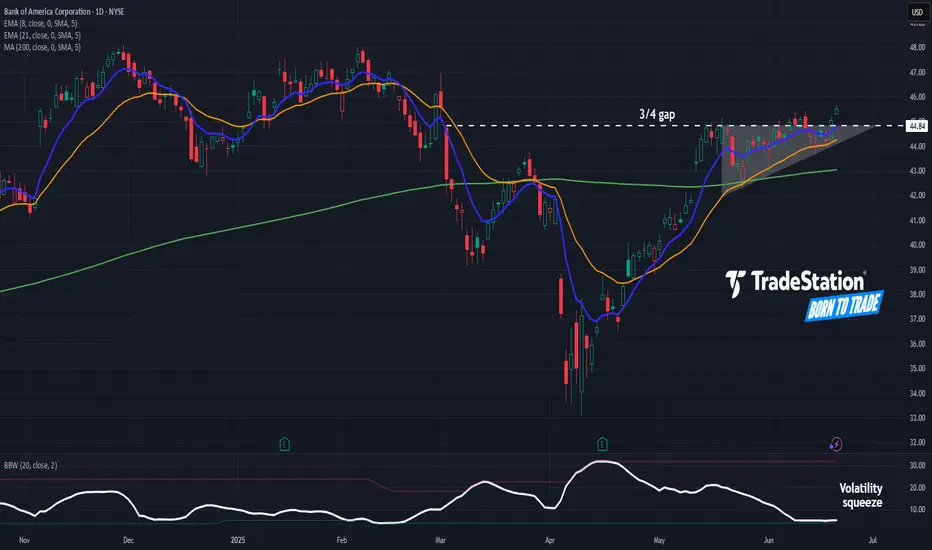
Bank of America: Potential BreakoutBank of America squeezed into a range, and now it may be breaking out.
The first pattern on today’s chart is $44.84, the high on March 4 as the megabank gapped lower.
It spent more than a month pushing against that level while making higher lows. The resulting ascending triangle is a potentially bullish continuation pattern.
Second, BAC closed above the resistance on Friday and is now potentially entering the gap from March 4. Is a breakout underway?
Third, Bollinger Bandwidth has narrowed. That may create potential for prices to expand following a period of compression.
Next, the 8-day exponential moving average (EMA) has remained above the 21-day EMA. Prices have also held above their 200-day simple moving average. Those signals may reflect bullishness in the short and long terms.
Finally, BAC is an active underlier in the options market. Its 122,000 average daily contracts in the last month rank 23rd in the S&P 500, according to TradeStation data. That could help traders take positions with calls and puts.
Check out TradingView's The Leap competition sponsored by TradeStation.
TradeStation has, for decades, advanced the trading industry, providing access to stocks, options and futures. If you're born to trade, we could be for you. See our Overview for more.
Past performance, whether actual or indicated by historical tests of strategies, is no guarantee of future performance or success. There is a possibility that you may sustain a loss equal to or greater than your entire investment regardless of which asset class you trade (equities, options or futures); therefore, you should not invest or risk money that you cannot afford to lose. Online trading is not suitable for all investors. View the document titled Characteristics and Risks of Standardized Options at www.TradeStation.com . Before trading any asset class, customers must read the relevant risk disclosure statements on www.TradeStation.com . System access and trade placement and execution may be delayed or fail due to market volatility and volume, quote delays, system and software errors, Internet traffic, outages and other factors.
Securities and futures trading is offered to self-directed customers by TradeStation Securities, Inc., a broker-dealer registered with the Securities and Exchange Commission and a futures commission merchant licensed with the Commodity Futures Trading Commission). TradeStation Securities is a member of the Financial Industry Regulatory Authority, the National Futures Association, and a number of exchanges.
Options trading is not suitable for all investors. Your TradeStation Securities’ account application to trade options will be considered and approved or disapproved based on all relevant factors, including your trading experience. See www.TradeStation.com . Visit www.TradeStation.com for full details on the costs and fees associated with options.
Margin trading involves risks, and it is important that you fully understand those risks before trading on margin. The Margin Disclosure Statement outlines many of those risks, including that you can lose more funds than you deposit in your margin account; your brokerage firm can force the sale of securities in your account; your brokerage firm can sell your securities without contacting you; and you are not entitled to an extension of time on a margin call. Review the Margin Disclosure Statement at www.TradeStation.com .
TradeStation Securities, Inc. and TradeStation Technologies, Inc. are each wholly owned subsidiaries of TradeStation Group, Inc., both operating, and providing products and services, under the TradeStation brand and trademark. When applying for, or purchasing, accounts, subscriptions, products and services, it is important that you know which company you will be dealing with. Visit www.TradeStation.com for further important information explaining what this means.
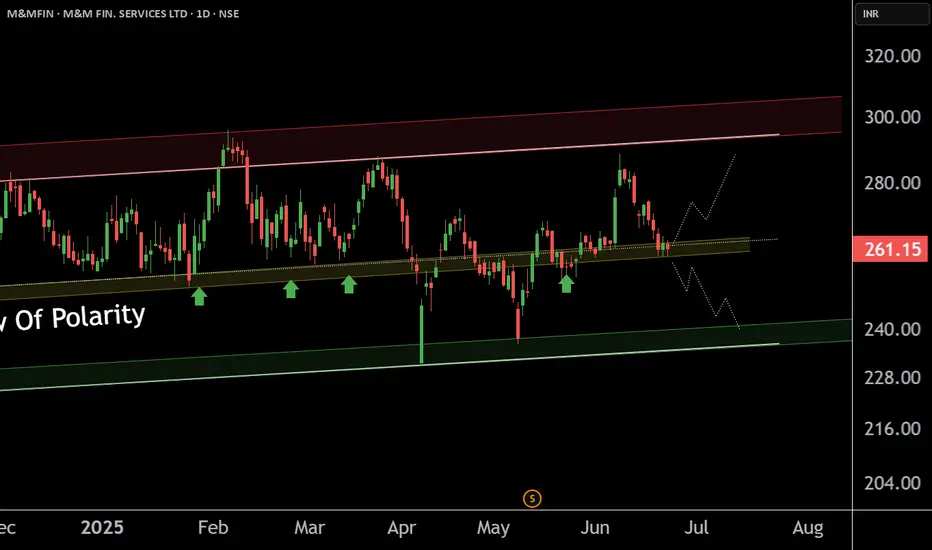
M&M FIN. SERVICE LTD at Key Zone this is the Daily chart of M&M FIN. SERVICE LTD
M&MFIN having a good law of polarity at 255-260 level .
If this level is sustain ,then we may see higher prices in M&MFIN and if stock sustain below this level then M&MFIN will touch it's support zone 240 level.
Thank you !!
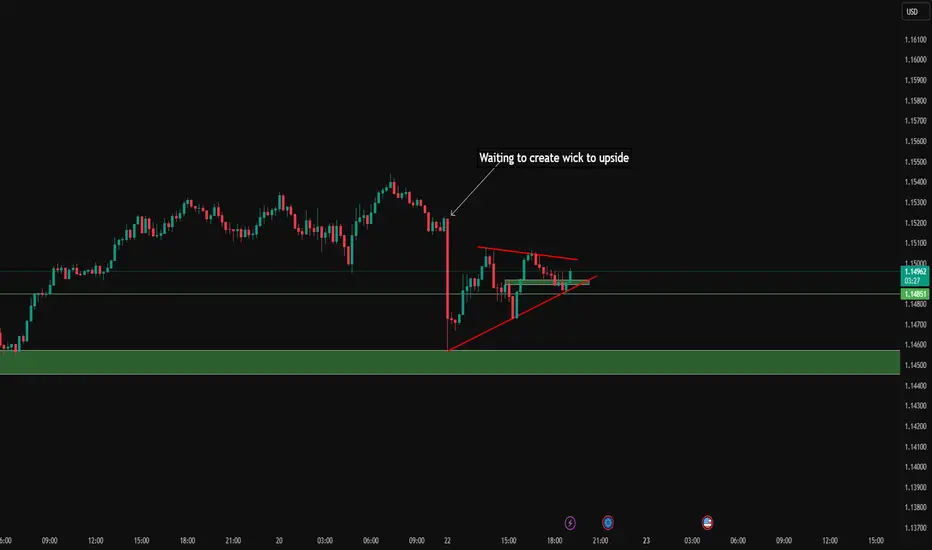
EURUSD Advanced Price Action PatternEURUSD is forming a price action pattern on the 5 minute timeframe, this pattern usually results in a breakout. I am thinking this breakout will be bullish and result in creating a top wick for the daily candle.
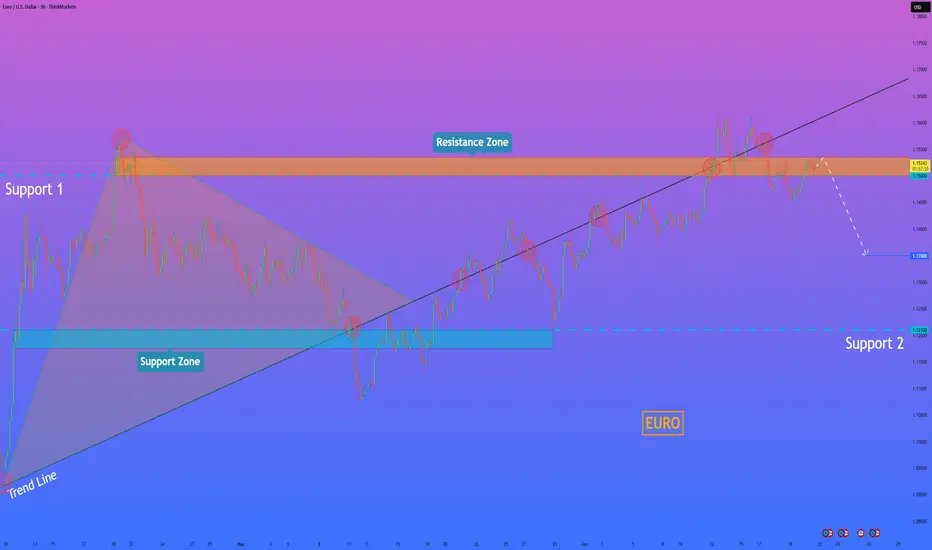
HelenP. I Euro will break resistance level and continue to fallHi folks today I'm prepared for you Euro analytics. On this chart, we can see how price initially moved inside a triangle formation, forming higher lows from the trend line and testing the resistance zone multiple times. Eventually, price broke out to the downside, falling sharply and breaking through the lower boundary of the triangle and also the trend line, signaling a shift in market sentiment. After touching the support zone and forming a temporary bottom, the pair started climbing back up, but this movement was more of a correction than a trend reversal. Price respected the trend line from below and followed it upward, but failed to break significantly higher. It managed to push above both support 2 and support 1 levels, which now act as resistance. Currently, EURUSD is trading inside the resistance zone, where previous reactions have led to strong bearish impulses. Given this behavior and the recent false breakout, I expect the price to rebound from this area and break back below support. My goal is set at 1.1350, anticipating further downside movement as the bearish structure remains valid. If you like my analytics you may support me with your like/comment ❤️
Disclaimer: As part of ThinkMarkets’ Influencer Program, I am sponsored to share and publish their charts in my analysis.
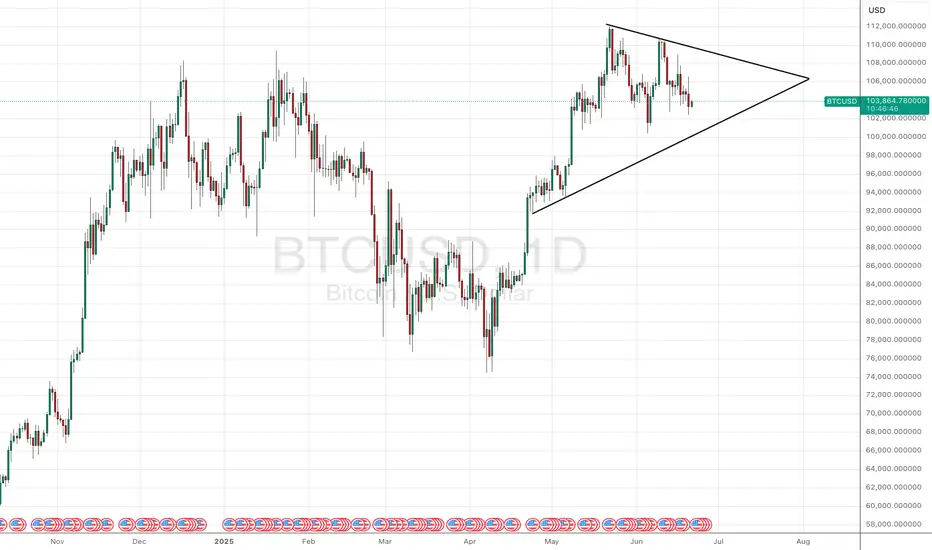
BTCUSD Analysis | is 100k the Next Target?🔍 Chart Breakdown:
Price previously formed a range under key resistance at $108,800.
A Triangle Pattern emerged after a sharp rejection from the resistance zone.
The recent breakdown from this pattern signals bearish momentum.
Support Level: $100,513 — Key level to watch for a potential bounce or further breakdown.
📊 Scenarios to Watch:
🔴 Bearish Case (Preferred):
Breakdown continuation below $104,000 could trigger a move toward the $100,500 support.
Clean rejection from triangle breakdown area confirms the bearish structure.
🟢 Bullish Case (Less Likely):
If BTC holds above $104,000 and breaks above the mid-range zone (~$106,500), a retest of $108,800 is possible.
Watch for fakeouts at the top of the range.
💡Trade Ideas:
Short opportunities on breakdown retest or rejection from $106,000–106,500.
Potential long only if $108,800 is broken with strong volume confirmation.
🛑 Risk Management:
Always use stop-loss. Monitor BTC dominance and macro sentiment for confluence.
💬 What do you think? Bearish breakdown or fakeout trap? Let’s discuss below!

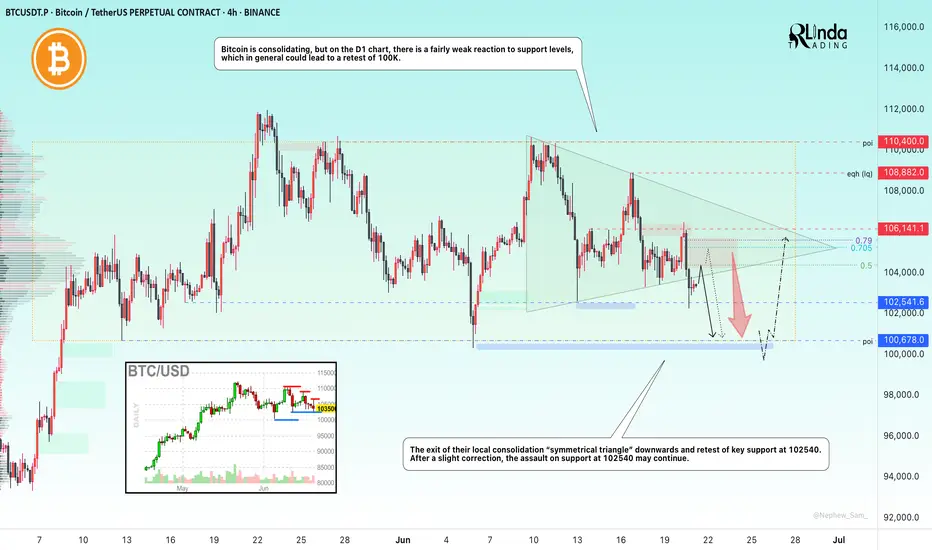
BITCOIN → Possibility of retesting 100K. Buyer weakeningBINANCE:BTCUSDT.P is in consolidation after the rally stalled due to the exhaustion of the bullish driver. The price updates local lows and starts looking at 100K
Bitcoin is under pressure after the escalation of conflict in the middle east and after the FOMC speech. There is also another observation: large companies, politicians, funds and investors have long and aggressively motivate the crowd to buy, verbally confirming that they bought dozens and hundreds of bitcoins at a time for the balance, but bitcoin is standing still and updating lows. At the same time, various services such as "cryptorank" fix bullish sentiment at the lows. The market either lacks liquidity or something more unpredictable is happening (chart drawing????)
Technically, bitcoin is following the behavior of the SP500 quite strongly, which closes Friday's session quite weak and close to key support, which could trigger a continuation of the decline. Bitcoin won't stay on the sidelines and could also follow the index....
Resistance levels: 104K, 105K, 106K
Support levels: 102K, 100.6K, 97.5K
The price is coming out of the “symmetrical triangle” consolidation breaking the support, thus confirming the bearish mood. After a small correction after a false breakdown of 102500 the price may again return to storm (retest) the level under market pressure, which will only strengthen expectations of further decline. The target is liquidity 100600 - 100K. From 100K rebound and growth is possible.
Regards R. Linda!
Symmetrical Triangle: Volatility Squeeze Before Breakout?Bitcoin (BTCUSD) is currently trading within a well-defined symmetrical triangle pattern on the daily chart. This formation is characterized by converging trendlines—higher lows and lower highs—indicating a period of consolidation and decreasing volatility.
Price action is tightening, suggesting a potential breakout is imminent. Symmetrical triangles can break either way, but in this case, the pattern follows a strong prior uptrend, hinting at a possible bullish continuation. Still, traders should watch closely for a confirmed breakout with volume.
⚠️ Key levels to watch:
Upper resistance: ~$111,000
Lower support: ~$96,000
A decisive break above or below these boundaries could set the tone for BTC’s next major move.
Nifty Chart Analysis – Major Breakout or Breakdown Ahed
Assending Triangle Chart pattern in Nifty- Breakout Possible ?
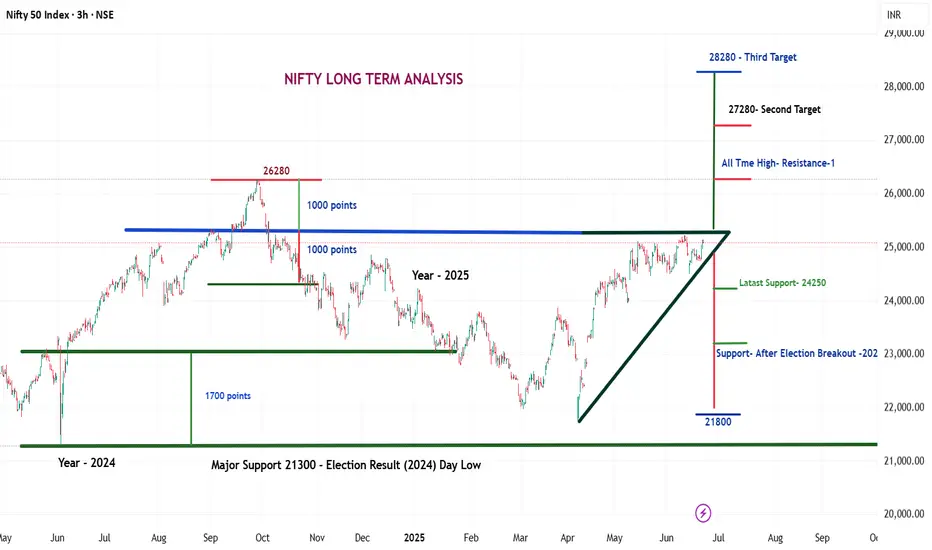
As of June 21, 2025, the Nifty 50 index is showing a strong and potentially decisive Ascending Triangle Pattern on the 3-hour time frame.
This formation typically indicates a bullish breakout if confirmed with volume. Let’s dive deep into the technical outlook and key levels that traders and investors should watch.
Current Market Overview
Current Nifty Level: ~25,080
Pattern Identified: Ascending Triangle
Time Frame: 3H (Medium-Term to Long-Term Insight)
An Ascending Triangle is a bullish continuation pattern formed by a horizontal resistance line and a rising trendline of higher lows.
Key Levels to Watch
Resistance Zone:
Immediate Resistance: 26,280 (All-Time High)
Breakout Target 2: 27,280
Breakout Target 3: 28000 (Long-Term)
If Nifty breaks above the 26,280 level with strong volume confirmation, the next upward targets will be 27,280 and possibly 28000 , based on the measured move from the triangle height.
Support Levels:
Latest Support: 24,250
Post-Election Breakout Support: 22,800
Major Support (Election Result Day Low): 21,300
If any major negative trigger (geopolitical or macroeconomic) occurs, a sharp correction can’t be ruled out. The levels mentioned will act as key demand zones.
Potential Global Risks
While the technical setup is bullish, external risks could spoil the party:
Geopolitical Conflicts:
Iran vs. Israel
India vs. Pakistan
China vs. US tensions
Macro-Economic Triggers:
Spike in Inflation or Crude Oil Prices
US Fed Rate Hike Surprises
Global Recession Fears
In such cases, a steep fall toward 22,800 or even 21,300 may occur.
✅ Conclusion & Strategy
The current Nifty setup presents a classic high-reward-low-risk opportunity for long-term traders if a breakout is confirmed. However, caution is advised if global uncertainties increase. Investors should:
Wait for a decisive breakout above 26,280 with volume.
Maintain a stop-loss around 24,250 on long positions.
Consider booking partial profits near resistance levels and re-entering on pullbacks.
How Traders Can Prepare for the Next Move
Whether a breakout or breakdown happens, traders must:
Use proper stop-loss and risk management
Wait for volume confirmation
Watch for FII/DII activity
Combine price action with Data Analysis
Important Note:
This analysis is based on current chart patterns and known global events. Always use proper risk management and consult with a financial advisor before taking investment decisions.
💬 Like the chart if you found it useful
🗣 Comment your views or questions
👤 Follow us for regular breakout updates
🔁 Share this chart with your trading community and friends who follow Nifty!
✅ Let’s grow together with smart chart analysis and technical strategies.
HelenP. I Gold can rise to resistance level and drop to $3325Hi folks today I'm prepared for you Gold analytics. After a steady climb, the price began to lose momentum and eventually corrected back to the trend line. This zone acted as dynamic support and initiated a new wave of upward movement. However, unlike the previous impulse, the price started consolidating within a symmetrical triangle, signaling indecision and weakening bullish pressure. Now the structure is tightening near the resistance zone, where the price has already been rejected multiple times. The market appears to be preparing for another interaction with the resistance level around 3430. Given the overall context, fading bullish energy, repeated rejections, and the triangle formation, I expect the price to test the resistance one more time before reversing downward. My goal is the trend line support, which aligns with 3325 points. This zone offers a logical area for the price to move next, especially considering the limited momentum above and the growing risk of breakdown inside the triangle. If you like my analytics you may support me with your like/comment ❤️
Disclaimer: As part of ThinkMarkets’ Influencer Program, I am sponsored to share and publish their charts in my analysis.

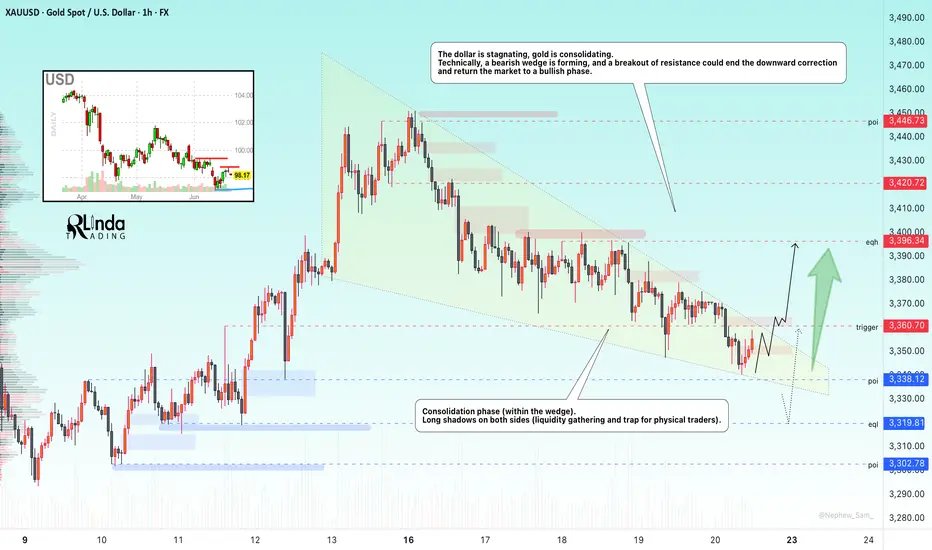
GOLD → Consolidation within a falling wedgeFX:XAUUSD is consolidating. A major player is gathering a trading position inside a wedge ahead of distribution. But the main question is: in which direction?
Gold lost ground again on Friday after mixed holiday trading on Thursday. Traders are waiting for new signals from the Fed and monitoring the situation in the Middle East. Interestingly, gold fell as the conflict escalated further (which is not logical overall). The dollar is in a global bearish trend, and traders are waiting for a decision from Powell (who is under pressure from Trump to cut rates).
Technically, if we look at the wedge, we can see how difficult it is for the market to move. The price is stuck inside the consolidation. The intraday movement is very short, with long tails and a very weak reaction to both false breakouts and level break. Large players are building up positions inside the current channel. This may only hint at the possibility of future implementation (distribution).
Resistance levels: 3360, 3396, 3420
Support levels: 3338, 3320, 3302
On D1 - H4, gold is in a countertrend (bullish trend) correction and is testing the trend support + 0.7 Fibo zone. Below, there are fairly strong areas of interest — 3320 and 3302 — which gold may test before rising. However, within the wedge, there is a fairly high probability of a breakout of resistance and the 3360 level, followed by a rally to the liquidity zone at 3396
Best regards, R. Linda!
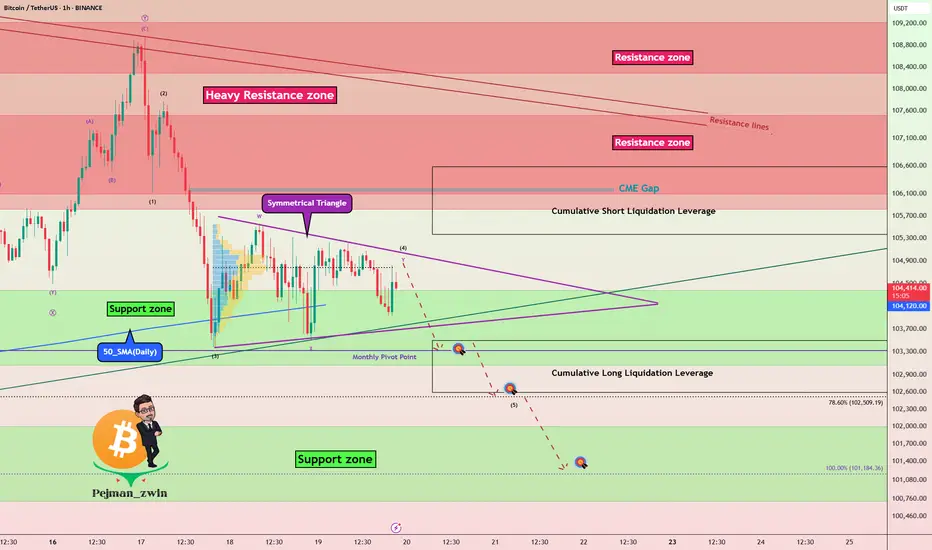
BTC - Key Battle Between Bulls and Bears – Symmetrical TriangleBitcoin ( BINANCE:BTCUSDT ) is currently consolidating within a Symmetrical Triangle , showing indecision among Bulls and Bears around the Support zone($104,380-$103,060) and just above the 50_SMA (Daily) .
From an Elliott Wave perspective, the current range may represent a WXY corrective structure . The market seems to be waiting for a breakout direction , potentially aiming to complete wave 5 after this correction.
The Monthly Pivot Point($103,300) and the presence of significant Cumulative Liquidation Leverage Zones (both Long and Short ) are key liquidity magnets to watch in the short term .
I expect Bitcoin to re-attack the Support zone($104,380-$103,060) AFTER breaking the lower line of the Symmetrical Triangle Pattern and decline to the targets I have outlined on the chart.
Note: Stop Loss: $106,703 = Worst Stop Loss(SL)
Please respect each other's ideas and express them politely if you agree or disagree.
Bitcoin Analyze (BTCUSDT), 1-hour time frame.
Be sure to follow the updated ideas.
Do not forget to put a Stop loss for your positions (For every position you want to open).
Please follow your strategy and updates; this is just my Idea, and I will gladly see your ideas in this post.
Please do not forget the ✅' like '✅ button 🙏😊 & Share it with your friends; thanks, and Trade safe.
BTC levels to watch for a breakoutMarkets are quiet, and Bitcoin is coiling. A potential breakout looms as we await the President’s Working Group crypto update by July 23. Will positive news trigger a rally to $121,000? Watch for key levels and triangle patterns.
This content is not directed to residents of the EU or UK. Any opinions, news, research, analyses, prices or other information contained on this website is provided as general market commentary and does not constitute investment advice. ThinkMarkets will not accept liability for any loss or damage including, without limitation, to any loss of profit which may arise directly or indirectly from use of or reliance on such information.

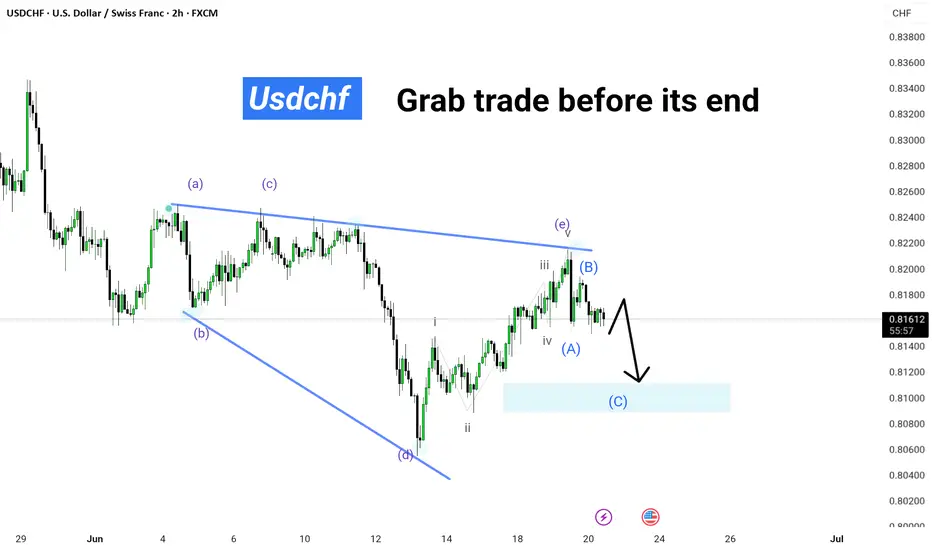
USDCHF || Grab trade before its end" – Upgrade Suggestions:" USDCHF correcting into demand zone 📉 Wave (C) incoming! Watch for the final leg before the reversal. Don’t miss this precision setup. 💥 #ElliottWave #USDCHF #ForexSetup"
🟢 Technical Breakdown:
Triangle Formation (ABCDE) completed near the top.
Price action shows a breakdown from Wave (B), suggesting a corrective leg is underway.
You’ve marked:
Wave (A) and (B) already formed.
Wave (C) is expected to reach the highlighted demand zone (blue box around 0.81000).
The current price is around 0.81633, indicating an ideal entry area for a short setup targeting the blue zone.
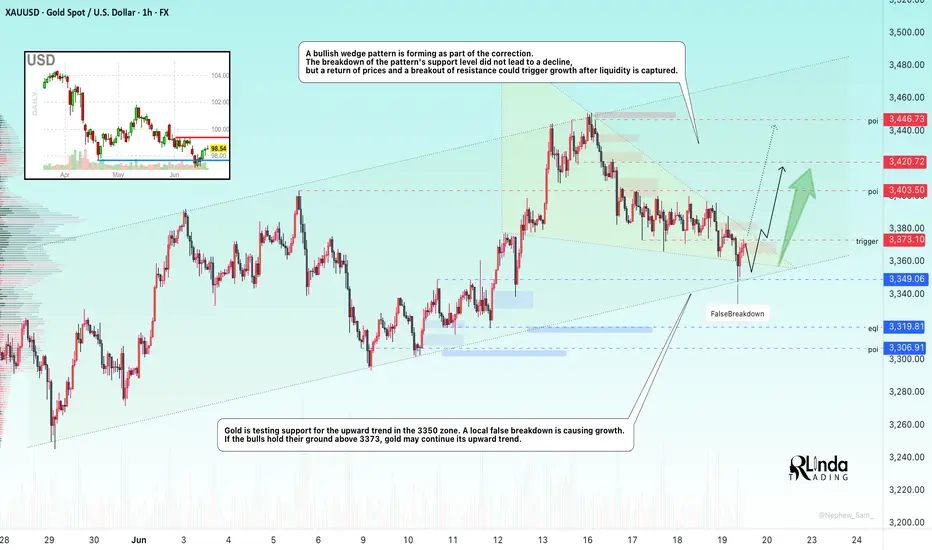
GOLD → Continuation of the global trend... To 3350?FX:XAUUSD is testing trend support within a correction. Against a complex fundamental backdrop (the Middle East, Fed comments, Trump's desire to lower rates), the price may continue to rise.
The price of gold rose from a weekly low of $3,363 on Thursday thanks to increased demand for safe-haven assets following reports of possible US strikes on Iran. Markets are ignoring the Fed's hawkish decision to maintain its tight policy and rate forecasts. Traders are waiting for new signals from the Middle East, given the risk of increased volatility due to low liquidity in connection with the US holiday.
Technically, a bullish wedge pattern is forming as part of the correction. The breakdown of the pattern's support did not lead to a decline, but a return of prices and a breakout of resistance could trigger growth after liquidity returns.
Resistance levels: 3373, 3403, 3420
Support levels: 3349, 3320
Before growth, a retest of the trend support or the 3350 zone is possible. However, if the price goes above 3375 and the bulls hold their ground above this level, then we can expect growth to continue within the trend.
Best regards, R. Linda!