ASAHIINDIAASAHIINDIA has given symmetrical triangle breakout with unusual volume. Already took a momentum. Now as long as it is above upper channel line, i believe the momentum will continue till 980-1000 levels. Keep it on radar.
Triangle

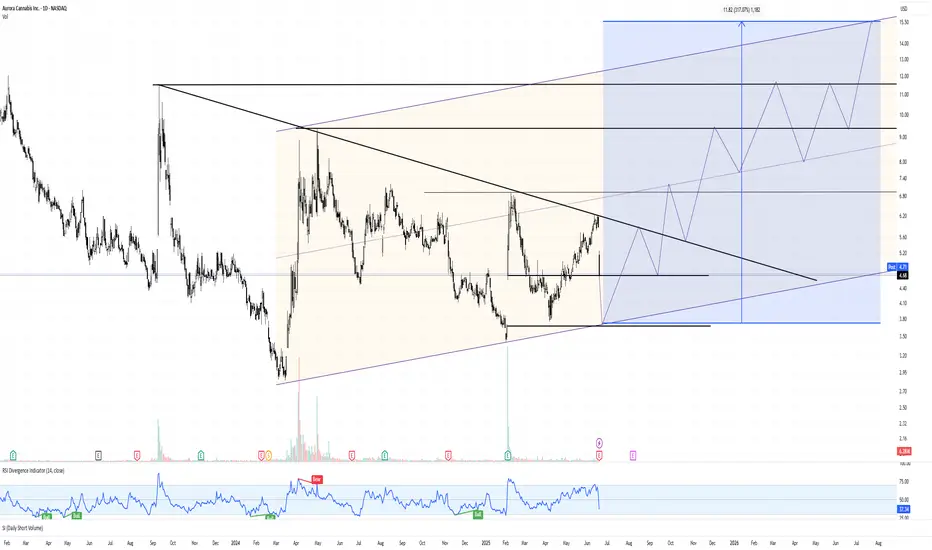
Wedge Breakout in Motion – 317% Potential Toward Channel Up📍 Ticker: NASDAQ:ACB (Aurora Cannabis Inc.)
📆 Timeframe: 1D (Daily)
📉 Price: $4.71
📊 Volume: 1.22M
📈 RSI: 42.76 (rising from oversold territory)
🔍 Technical Setup:
After years of decline, NASDAQ:ACB has broken out of a large descending wedge, with price pushing above downtrend resistance and reclaiming horizontal support.
🔼 Breakout Structure: Descending wedge + horizontal base
📉 Bear market floor established at ~$3.00
📈 Next key level: ~$5.60, then $9.00+
💠 Price projection drawn within expanding ascending channel, targeting mid-to-upper range reversion over time.
🧠 Trade Plan & Price Targets:
✅ Entry Zone: $4.60–$4.80 (confirmed breakout, medium risk)
✅ Entry Zone: $3.60–$3.80 (full gap retest, lower risk)
✅ Entry Zone: $2.95–$3.10 (Lowest low, lowest risk)
❌ Stop-Loss: Close below $4.00 (failed retest + support invalidation)
❌ Stop-Loss 2: Close below $3.55 (Lower than the biggest gap low level)
❌ Stop-Loss 3: Close below $2.84 (Lower than the lowest low)
🎯 Target 1: $5.60
→ 📈 Return: +18.9%
🎯 Target 2: $9.00
→ 📈 Return: +91.0%
🎯 Target 3: $15.00
→ 📈 Return: +217.0%
⚠️ Key Insights:
RSI curling up from below 40 = momentum shift
Short interest remains high → potential short squeeze trigger
Price is now above long-term downtrend — trend reversal scenario in play
Macro sentiment toward cannabis may act as catalyst
Still haven't started the biggest US market
💬 Can Aurora Cannabis light up again and return to its long-term channel highs?
Follow for more setups with asymmetric risk/reward.
#TargetTraders #ACB #CannabisStocks #WedgeBreakout #ChannelReversion #PennyStockSetup
EURO - Price can correct to support area and then continue riseHi guys, this is my overview for EURUSD, feel free to check it and write your feedback in comments👊
Some days ago, price declined below support level and then started to grow inside a triangle pattern.
In this pattern, Euro broke $1.1085 level and even rose higher than $1.1425 level, but soon made a correction.
Later price exited from triangle and fell to support level, after which it started to grow inside rising channel.
Inside channel, price rose near support line and later reached $1.1425 level one more time, and some time traded close.
Soon, Euro broke this level and rose to resistance line of channel and then started to move down.
In my opinion, EUR can fall to support area and then continue to grow in channel to $1.1720 resistance line.
If this post is useful to you, you can support me with like/boost and advice in comments❤️
Disclaimer: As part of ThinkMarkets’ Influencer Program, I am sponsored to share and publish their charts in my analysis.

Solana bag holders could soon be under pressureSOL prices are getting squeezed, and the price appears stuck in a descending triangle pattern, with a 20% downside potential if key levels break. Weighing on prices are the US economic slowdown and the Israel-Iran war. On the flip side, we may soon hear from the US government, with the President’s Working Group on Crypto expected to release their report before 22 July.
What’s your take on SOL? Will bullish or bearish forces prevail?
This content is not directed to residents of the EU or UK. Any opinions, news, research, analyses, prices or other information contained on this website is provided as general market commentary and does not constitute investment advice. ThinkMarkets will not accept liability for any loss or damage including, without limitation, to any loss of profit which may arise directly or indirectly from use of or reliance on such information.

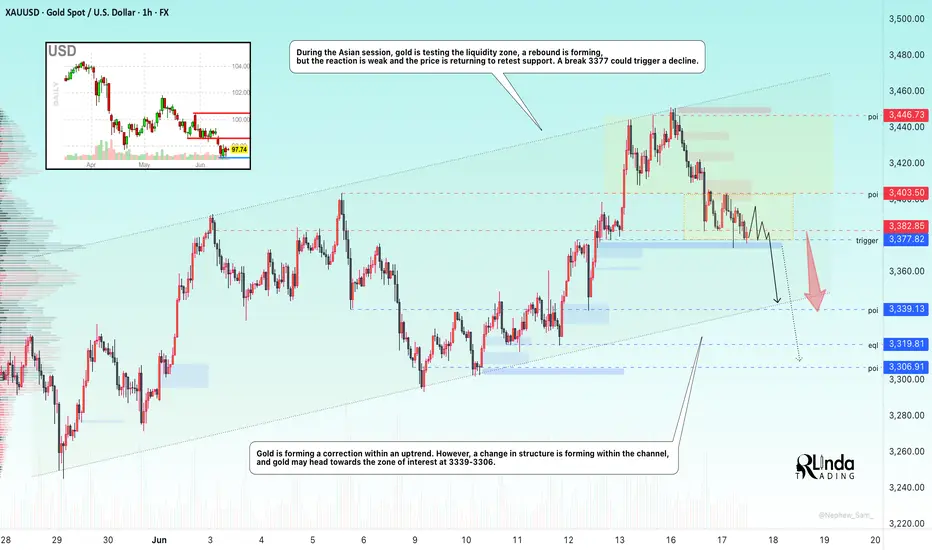
GOLD → Bear pressure. Area of interest: 3340–3306FX:XAUUSD continues to decline under pressure from sell-offs. However, the situation is interesting overall, as there is conflicting data and unexpected price behavior is surprising the market...
On Tuesday, gold is trying to regain the $3,400 level after pulling back from highs, but it is still facing selling pressure and returning to $3,377. The market reaction to the $3,377 level is quite weak, and if the price starts to stick to support, this will lead to a further decline. The dollar is strengthening as a safe-haven currency, holding back gold's growth. The markets are focused on the outcome of the Fed and Bank of Japan meetings, as well as US retail sales data. Any dovish signals from the Fed could support gold and weaken the dollar.
Technically, on D1, gold is returning below the 3382 level (selling zone) and testing 3377. The reaction to the false breakout of support is weak, and the price is forming a pre-breakdown consolidation relative to 3377. There are clear areas of interest that could lure the price before the news. For example, 3343, 3306, 3245.
Resistance levels: 3382, 3403.
Support levels: 3377, 3339, 3320
The bearish structure will be broken if the price strengthens to 3403 and consolidates above that level. This will reinforce buyers' expectations, which could lead to growth. At the moment, I would expect two scenarios: price consolidation within 3377-3403. But technically, the chart shows that there is bearish pressure in the market. The price continues to storm the support level of 3377, which may not hold up against another retest. A break 3377 could lead to a fall to the areas of interest at 3339-3306.
Best regards, R. Linda!
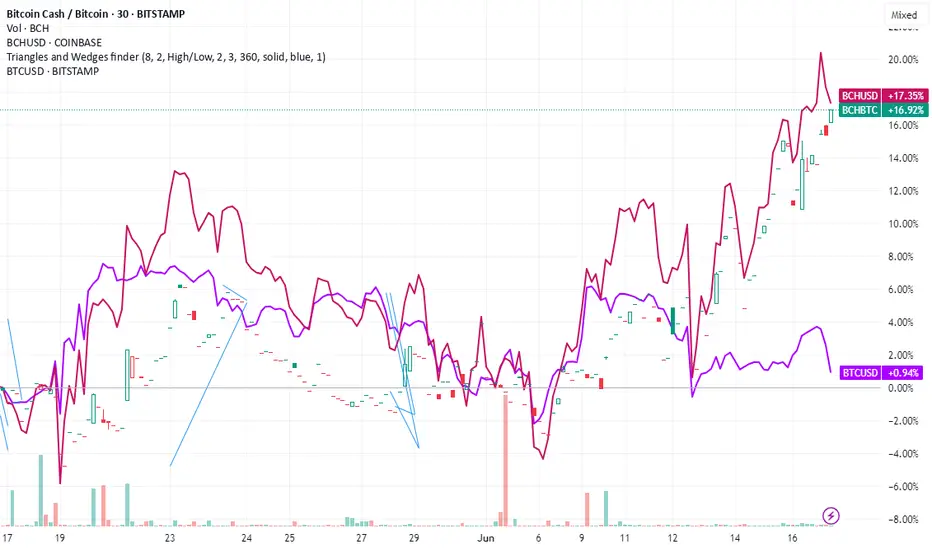
Is the Bitcoin Cash Hype Over? BCH/BTC Ratio Flashes WarningThe Great Divergence: Why the Bitcoin Cash-Bitcoin Ratio Breakdown Signals More Than Just a Price Drop
In the unforgiving arena of the cryptocurrency markets, every chart tells a story. Some whisper of quiet accumulation, others scream of speculative frenzy. But few charts tell a story as profound and historically charged as the Bitcoin Cash to Bitcoin (BCH/BTC) ratio. For years, this ratio has been the ultimate barometer of a digital civil war, a measure of the hopes and failures of a project born from a contentious schism. Recently, that barometer has given its clearest signal in months: a decisive and powerful breakdown from a multi-month triangle pattern.
This technical event is far more than a simple squiggle on a screen for traders. It represents the potential end of a speculative, hype-driven rally and the forceful reassertion of a brutal, long-term trend. It signals that the fundamental chasm between Bitcoin, the undisputed king of digital assets, and Bitcoin Cash, its most famous and ambitious offshoot, may be widening once again. The breakdown suggests that the brief period of optimism for Bitcoin Cash, fueled by its own halving event and a broader market updraft, may be conclusively over. To understand the gravity of this moment, one must dissect not only the technical pattern itself but also the deep-seated historical and fundamental weaknesses that made this breakdown almost inevitable.
The Anatomy of a Technical Collapse: Smashing the Triangle
For much of 2024, the BCH/BTC ratio was trapped in a state of compression. On the chart, this appeared as a classic symmetrical triangle pattern. This pattern is defined by a series of lower highs and higher lows, creating two converging trendlines that form the shape of a triangle. In market terms, it represents a period of intense equilibrium and indecision. Buyers and sellers are locked in a fierce battle, with neither side able to gain a definitive edge. The price coils tighter and tighter, like a compressed spring, building up energy for an explosive move. The only question is which direction it will break.
In the case of the BCH/BTC ratio, that question has been answered with a resounding crash. The price has decisively broken below the lower trendline of the triangle. This is known as a "breakdown," and it is a powerfully bearish signal. It signifies that the sellers have overwhelmed the buyers, the equilibrium has been shattered, and the path of least resistance is now firmly downwards.
Traders often measure the potential target of such a breakdown by taking the height of the triangle at its widest point and projecting that distance downwards from the point of the breakdown. Given the scale of this particular pattern, this technical measurement points to a significant further decline in the ratio, potentially revisiting and even surpassing its all-time lows. This isn't just a minor dip; it's a structural failure on the chart that suggests a new, sustained leg down in Bitcoin Cash's performance relative to Bitcoin. The "hype rally" that saw the ratio climb in the lead-up to the Bitcoin Cash halving has been effectively erased, and the market is signaling that the fundamental gravity of the long-term downtrend is taking hold once more.
A Ghost in the Machine: The Lingering Shadow of the 2017 Fork
This technical breakdown did not occur in a vacuum. It is a single chapter in a long and bitter saga that began in 2017. To grasp its significance, we must revisit the great "Block Size War" that tore the Bitcoin community apart. At its heart was a philosophical disagreement about how to scale Bitcoin to accommodate more users.
One camp, which included many of the earliest adopters and evangelists, argued for a simple solution: increase the block size. By allowing more transactions to fit into each block, the network could process more volume and keep fees low, preserving what they saw as Bitcoin's original vision of a "peer-to-peer electronic cash system."
The other camp, which ultimately retained control of the Bitcoin protocol, argued for a more cautious approach. They feared that large blocks would lead to centralization, making it too expensive for ordinary users to run a full node and validate the blockchain. Their solution was to keep the base layer small and secure, and to build scaling solutions on top of it, such as the Lightning Network.
This ideological impasse led to a "hard fork" in August 2017, creating Bitcoin Cash. For a brief, euphoric period, BCH was seen as a legitimate contender. Fueled by a powerful narrative and influential backers, its price soared, and the BCH/BTC ratio hit an all-time high of over 0.5 in late 2017, sparking serious talk of a "flippening"—the moment BCH would overtake BTC in market capitalization.
That moment never came. Since that peak, the BCH/BTC ratio has been locked in a devastating, multi-year downtrend. The recent triangle pattern was merely a pause, a brief consolidation within this much larger waterfall decline. The breakdown from the triangle is therefore not a new event, but a continuation of a historical trend. It is the market's brutal verdict on the outcome of that civil war.
The Fundamental Chasm: Why Bitcoin Cash Keeps Losing Ground
A chart pattern is ultimately a reflection of underlying fundamentals. The relentless decline of the BCH/BTC ratio is a direct consequence of the widening gap between the two networks across every meaningful metric.
1. Narrative and Brand Identity: Bitcoin has successfully cultivated a simple, powerful, and globally understood narrative: it is digital gold. It is a store of value, a hedge against inflation, and a pristine, unconfiscatable asset. This narrative has attracted institutions, nation-states, and trillions of dollars in potential capital. Bitcoin Cash, meanwhile, has struggled to define itself. Its narrative as "peer-to-peer electronic cash" is less compelling in a world with countless low-fee payment options, including stablecoins and Bitcoin's own Lightning Network. Without a clear and unique value proposition, it has failed to capture the market's imagination.
2. Security and Hash Rate: The most critical measure of a proof-of-work blockchain's health is its hash rate—the total computational power dedicated to securing the network. Here, the difference is staggering. Bitcoin's hash rate is orders of magnitude higher than Bitcoin Cash's. This makes Bitcoin exponentially more secure and resistant to a 51% attack, where a malicious actor could gain control of the network. Bitcoin Cash, with its comparatively minuscule hash rate, remains theoretically vulnerable, a fundamental flaw that deters serious institutional capital.
3. Developer Activity and Innovation: The heart of any technology is its developer community. The most innovative and exciting developments in the Bitcoin ecosystem are happening on the main chain. The activation of Taproot, the explosion of Ordinals and Inscriptions, and the continued growth of the Lightning Network all demonstrate a vibrant and evolving protocol. In contrast, the developer ecosystem for Bitcoin Cash has been far less dynamic. While it has its dedicated builders, it has not produced the kind of groundbreaking innovation needed to attract new users and capital.
3. Adoption and Network Effects: Bitcoin's network effect is its ultimate moat. It has spot ETFs trading on major stock exchanges, granting it unparalleled access to traditional finance. It is held on the balance sheets of public companies and is recognized as legal tender in some countries. Bitcoin Cash has none of these things. Merchant adoption has stalled, and institutional interest is virtually non-existent. In the world of networks, winners tend to take all, and Bitcoin's lead has become seemingly insurmountable.
The Aftermath: What Comes Next for the BCH/BTC Ratio?
With the triangle pattern now shattered, the path forward for the BCH/BTC ratio looks precarious. The most likely scenario is a continuation of the bearish trend that has been in place for over six years. The breakdown has released the coiled energy to the downside, and the ratio will likely seek out lower levels of support, potentially bleeding towards its all-time lows. For investors, this serves as a stark reminder of the risks of holding assets that are fundamentally and technically weaker than the market leader.
Is there any hope for a reversal? A bull case for Bitcoin Cash would require a monumental shift. It would need to carve out a sustainable niche that Bitcoin cannot serve, perhaps in ultra-low-fee microtransactions. It would require a renaissance in developer activity, producing a "killer app" that draws in millions of users. More likely, any significant bounce in the BCH/BTC ratio would probably be a result of a massive, indiscriminate altcoin rally that lifts all boats, rather than a specific vote of confidence in Bitcoin Cash itself. Even then, history suggests such bounces are temporary and ultimately present better opportunities to sell than to buy for the long term.
Conclusion: The Market Has Spoken
The breakdown of the BCH/BTC ratio from its multi-month triangle is a technically significant event with profound fundamental implications. It is the market's latest verdict in the long-running war for the "real Bitcoin" title. The verdict is clear: the hype is over. The dream of a "flippening" is a distant memory, a ghost from 2017.
The story of the BCH/BTC chart is a powerful lesson in market dynamics. It shows that in the brutal competition of open-source protocols, a superior narrative, impenetrable security, and a powerful network effect are the ultimate weapons. Bitcoin Cash began its life as a legitimate contender with a compelling vision. But over time, it has been outmaneuvered, out-developed, and out-adopted. The chart does not lie. It simply reflects this divergent reality, and its latest signal suggests that the great divergence between Bitcoin and its most famous offspring is set to continue.
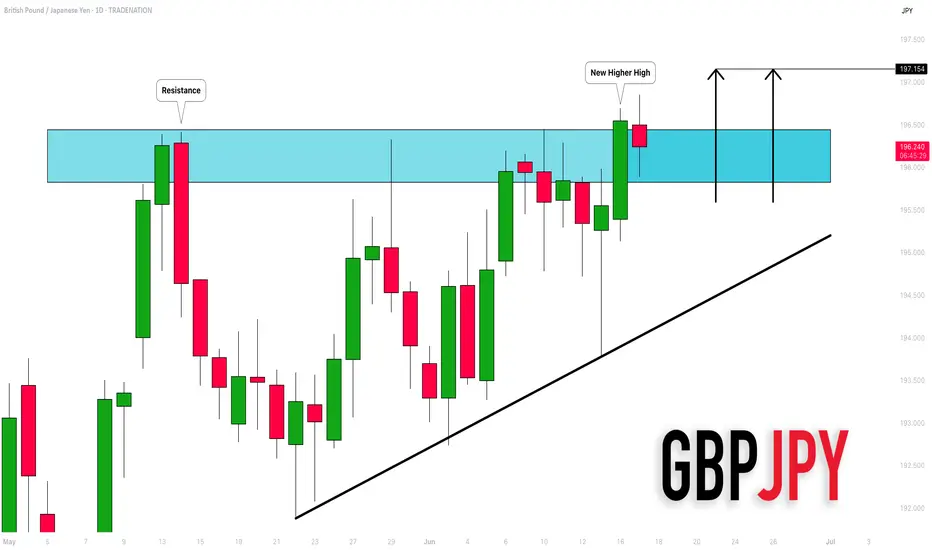
GBPJPY: Important New High 🇬🇧🇯🇵
GBPJPY set a new higher high higher close on a daily,
violating a key horizontal resistance cluster.
I think that it opens a potential for more growth.
Next strong resistance is 195.15
❤️Please, support my work with like, thank you!❤️
I am part of Trade Nation's Influencer program and receive a monthly fee for using their TradingView charts in my analysis.
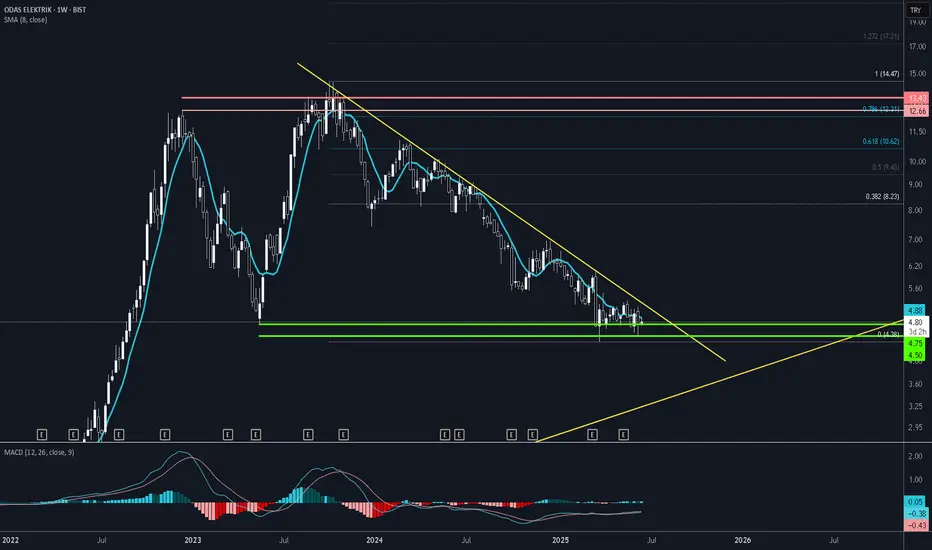
High Risk/reward Ratio for ODAS Long TradeI believe ODAS has not much time for breakout. Stop level should be weekly closure below 4.5 TL which is the testing area of double bottom. Take Profit should be set to fibonacci level 8TL.
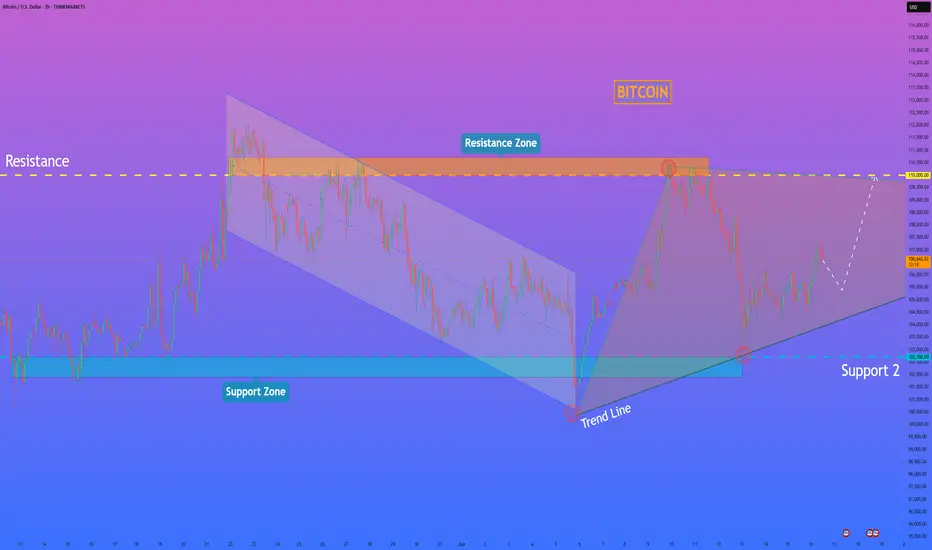
HelenP. I Bitcoin will continue to move up inside triangleHi folks today I'm prepared for you Bitcoin analytics. After rebounding from the support level, the price initially showed strength and moved upward. However, the bullish momentum was short-lived, and the price began a downward correction, forming a well-defined descending channel. During this decline, the price dropped below the support zone, confirming short-term bearish dominance. Despite this breakdown, bulls regained control, and the price started forming a series of higher lows, resulting in the development of a symmetrical triangle. This structure signals compression and potential preparation for a breakout. The current price action confirms that BTC is now recovering within this triangle, supported by the upward trend line drawn from the recent lows. Given the strength of this recovery and the stabilization above the support zone, I expect the price to make a small correction and then continue climbing toward the resistance level at 110000. That’s why my current goal remains focused on this level, representing both a psychological and technical barrier aligned with previous local highs. If you like my analytics you may support me with your like/comment ❤️
Disclaimer: As part of ThinkMarkets’ Influencer Program, I am sponsored to share and publish their charts in my analysis.
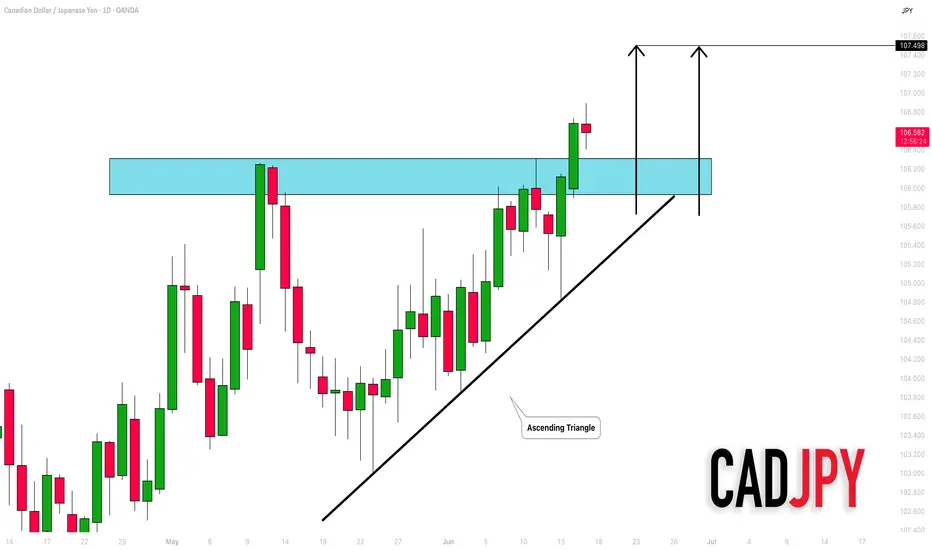
CADJPY: Important Breakout 🇨🇦🇯🇵
CADJPY successfully violated a resistance of an ascending triangle
pattern on a daily time frame.
The broken structure turns into a strong support now.
The pair may continue rising after a pullback.
Next goal - 107.5
❤️Please, support my work with like, thank you!❤️
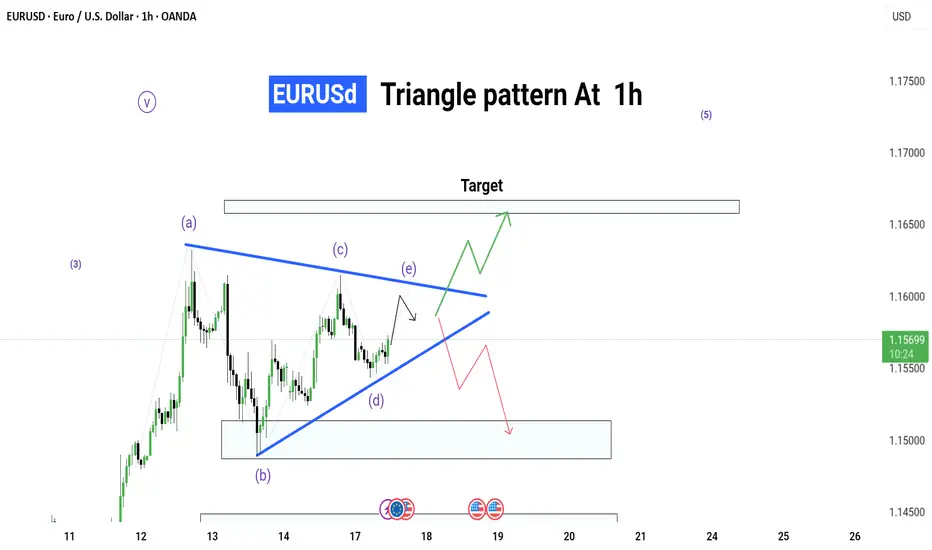
EUR/USD Triangle Pattern – 1H Timeframe
📊 EUR/USD Triangle Pattern – 1H Timeframe
🕐 Date: 17 June 2025
📌 Chart by: GreenfireForex
🔷 Pattern: Contracting Triangle (ABCDE)
🔍 Context: Forming inside Wave (4) – possible breakout before Wave (5)
📈 Upside Potential: Break above triangle → target near 1.16500+
📉 Downside Risk: If fails to break up → revisit demand zone around 1.15000
---
🔮 Possible Scenarios:
✅ Bullish Breakout:
Breaks above wave (e)
Clean rally toward target zone
Ideal for a long setup with tight SL
❌ Bearish Fakeout:
Rejection from triangle resistance
Falls back into demand zone
Look for reversal or retest opportunities
---
🎯 Strategy Tips:
Wait for a breakout candle
Use SL outside triangle zone
Entry based on confirmation – avoid early trades
💬 Let’s discuss live market reaction as price nears triangle edge. Stay ready .
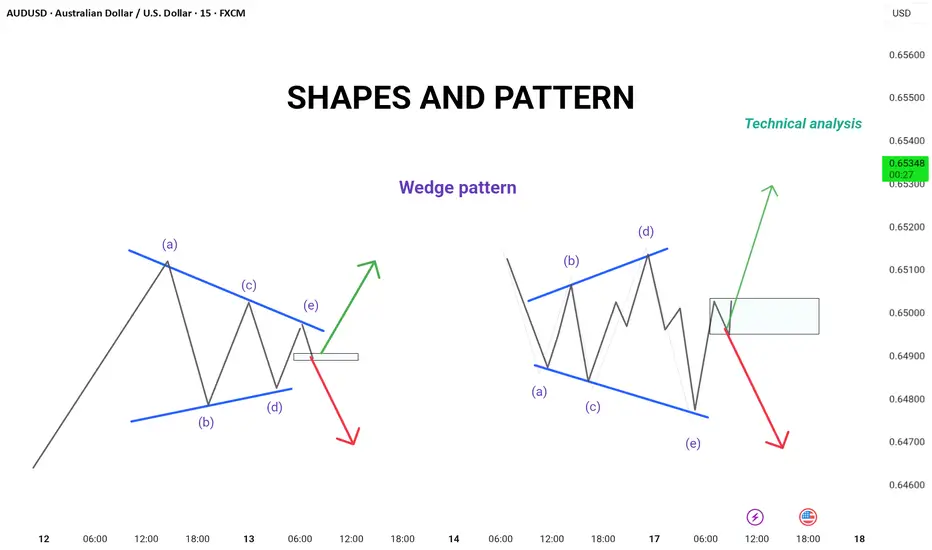
Wedge Pattern – Simple Explanation
📚 Wedge Pattern – Simple Explanation
A wedge pattern is a shape on the chart that looks like a triangle or cone. It tells us that the price is getting ready to break out — either up or down.
---
🔻 Falling Wedge (Bullish)
Looks like price is going down, but slowly.
Lines move closer together.
Usually means the price will go up soon.
It's a bullish signal (good for buying).
---
🔺 Rising Wedge (Bearish)
Price goes up, but losing strength.
Lines get closer together.
Usually means the price will go down soon.
It's a bearish signal (good for selling).
---
💡 Easy Tips:
Wait for breakout (big move out of the wedge).
Use a stop-loss below/above the pattern.
Target = height of the wedge.
---
📌 In Short:
Wedge = Squeeze pattern.
Falling wedge = Buy chance.
Rising wedge = Sell chance.
---
Let me know if you have sny doubt in comments
GBPJPY breakout confirmed: what comes next?GBPJPY just triggered an ascending triangle pattern with a 450-pip upside. We dive into the pattern, key levels to watch, and how to manage risk with a 4.8 risk-reward setup. Will it retest before heading higher? Let us know your view in the comments.
This content is not directed to residents of the EU or UK. Any opinions, news, research, analyses, prices or other information contained on this website is provided as general market commentary and does not constitute investment advice. ThinkMarkets will not accept liability for any loss or damage including, without limitation, to any loss of profit which may arise directly or indirectly from use of or reliance on such information.

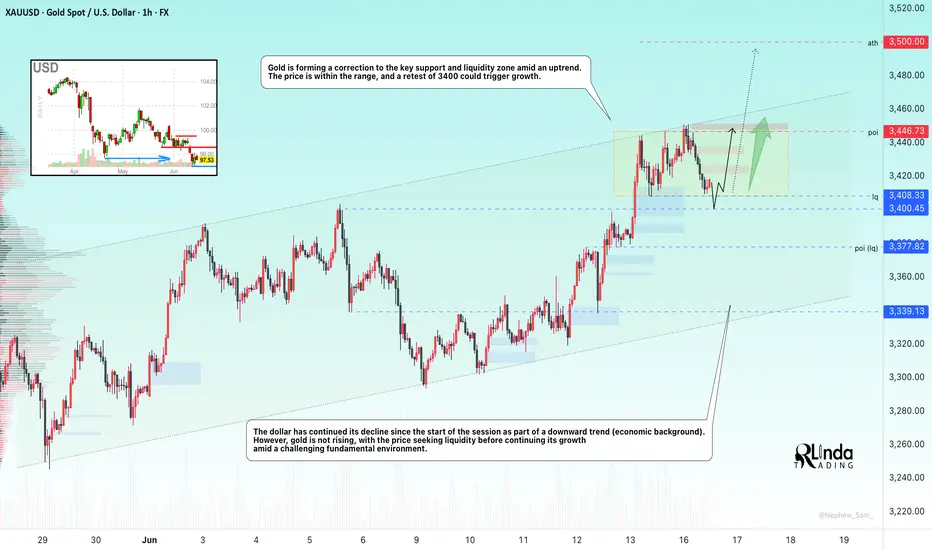
GOLD → Hunting for liquidity before continued growthFX:XAUUSD has been correcting since the start of the session. The fundamental background is complicated due to the escalation of the conflict in the Middle East.
The price of gold briefly retreated from a two-month high above $3,450 amid a recovery in the dollar and investor caution. Escalating tensions between Israel and Iran are dampening risk appetite, while markets await decisions from the Fed and the Bank of Japan. Expectations of a dovish Fed continue to support interest in gold, but fresh impetus is needed for further gains.
Technically, the market is bullish. Gold is forming a correction to the key support and liquidity zone amid an uptrend. The price is within the range, and a retest of 3400 could trigger growth.
Support levels: 3408, 3400
Resistance levels: 3446, 3500
A retest of support and liquidity capture amid the current challenging situation (high interest in the metal) and a bullish trend could support the price, allowing gold to continue its growth.
Best regards, R. Linda!
At monthly supportSymmetrical triangle at a monthly support. Breakout is coming soon, could be either way but I think is most likely to go to the upside following the previous two continuation patterns. Price is just over the lower vertex of the triangle, so we have a tight SL, it triggers if a weekly candles breaks down the triangle. I have calls that expire 3 months from now strike 200. Buying the stock is much safer. Good luck.

Descending Triangle in Apple?Apple has struggled all year, and evidence of a downtrend may be growing in the tech giant.
The first pattern on today’s chart is this month’s lower high relative to mid-May. Combined with the May 7 low of $193.25, some traders may think a descending triangle is taking shape. That’s a potentially bearish formation.
Second, TradeStation data shows that AAPL is the only trillion-dollar company now trading below its 200-day simple moving average (SMA). The 200-day SMA has also turned lower. Those points may confirm long-term price action is less bullish.
Next, prices remaining below the falling 50-day SMA may signal intermediate-term weakness.
Fourth, short-term trends may be weakening: The 8-day exponential moving average (EMA) is below the 21-day EMA and MACD is falling.
Finally, AAPL is one of the most active underliers in the options market. That could help traders take positions with calls and puts.
Check out TradingView's The Leap competition sponsored by TradeStation.
TradeStation has, for decades, advanced the trading industry, providing access to stocks, options and futures. If you're born to trade, we could be for you. See our Overview for more.
Past performance, whether actual or indicated by historical tests of strategies, is no guarantee of future performance or success. There is a possibility that you may sustain a loss equal to or greater than your entire investment regardless of which asset class you trade (equities, options or futures); therefore, you should not invest or risk money that you cannot afford to lose. Online trading is not suitable for all investors. View the document titled Characteristics and Risks of Standardized Options at www.TradeStation.com . Before trading any asset class, customers must read the relevant risk disclosure statements on www.TradeStation.com . System access and trade placement and execution may be delayed or fail due to market volatility and volume, quote delays, system and software errors, Internet traffic, outages and other factors.
Securities and futures trading is offered to self-directed customers by TradeStation Securities, Inc., a broker-dealer registered with the Securities and Exchange Commission and a futures commission merchant licensed with the Commodity Futures Trading Commission). TradeStation Securities is a member of the Financial Industry Regulatory Authority, the National Futures Association, and a number of exchanges.
Options trading is not suitable for all investors. Your TradeStation Securities’ account application to trade options will be considered and approved or disapproved based on all relevant factors, including your trading experience. See www.TradeStation.com . Visit www.TradeStation.com for full details on the costs and fees associated with options.
Margin trading involves risks, and it is important that you fully understand those risks before trading on margin. The Margin Disclosure Statement outlines many of those risks, including that you can lose more funds than you deposit in your margin account; your brokerage firm can force the sale of securities in your account; your brokerage firm can sell your securities without contacting you; and you are not entitled to an extension of time on a margin call. Review the Margin Disclosure Statement at www.TradeStation.com .
TradeStation Securities, Inc. and TradeStation Technologies, Inc. are each wholly owned subsidiaries of TradeStation Group, Inc., both operating, and providing products and services, under the TradeStation brand and trademark. When applying for, or purchasing, accounts, subscriptions, products and services, it is important that you know which company you will be dealing with. Visit www.TradeStation.com for further important information explaining what this means.

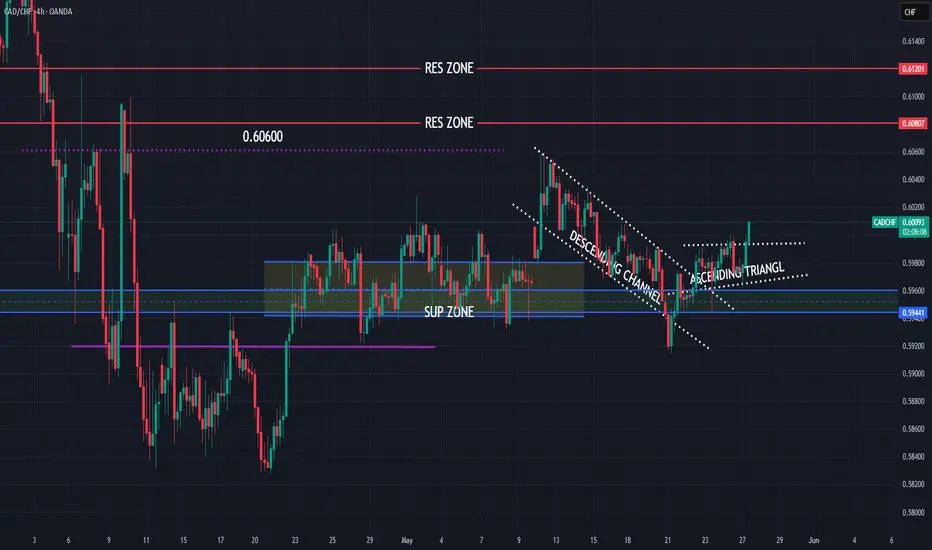
CADCHF new view, still bullish expectations
OANDA:CADCHF first analysis till TP1 (attached), having thoughts we are not see to much here and expecting higher bullish push than in previous analysis.
We are have break of zone, price is start pushing, at end its revers on first res zone (0.60600), in meantime DESCENDING CHANNEL is be created, on 22.Jun is be breaked, currently price is break and ASCENDING TRIANGL.
SUP zone: 0.59600
RES zone: 0.60800, 0.61200
Gold prices look set to reach a fresh ATHGold prices are up on Israel's attack on Iran, as traders and investors buy to hedge against inflation and the higher geopolitical war. Watch the video to learn what levels traders are watching.
This content is not directed to residents of the EU or UK. Any opinions, news, research, analyses, prices or other information contained on this website is provided as general market commentary and does not constitute investment advice. ThinkMarkets will not accept liability for any loss or damage including, without limitation, to any loss of profit which may arise directly or indirectly from use of or reliance on such information.

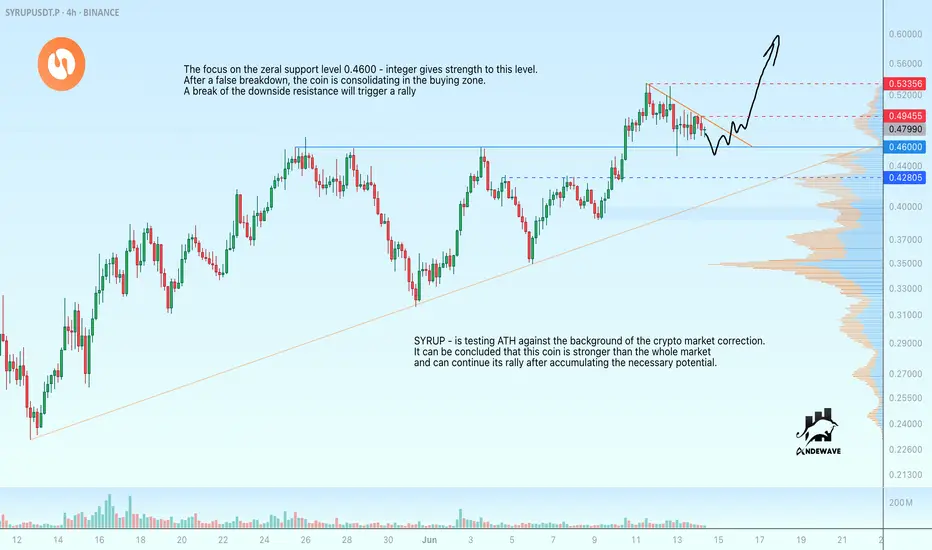
SYRUP consolidates for rallySYRUP - is testing ATH while the crypto market is in correction. We can conclude that this coin is stronger than the whole market and can continue its rally after accumulating the right potential.
Focus on the mirror support level 0.4600 - the round number gives strength to this level. After a false breakdown, the coin is consolidating in the buying zone. A break of the downside resistance will trigger a rally
Scenario: If the consolidation above 0.4600 continues and the coin breaks the downside resistance, a breakout and consolidation above 0.49450 will attract new buyers, which will only strengthen the rally.
Ethereum’s 19-Day ETF Inflow Streak: What Really HappenedEthereum’s 19-Day ETF Inflow Streak: What Really Happened to Price, Structure, and Sentiment
Table of Contents
1. Executive Summary
2. ETF Backdrop: How the 19-Day Inflow Wave Took Shape
3. Chronology of Price: Day-by-Day Performance
4. Weekly Chart Anatomy: The “Pre-Tower Top” Signal Explained
5. Intraday Technicals: From $2,450 Low to the $2,620 Hurdle
6. On-Chain & Derivatives Lens: Funding, OI, CEX Balances
7. Fundamental Undercurrents: Dencun Afterglow, L2 Fees, Staking Yields
8. Risks & Catalysts: ETH vs. Macro, vs. BTC Dominance, vs. SEC Noise
9. Playbooks for Traders and Long-Term Allocators
10. Conclusion: A Pause, Not a Peak—If Key Levels Hold
________________________________________
1. Executive Summary
• Ethereum received 19 consecutive days of net inflows into spot-linked exchange-traded products (ETPs) totaling $1.37 billion, the longest positive streak since the 2021 bull-run.
• Over the same period ETH/USD rose 18.4 %, printing a local high at $2,750, but has since pulled back to $2,575 amid broad crypto risk-off and Middle-East tensions.
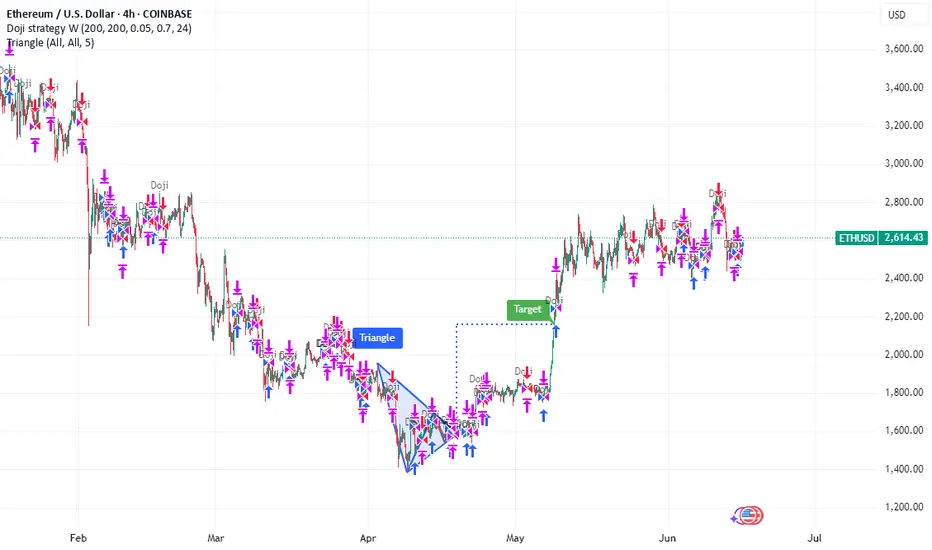
• The latest weekly candle morphs into a “pre-tower top” pattern—two tall green candles followed by a small-bodied doji—often a harbinger of heavy distribution if confirmed by another red week.
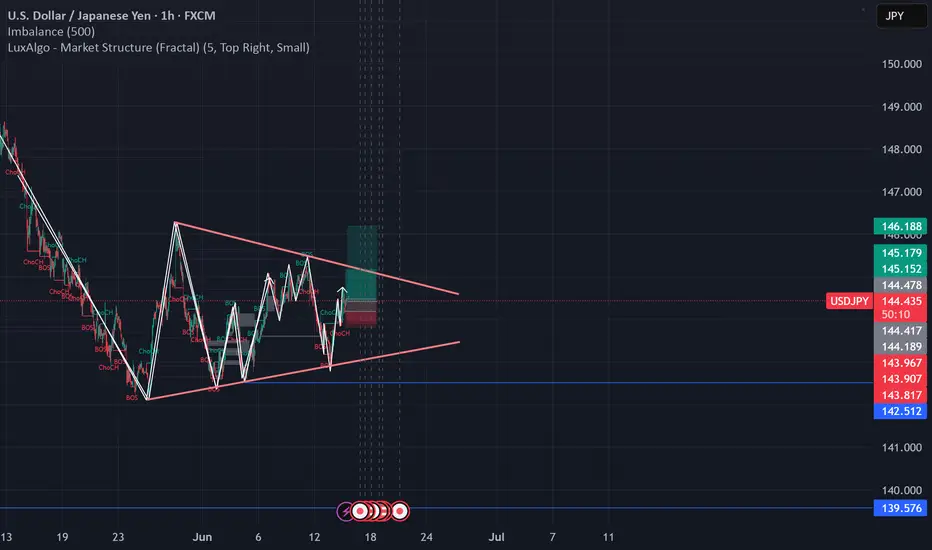
• Short-term structure improved Monday: price pierced a contracting-triangle ceiling at $2,550, reclaimed the 100-hour SMA, and now eyes $2,620 as the gatekeeper to renewed upside.
• Funding rates flipped neutral, exchange reserves hit a 7-year low, and staking deposits outpace withdrawals 1.7 : 1—on-chain signs that the sell-off is more leverage shakeout than top formation.
________________________________________
2. ETF Backdrop: How the 19-Day Inflow Wave Took Shape
2.1. The Players
Unlike Bitcoin’s mammoth U.S. spot ETFs, Ethereum’s inflow streak drew from Europe and Canada, where physically backed ETPs have traded since 2021. The three biggest contributors:
Product Country 19-Day Net Flow AUM Growth
21Shares Ethereum ETP (AETH) Switzerland +$502 m +38 %
CI Galaxy Ethereum ETF (ETHX) Canada +$458 m +29 %
WisdomTree Physical Ethereum EU +$227 m +24 %
Rumors of an SEC approval window “after the U.S. election” sparked pre-positioning; asset managers figured it was cheaper to accumulate now than chase later once liquidity explodes on Wall Street.
2.2. Flow Mechanics
When an ETP issues new shares, it must buy spot ETH or tap an AP that can supply coins—direct demand unmatched by equivalent selling pressure. Over the 19-day window, the net 396 k ETH of creation equaled 57 % of all new issuance from block rewards post-Dencun, creating a measurable supply squeeze.
2.3. Historical Context
The only longer stretch was January–February 2021 (27 days), which culminated in ETH exploding from $1,400 to $2,000. The key difference today: market cap is six times larger, so identical inflows exert a milder percentage impact, explaining why price “only” added ~18 %.
________________________________________
3. Chronology of Price: Day-by-Day Performance
Day Date ETF Net Flow Price Close % Δ vs. Prior Day
1 Mar 18 +$58 m $2,110 —
5 Mar 22 +$73 m $2,265 +7.3 %
10 Mar 27 +$94 m $2,430 +2.4 %
15 Apr 1 +$125 m $2,690 +3.8 %
19 Apr 5 +$81 m $2,750 +0.9 %
Across the stretch, realized volatility rose from 32 % to 46 %, but skew stayed positive, showing call demand outpaced puts until the very end, when geopolitical headlines flipped sentiment.
________________________________________
4. Weekly Chart Anatomy: The “Pre-Tower Top” Signal Explained
4.1. What Is a Tower Top?
In candlestick lore, a tower top comprises:
1. A tall green candle (strong breakout)
2. Another tall green candle (exhaustion)
3. A narrow doji or spinning top (equilibrium)
4. A large red candle (breakdown confirmation)
We currently have the first three pieces: the last two weeks of March delivered back-to-back 10 % advances; the first week of April closed as a +0.6 % doji. The pattern is not confirmed until a decisive red week engulfs the doji body (< $2,540).
4.2. Indicators
• RSI (weekly): 59 → ticking down from 68 high; still shy of overbought.
• MACD histogram: Positive but flattening.
• Bollinger bands: Price mid-point of upper band, room for one more expansion.
Conclusion: the candle warns of fatigue, but momentum hasn’t rolled over—yet.
________________________________________
5. Intraday Technicals: From $2,450 Low to the $2,620 Hurdle
5.1. Hourly Chart (Kraken Feed)
• Triangle Breakout: Price sliced through descending trend-line at $2,550, tagging $2,590.
• Moving Averages: ETH trades marginally above the 100-hour SMA ($2,575) but below the 200-hour ($2,610).
• Fibonacci Zones: $2,620 aligns with 0.5 retrace of the $2,750→$2,450 fall—classic reversal pivot.
A clean hourly close >$2,620 opens the door to $2,680 (0.618 Fib) and psychological $2,700. Failure rejects to $2,520 support cluster.
5.2. Order-Book Heat Map
Coinbase Pro data shows 1,300 ETH ask wall at $2,620 and a thinner 890 ETH bid at $2,520. Liquidity skew favors dip-buying, but bulls need market orders >1 k ETH to smash the ask block.
________________________________________
6. On-Chain & Derivatives Lens
6.1. Exchange Reserves
Centralized exchanges now hold 12.9 million ETH, lowest since July 2017. The 19-day ETF harvest accelerated an already extant down-trend of roughly 60 k ETH/week outflows, mostly into staking contracts and L2 bridges.
6.2. Staking Flows
• Beacon deposit contract: +188 k in April’s first week.
• Withdrawal queue: 11 k ETH—tiny relative to deposits.
• Effective deposit APR after Dencun: 3.2 %, still beating U.S. 2-year T-notes post-tax for many investors.
6.3. Perpetual Funding & OI
• Funding normalized to 0.007 %/8 h (≈ 3.2 % APR), down from 9 % at March highs—spec longs flushed.
• Open Interest shed $420 m in the two-day dip—liquidations, not fresh shorts, drove the wash-out.
6.4. Options Skew
• 25-delta risk reversal (1-month): flipped to –4 % (puts pricier than calls) for first time since January—hedging demand but nowhere near panic-level (–12 % in 2022 bear).
________________________________________
7. Fundamental Undercurrents
7.1. Dencun Afterglow & L2 Fees
Proto-danksharding (EIP-4844) slashed L2 data costs by 85 %, pushing average Arbitrum and Optimism transaction fees under $0.02. Cheaper blockspace fuels on-chain activity:
Metric Pre-Dencun Post-Dencun Δ
Daily L2 Txns 2.4 m 4.1 m +71 %
Bridged ETH to L2s 6.8 m 7.9 m +16 %
More usage → more gas burned → structural tailwind to ETH as a fee-burn asset.
7.2. DeFi TVL
Total value locked rebounded to $61 billion, led by EigenLayer and restaking hype. ETH comprises 68 % of TVL collateral—every lending loop pins additional demand.
7.3. Competing Narratives
• Solana season siphoned retail mind-share; SOL/ETH ratio popped 42 % YTD.
• Bitcoin L2s (Stacks, Rootstock) attempt to mirror Ethereum’s smart-contract moat, but dev tooling remains nascent.
•
Net: Ethereum retains developer supremacy (70 % of new GitHub commits among smart-contract chains) and therefore garners institutional comfort.
________________________________________
8. Risks & Catalysts
Factor Bearish Angle Bullish Rebuttal
Macro Sticky U.S. CPI halts Fed cuts → higher real yields weigh on non-yielders ETH staking yield + MEV is real cash-flow; Dencun lowers L2 costs → adoption offset
SEC Spot ETF Delay past Jan 2026 or outright denial kills U.S. inflow dream 19-day streak proves ex-U.S. capital is hungry; approval >0 is all it takes for supply shock
BTC Dominance Halving FOMO may keep Bitcoin’s share >55 %, starve ETH rotation Historical pattern: ETH rips 6-10 weeks post-halving as beta plays catch-up
Tower-Top Pattern Weekly confirmation could spark drop to $2,200 support Pattern fails if bulls recapture $2,750 quickly, turning doji into bullish flag
________________________________________
9. Playbooks for Traders and Long-Term Allocators
9.1. Short-Term Momentum (0–7 days)
• Bias: Range-trade $2,520–$2,620 until breakout.
• Instruments: ETH-perp on Bybit/Deribit, 3× leveraged tokens for reduced funding bleed.
• Trigger: 15-minute candle above $2,620 with ≥ $50 m aggregated CVD buys.
• Stop: $2,560 (triangle retest).
• Target: $2,680 then $2,700.
9.2. Swing (1–8 weeks)
• Bias: Accumulate dips as long as weekly stays >$2,350 (0.382 Fib of Oct→Mar leg).
• Tools: 1-month $2,500-$2,800 call spreads; spot with 25 % collar protection.
• Catalysts: SEC commentary May 23, FOMC June 18.
9.3. Position (6–18 months)
• Bias: Dollar-cost average into staking nodes; carry 4 % ETH on portfolio NAV.
• Thesis: EIP-4844 usage boom + probable U.S. ETF = $4–5 k fair value by 2026.
• Risk Control: Hedge 25 % notional via BTC-perp short if BTC.D >58 %.
________________________________________
10. Conclusion: A Pause, Not a Peak—If Key Levels Hold
The 19-day ETF inflow streak proves that institutional demand for Ethereum exists even without a U.S. spot vehicle. Price responded vigorously but not parabolically, reflecting the asset’s growing market-cap gravity. The nascent “pre-tower-top” weekly candle warns of exhaustion; confirmation, however, requires another bearish week that cracks $2,540 support.
Short-term order-flow shows willing dip buyers, staking metrics scream supply sink, and the macro backdrop—while shaky—fails to dent ETH’s relative value proposition versus fiat yields. Translation: Ethereum is vulnerable to headline-driven squalls but structurally sound.
If bulls recapture $2,620, the path to retest $2,750 and ultimately $3,000 reopens. Lose $2,450 and the tower top will complete, sending ETH toward $2,200 where ETF inflow buyers likely reload. For now, the balance of evidence favors consolidation with an upward skew—tower construction, perhaps, but no wrecking ball yet.
long 1hprice fails to break the low but broke the high showing strong bullish momentum. 3 takeprofits targets
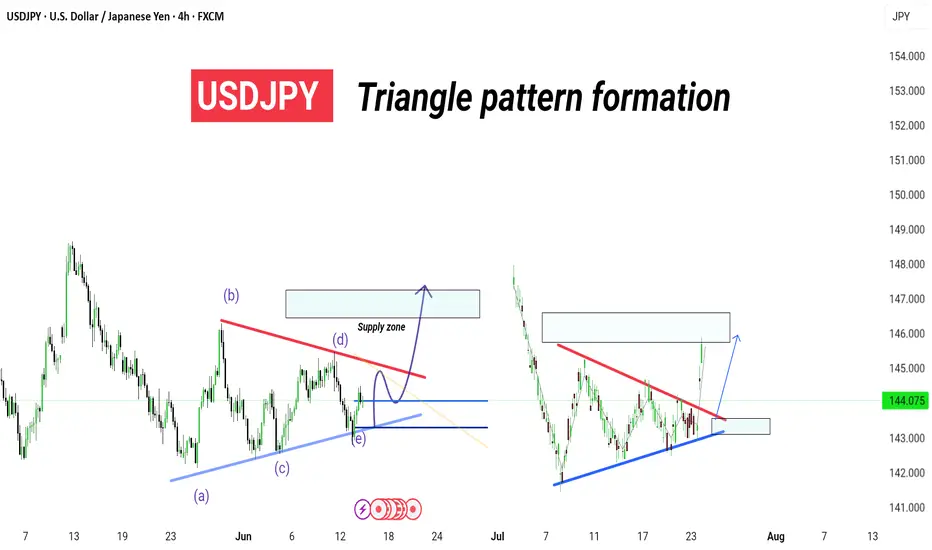
USDJPY – 4H . [[ TRIANGLE PATTERN ]]Technical Breakdown:
Symmetrical triangle pattern clearly formed with clean ABCDE wave structure.
The price has broken out from the upper resistance (trendline), confirming a bullish breakout scenario.
Next key area to watch is the supply zone near 145.800 – 146.200, where price may either:
Face resistance and retrace,
Or break through for continuation.
---
🔍 Key Levels:
Support Base (Retest zone): ~143.000
Breakout Entry Trigger: Above 144.200
Supply Zone Target: 145.800 – 146.200
Invalidation Level (Break Below Triangle): <142.500
---
🧠 Analysis Insight:
This is a classic triangle consolidation breakout, with price respecting both ascending and descending boundaries before thrusting upward.
Look for possible pullback retest entries before continuation to the supply zone.
Volume and momentum confirmation on breakout is key for sustainability.
---
🎯 Strategy Note:
Use low-risk entry setups on breakout retest.
Ideal for scalp to swing trades, with strong risk-reward structure.
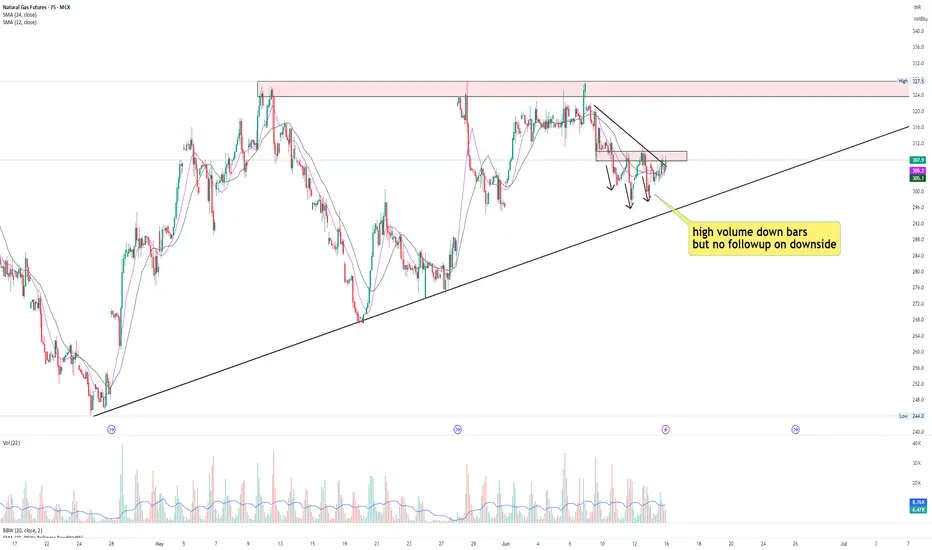
Naturalgas long tradeNaturalgas is resisting downside movement as witnessed on chart.
If you see the downward movement of Naturalgas, it is with relatively high volume but it is not coming down as expected from sellers and bouncing back up again as seen 3 times.
Now naturalgas has reached short term resistance zone of 307-310 from which it took support on 9th June, broke it on 10th June, took resistance on 11th and 12th June.
This might be a Change of Character zone for Naturalgas.
And now that Naturalgas is resisting downward movement, we might see breakout of this zone and probable upside movement.
Lastly it is also forming Ascending triangle which is still premature but just for reader's consideration.
Let's watch it on coming days.