CADNOK Short I've been short CADNOK since 7.9394 (the weekly symmetrical triangle resistance area). The trade was taken based on a weaker CAD. The NOK was irrelevant. At the time, I also went long EURCAD and short CADJPY and CADSEK.
The fundamental bias to sell the Canadian dollar is now even more substantial. However, I'm not planning to enter a second short. Instead, I'm holding my short position in anticipation of a bearish breakout of the symmetrical triangle.
CITYINDEX:CADNOK
Triangle

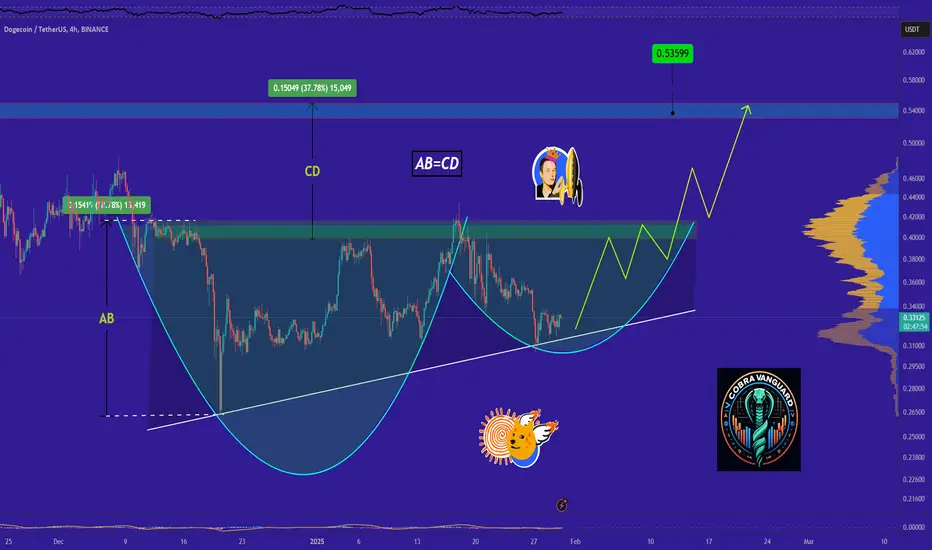
Do you think I'm joking ???As you can see, the price is forming two bullish patterns on the 4h timeframe, If my view is correct, DOGE will rise to $0.53 .
And if this pattern is correct and breaks, higher targets are possible.
Give me some energy !!
✨We spend hours finding potential opportunities and writing useful ideas, we would be happy if you support us.
Best regards CobraVanguard.💚
_ _ _ _ __ _ _ _ _ _ _ _ _ _ _ _ _ _ _ _ _ _ _ _ _ _ _ _ _ _ _ _
✅Thank you, and for more ideas, hit ❤️Like❤️ and 🌟Follow🌟!
⚠️Things can change...
The markets are always changing and even with all these signals, the market changes tend to be strong and fast!!
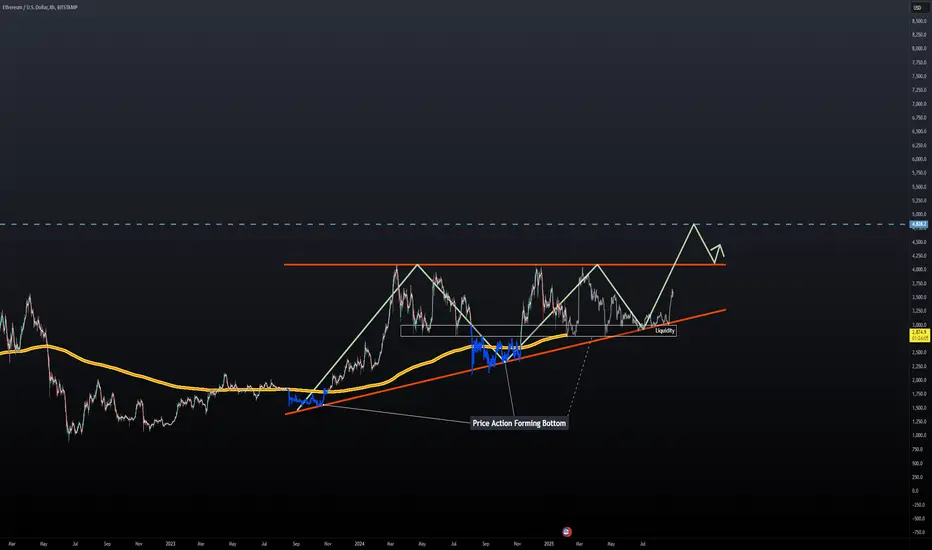
ETH | Alternative Chart Pattern | EducationJust a short update for my latest C&H post
Price is also forming an Ascending Triangle pattern with a liquidity zone of $2,800 - $3,000 for an average spot for buyer to step in
When trading chart patterns it's best to figure out how to jump in before the breakout similarly to the last touches highlighted in blue on the bottom trendline
You can see that price was forming a bottom-like pattern or what I also like to call price accumulation and then vice versa for the tops.
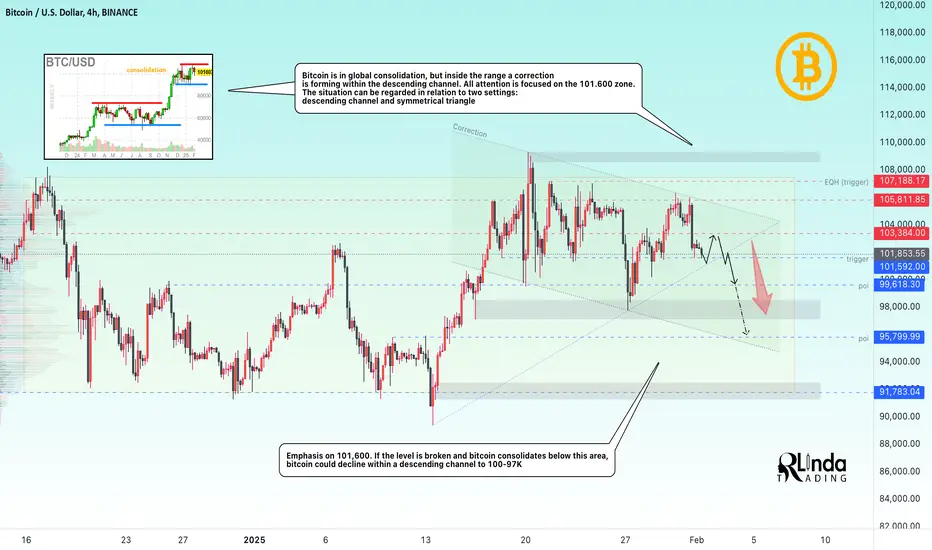
BITCOIN → The price is getting ready to drop to 100K - 97KBINANCE:BTCUSD is facing strong resistance. The price is being pushed away from the 105-107K zone as much as possible, forming a defense conglomerate. But, this resistance cannot overshadow the global bullish situation yet
A controversial situation is forming on H1-H4: a descending channel and a symmetrical triangle. And everything depends on what part of the market sees which figure. The primary reaction to the triangle support may be accompanied by a rebound, but based on the situation with the resistance, we can assume that the rebound from the triangle will not be deep and the price will try to go down.
If we look at the descending channel, the price is held back from falling by the support at 101.600.
Yes, technically, it is the support of 101.600 that plays the main role now. The main question is whether this level will hold the price or not.
Fundamentally, the situation is debatable, as the situation mainly depends on America, on how Trump and officials will use rhetoric regarding cryptocurrencies. It could be a bubble, a scam to win an election, or empty talk. Or it could be an actual strategy
Resistance levels: 103.4K, 105.8K
Support levels: 101.6K, 99.6K
Emphasis on 101.6. In the short term, I expect a breakdown and price consolidation below the level followed by a drop to 100-97K
BUT! Since there is a symmetrical triangle on the chart, a false breakdown of 101.6 may lead to a small upward bounce before a further fall to 100K
Regards R. Linda!
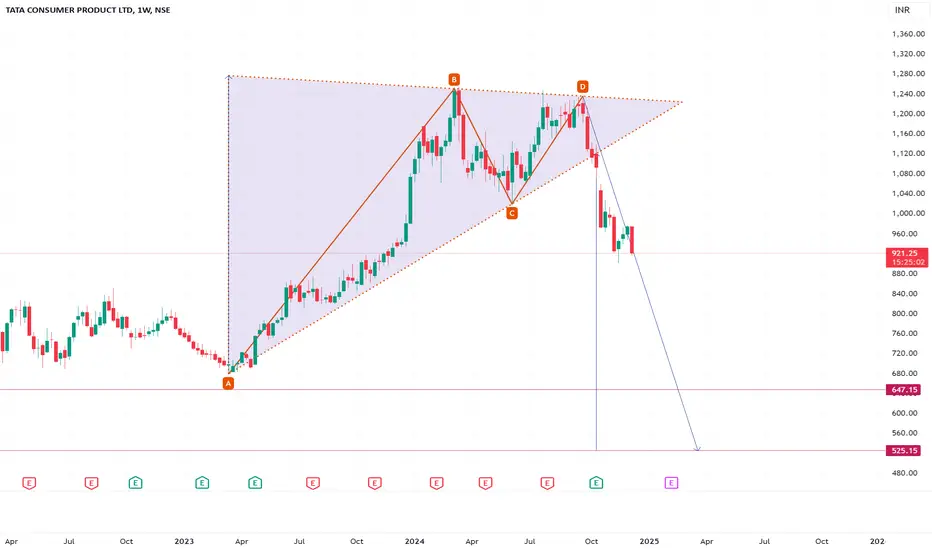
Tata Consumer Products - Bearish could touch 650 - 550Tata Consumer products has shown triangle pattern breakdown.
It could reach to 650 - 550 by March 2025.
BTCUSD price is getting ready to drop to 100,000 to 97,000BTCUSDT is encountering significant opposition. In order to create a defense conglomerate, the price is being forced as far away from the 105–107K range as feasible. However, the worldwide bullish position cannot yet be overshadowed by this resistance.
On H1-H4, a symmetrical triangle and a descending channel are developing into a contentious scenario. Additionally, everything is dependent on which market segment views which figure. Although a rebound may accompany the initial reaction to the triangle support, given the resistance, we can presume that the price will attempt to decline and that the triangle's rebound will not be significant.
The price is prevented from falling by the support at 101.600 if we examine the descending channel.
Yes, technically, 101.600's support is now what matters most. Whether or not this level will hold the price is the key question.
At its core, the issue is controversial because it primarily hinges on America and how Trump and other politicians would employ rhetoric around cryptocurrency. It might be empty rhetoric, a bubble, or a sham to win an election. Or it might be a real tactic.
Resistance levels: 103453, 105765
Support levels: 100150, 98890
Focus on 101.6. I anticipate a short-term price consolidation and fall below the level, followed by a decline to 100–97K BUT! A false breakdown of 101.6 could result in a brief upward bounce before a further down to 100K because the chart shows a symmetrical triangle.
Analysis By: NexusTradesZone

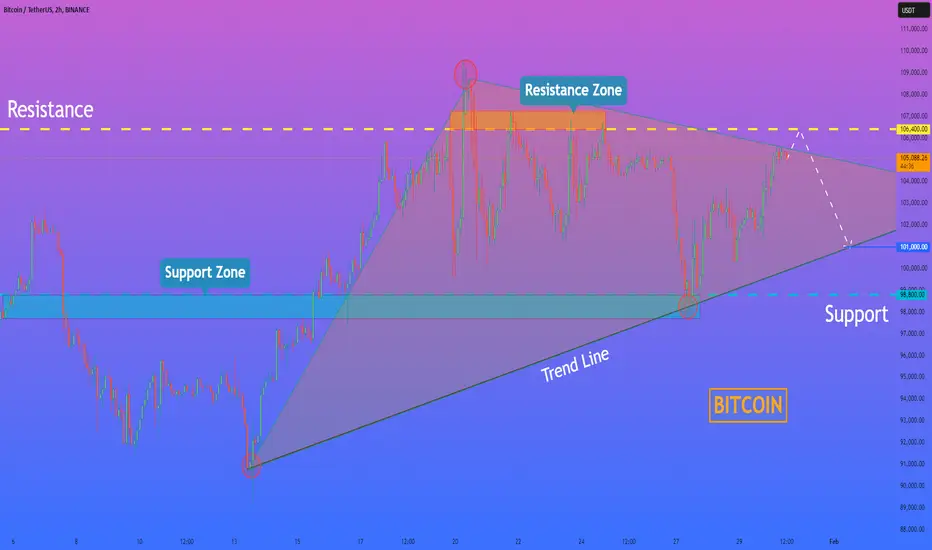
HelenP. I Bitcoin will grow to resistance level and then dropHi folks today I'm prepared for you Bitcoin analytics. If we look at the chart we can see how the price broke the support level and tried to grow more, but failed and in a short time declined to 91900 points firstly and then it fell to the trend line. After this, BTC turned around and started to grow inside a triangle pattern, where it soon reached the 98800 level, broke it, and continued to move up, after retesting. Later BTC rose to a resistance level, which coincided with the resistance zone, and even rose higher and reached a new ATH, but then it turned around and dropped below the resistance level, breaking it one more time. Then the price tried to return, but failed and some time traded near the 106400 level and then dropped to the support zone, where it reached the trend line, which is the support line of the triangle as well. After this, it rebounded up to the triangle pattern's resistance line, which continues to trade to this day. So, I expect that BTCUSDT will make a move up to the resistance level and then start to decline to the trend line, therefore I set my goal at 101K points, which coincided with this line. If you like my analytics you may support me with your like/comment ❤️
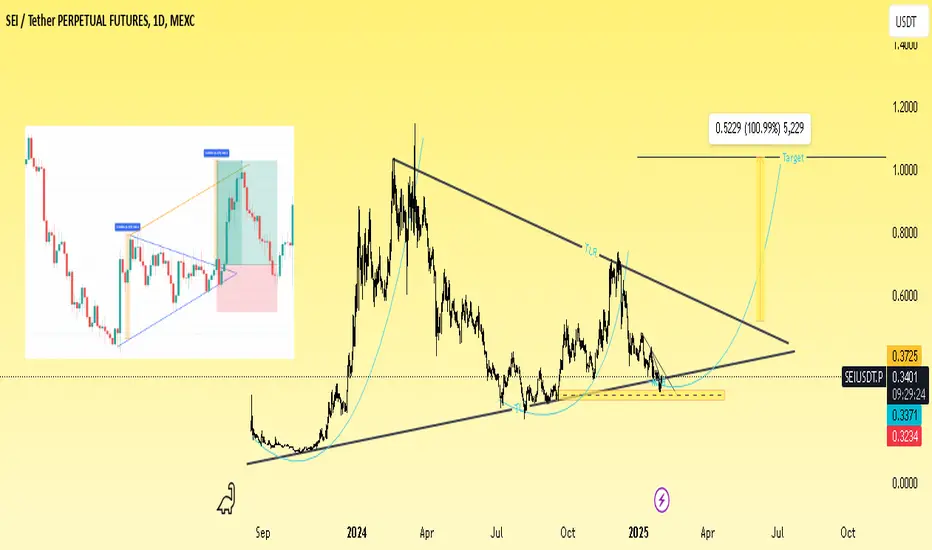
Buying Spot CMP Target $1SEI
Sei
SEI
#71
207K
$0.3398
3.36% (1d)
Market cap
$1.5B
3.36%
Volume (24h)
$111.57M
19.92%
FDV
$3.39B
Vol/Mkt Cap (24h)
7.45%
Total supply
10B SEI
Max. supply
--
Circulating supply
4.43B SEI
XPeng Could Be AcceleratingXPeng started rallying in August, and now it may be starting another push to the upside.
The first pattern on today’s chart is the series of lower highs in December. The Chinese EV maker broke that trendline in mid-January and has remained there since, which may suggest a consolidation phase has ended.
Second, the rebound started after prices held their November low. That may indicate new support has been established at higher levels.
Third, the 50-day simple moving average (SMA) and 100-day SMA crossed above the 200-day SMA in October. The current bullish sequence (faster SMAs above the slower ones) may be consistent with an uptrend.
Next, MACD is rising.
Finally, a XPEV has formed a tight ascending triangle near its high in November. Prices cleared the top of the pattern yesterday, a potential sign of bullish continuation.
TradeStation has, for decades, advanced the trading industry, providing access to stocks, options and futures. If you're born to trade, we could be for you. See our Overview for more.
Past performance, whether actual or indicated by historical tests of strategies, is no guarantee of future performance or success. There is a possibility that you may sustain a loss equal to or greater than your entire investment regardless of which asset class you trade (equities, options or futures); therefore, you should not invest or risk money that you cannot afford to lose. Online trading is not suitable for all investors. View the document titled Characteristics and Risks of Standardized Options at www.TradeStation.com . Before trading any asset class, customers must read the relevant risk disclosure statements on www.TradeStation.com . System access and trade placement and execution may be delayed or fail due to market volatility and volume, quote delays, system and software errors, Internet traffic, outages and other factors.
Securities and futures trading is offered to self-directed customers by TradeStation Securities, Inc., a broker-dealer registered with the Securities and Exchange Commission and a futures commission merchant licensed with the Commodity Futures Trading Commission). TradeStation Securities is a member of the Financial Industry Regulatory Authority, the National Futures Association, and a number of exchanges.
Options trading is not suitable for all investors. Your TradeStation Securities’ account application to trade options will be considered and approved or disapproved based on all relevant factors, including your trading experience. See www.TradeStation.com . Visit www.TradeStation.com for full details on the costs and fees associated with options.
Margin trading involves risks, and it is important that you fully understand those risks before trading on margin. The Margin Disclosure Statement outlines many of those risks, including that you can lose more funds than you deposit in your margin account; your brokerage firm can force the sale of securities in your account; your brokerage firm can sell your securities without contacting you; and you are not entitled to an extension of time on a margin call. Review the Margin Disclosure Statement at www.TradeStation.com .
TradeStation Securities, Inc. and TradeStation Technologies, Inc. are each wholly owned subsidiaries of TradeStation Group, Inc., both operating, and providing products and services, under the TradeStation brand and trademark. When applying for, or purchasing, accounts, subscriptions, products and services, it is important that you know which company you will be dealing with. Visit www.TradeStation.com for further important information explaining what this means.

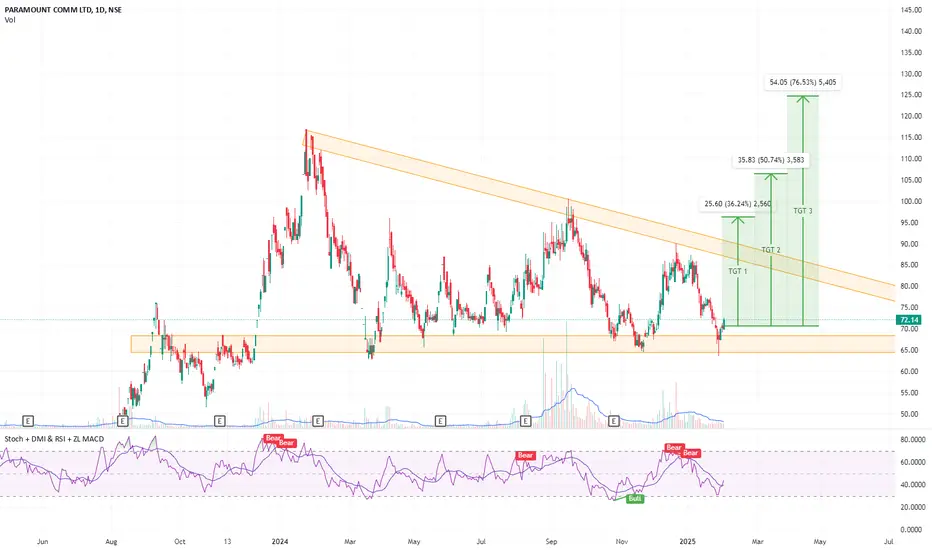
Para Cables reversing from support levelsReversing from support levels
Support zone 65-68
can start accumulating now
Breakout from triangle is still pending
Potential Targets could be
Target 1- 96
Target 2- 106
Target 3- 125
GOLD → The new ATH is not the limit. What are the new targets?FX:XAUUSD updates ATH to 2800 and at the same time bulls are consolidating above the previously broken high, trying to form a base for continued gains
Gold updates all time high to $2800, amid a weaker US dollar and the threat of high tariffs from Trump, who again warned of possible 100% duties against BRICS countries, as well as a 25% tax on imports from Canada and Mexico, which boosted demand for protective assets. Investors are waiting for the US PCE Core Price Index data to gauge the Fed's next steps.
Technically, now the focus is on 2 levels: 2798.5, which is a trigger for the continuation of growth and support at 2785, behind which there is a huge pool of liquidity. Gold needs to overcome 2798.5 to continue rising, but before that a retest of the support may be formed due to the liquidity under the level.
Resistance levels: 2798.5, 2800, 2810-15
Support levels: 2790, 2785, 0.5 fibo
In general, gold has a bullish price movement. There are no hints of a trend breakdown, so the chance for the continuation of the growth is quite high and it can happen either when the trigger is broken or after a small consolidation or correction before the news. Emphasis on the previously mentioned levels and news.
Regards R. Linda!

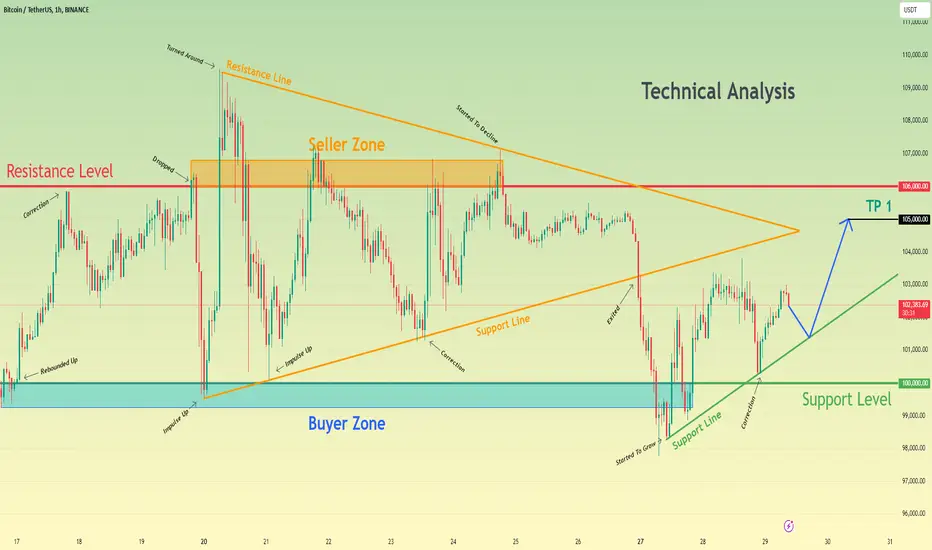
Bitcoin can make correction to support line and then rebound upHello traders, I want share with you my opinion about Bitcoin. Looking at the chart, we can see how the price some time ago rebounded from the support level, which coincided with the buyer zone and started to grow to the resistance level. When BTC almost reached the 106K level, it turned around and made a small correction, after which it rose to the seller zone in a short time. Then the price dropped to the buyer zone, after which made a strong impulse up to new ATH (109K points) and started to trades inside the triangle. In this pattern, the price at once made a correction movement to support line of the triangle and then repeated impulse up to the seller zone. After this movement, BTC made a correction to the support line of the triangle again and then backed up to the seller zone in a short time and even rose to the resistance line of the triangle pattern. Next, the price started to decline and later fell to the support level, exiting from the triangle pattern and also then broke the 100K level and fell below. But then BTC started to grow near the support line and soon broke the 100K level one more time and continued to move up next. Recently it made correction and then continued to grow, so, in my opinion, Bitcoin can correct to support line again. After this, I expect that the price will continue to move up the resistance level. That's why I set my TP at 105K points. Please share this idea with your friends and click Boost 🚀
When Will the 2025 Altcoin Season Arrive? Clue from OTHERS.DCRYPTOCAP:OTHERS.D is copying the same script as the last two altcoin seasons.
I’ve marked points 1-8 in the structure.
Each time, it formed a triangle consolidation before breaking into a bull run.
In the last two cycles, point 8 was the final low before the rally.
Right now, it's retesting point 8, which is the lower boundary of the triangle.
Will it repeat the script and break out, or is this time different?
Could we see a new scenario, or is it possible that altcoin season won’t come at all?
If the altcoin season does happen, OTHERS could 2x from here.
What do you think?
Do you believe we’ll see a crazy 2025 altseason?
for more future script "guesses" like this!
💰 Bitget 20% Trading Fee Discount:
lihi2.com

USDCHF → The bullish trend may get its continuationOANDA:USDCHF is entering the realization phase after a prolonged correction. A favorable background is created by the uptrend and rising dollar
The technical outlook on the daily timeframe is very good. The price after breaking the trend resistance tested the previously broken line. The currency pair after the false breakout managed to consolidate above the key point, marking an interim bottom and further prospects.
Technically, the focus is on the resistance at 0.911, if the bulls can overcome this area and consolidate above this level, the currency pair will be able to realize a rise to 0.918 - 0.93.
Resistance levels: 0.911
Support levels: 0.90555
Before breaking the resistance, the currency pair could test 0.90555 due to the liquidity generated below this area. But, the trigger that can provoke further growth is 0.911
Regards MARKET ANALYZER

Meta, time to enter?Hi everyone!
Pattern: Meta formed an ascending triangle from Jan 2024 up to Sep 2024 where it broke out of the pattern. Currently retesting the breakout level and has potential for long entry.
Price target: The price target for ascending triangle breakout pattern is the measure of the height of the triangle from its base to the resistance line. Add this to the breakout point and we get the target price of 670$
Caution: If the price fall back to the triangle, this analysis is not valid anymore.

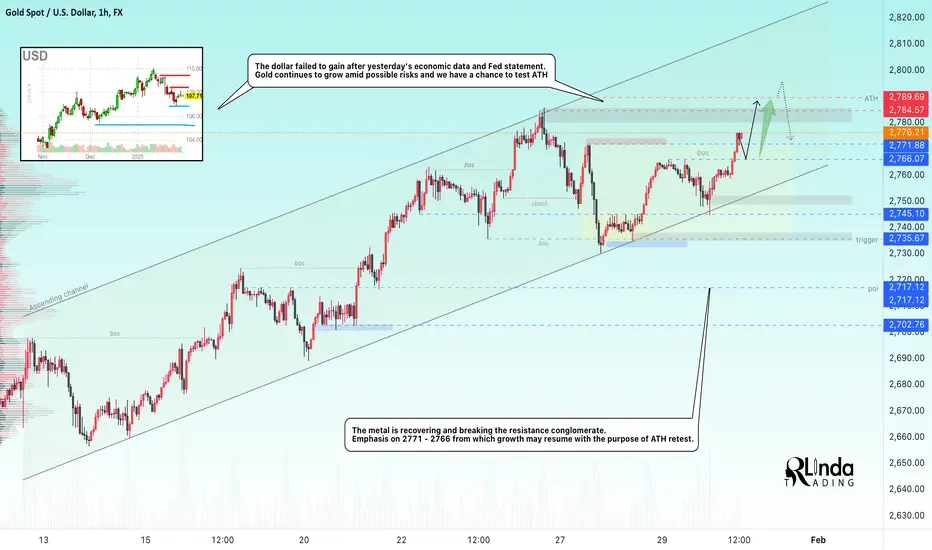
GOLD → Buyers are serious about retesting ATHFX:XAUUSD on the background of yesterday's news played both ways. The dollar could not win from this situation, which as a whole favorably affects the price of metal. ATH as a target is still relevant.
All attention is focused on the US GDP data for Q4. Slowdown in economic growth may increase interest in gold as a protective asset, especially against the background of possible trade tariffs of Trump and ambiguous reports of techno-giants. The Fed kept the rate, but tightened the rhetoric, which temporarily weakened gold, but the weak dollar and understanding of economic risks helped the metal to partially recover.
Technically, the rebound from the support of the ascending channel is forming, the price is passing resistance levels on its way.
Resistance levels: 2784, 2790
Support levels: 2771, 2766
Technically, from these support zones we should continue to wait for the growth towards 2790. But, based on the manner of price approach to the historical maximum, there is a probability of a small correction from 2790, after which the market will show either readiness to go even higher, or to form a deeper correction.
Regards R. Linda!
ONDOUSDT → Resistance Breakthrough. Ready for the raceBINANCE:ONDOUSDT.P continues to hold an uptrend with cyclical counter-trend corrections. The chart is showing signs of an end to the correction and a readiness to go up
A rather large consolidation has been formed against the background of the main uptrend. Regarding this, the price is trying to go up, breaking the resistance of consolidation (triangle) and overcoming the next obstacle in the form of key resistance at 1.538. The emphasis is on this level. If the bulls manage to keep the defense above 1.538 support, ONDO may show a recovery to 1.7 - 1.9 - 2.15 in the short to medium term.
Support levels: 1.538, 1.44
Resistance levels: 1.7344, 1.90
A small pullback to support and formation of a false breakdown is possible, but price consolidation above the level will be a confirmation of readiness to go up. Targets are marked on the chart!
Regards R. Linda!

PARACABLES | Buy @ current Price with strict SL Disclaimer:
This is not financial advice. Please do your own research or consult with a financial advisor before making any investment decisions. Investments in stocks can be risky and may result in loss of capital.

GOLD (XAUUSD): Get Ready For Breakout
It feels like Gold is going to update the All-Time High soon.
I see clear signs of a bullish accumulation on a horizontal
resistance based on a current highest high.
A breakout of the underlined orange area and a candle close above
will indicate the continuation o a global bullish trend.
The market will most likely continue rising at least to 2820.
Alternatively, if you are looking for a bearish confirmation,
a breakout of the support of the channel will give you a strong bearish signal.
❤️Please, support my work with like, thank you!❤️

✅BTC's situation+next targets and expected movements.Hello.
As you can see, Bitcoin failed to break the Ascending triangle in its last attempt, and now it is making a fourth downward wave based on Elliott , and than we have to wait for Bitcoin's rise.
👀To motivate me ,Like ❤️ & Share 🌐 this post with your friends ! Thanks for your support ♥️
⚠️Things can change...
The markets are always changing and even with all these signals, the market changes tend to be strong and fast!!

$ROKU - channel breakout above $83.50ROKU - stock getting tight in the channel. possible breakout coming soon. Looking for calls above $83.50 for a move towards $90 and $100. Stock is looking strong on indicators. on high watch

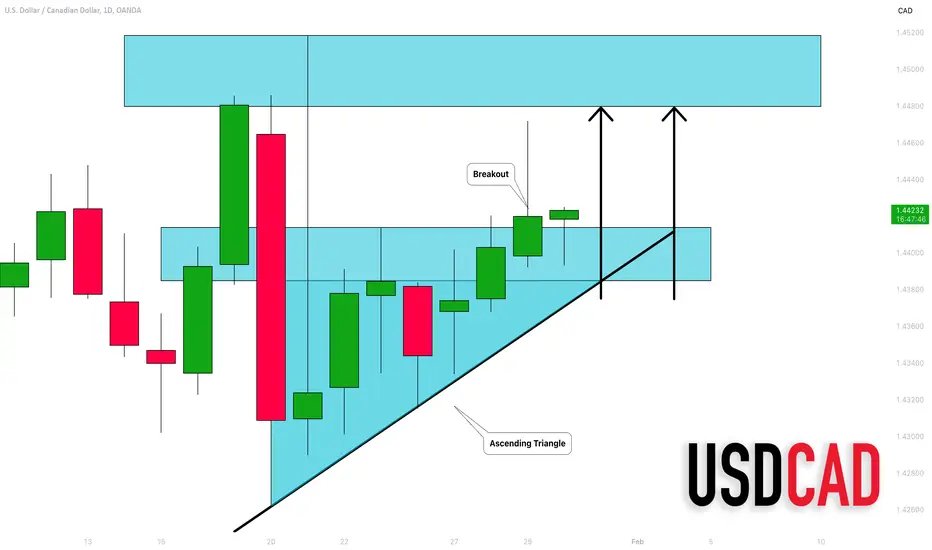
USDCAD: To the Year's High 🇺🇸🇨🇦
USDCAD looks bullish after a breakout of a neckline
of an ascending triangle pattern on a daily.
Probabilities are high, that the resistance based on the year's high
is going to be reached soon.
Goal - 1.448
❤️Please, support my work with like, thank you!❤️
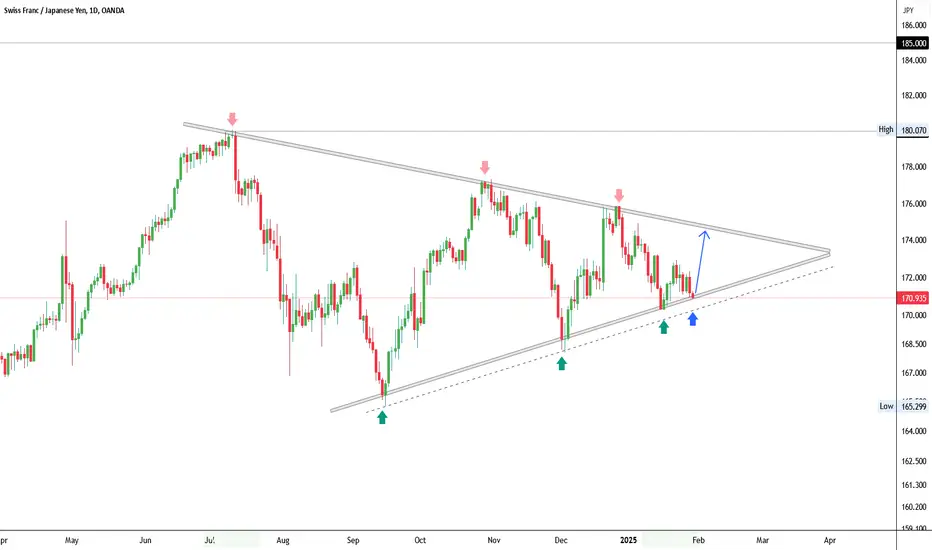
CHFJPY Opportunities in Symmetrical Triangle PatternCHFJPY is currently consolidating within a symmetrical triangle pattern on the Daily time frame, indicating a potential rebound movement in the near future.
My trading plan is to buy if the price successfully rebounds at the lower boundary of the triangle or breaks out to the upside from the pattern, which could provide further confirmation for a bullish trend. The profit target for this setup is in the 180 to 185 area, which represents the next resistance level. A stop loss is placed below the lower boundary of the triangle to ensure proper risk management.
Disclaimer:
This analysis is part of trading plan and does not constitute trading advice. Always apply proper risk management in every trading decision.
Feel free to share your thoughts or request other analyses—just drop a comment!