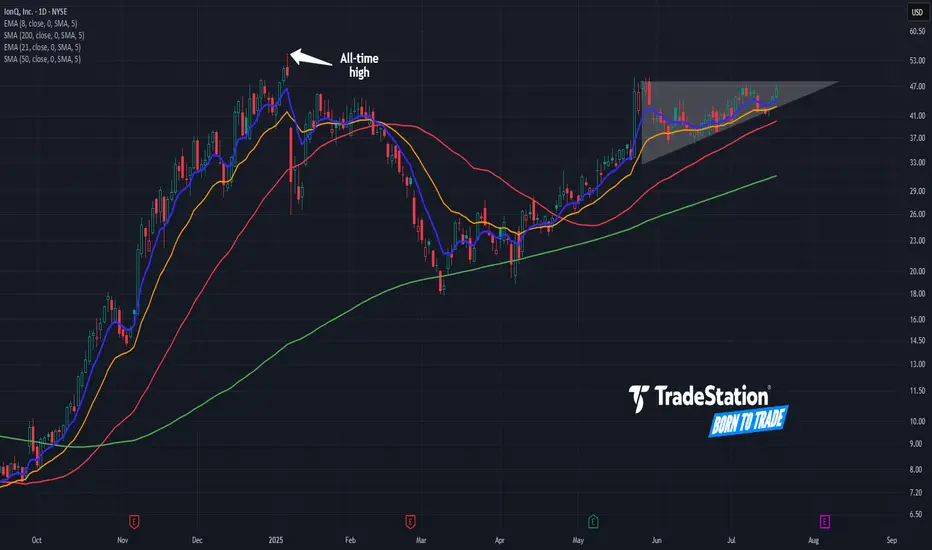
IonQ: Potential Continuation Pattern IonQ had a big surge in late 2024, and now some traders may see potential for continuation to the upside.
The first pattern on today’s chart is May 27's closing price of $48.04. IONQ has made a series of higher lows while remaining below that level, which may be viewed as a bullish ascending triangle.
Second, prices are near the all-time high of $54.74 in January. Could the stock be coiling for a move into new territory?
Third, IONQ is above its rising 50- and 200-day simple moving averages. That may be consistent with a longer-term uptrend.
Fourth, the 8-day exponential moving average (EMA) is above the 21-day EMA. That may be consistent with a short-term uptrend.
Next, IONQ is a fast-growing player in the emerging field of quantum computing. Given the overall focus on technology and increased competition with China, some investors may view the stock as a means to participate in the trend.
Finally, IONQ is an active underlier in the options market. (It’s averaged about 100,000 contracts per session over the last month, according to TradeStation data.) That may help traders take positions with calls and puts.
TradeStation has, for decades, advanced the trading industry, providing access to stocks, options and futures. If you're born to trade, we could be for you. See our Overview for more.
Past performance, whether actual or indicated by historical tests of strategies, is no guarantee of future performance or success. There is a possibility that you may sustain a loss equal to or greater than your entire investment regardless of which asset class you trade (equities, options or futures); therefore, you should not invest or risk money that you cannot afford to lose. Online trading is not suitable for all investors. View the document titled Characteristics and Risks of Standardized Options at www.TradeStation.com . Before trading any asset class, customers must read the relevant risk disclosure statements on www.TradeStation.com . System access and trade placement and execution may be delayed or fail due to market volatility and volume, quote delays, system and software errors, Internet traffic, outages and other factors.
Securities and futures trading is offered to self-directed customers by TradeStation Securities, Inc., a broker-dealer registered with the Securities and Exchange Commission and a futures commission merchant licensed with the Commodity Futures Trading Commission). TradeStation Securities is a member of the Financial Industry Regulatory Authority, the National Futures Association, and a number of exchanges.
Options trading is not suitable for all investors. Your TradeStation Securities’ account application to trade options will be considered and approved or disapproved based on all relevant factors, including your trading experience. See www.TradeStation.com . Visit www.TradeStation.com for full details on the costs and fees associated with options.
Margin trading involves risks, and it is important that you fully understand those risks before trading on margin. The Margin Disclosure Statement outlines many of those risks, including that you can lose more funds than you deposit in your margin account; your brokerage firm can force the sale of securities in your account; your brokerage firm can sell your securities without contacting you; and you are not entitled to an extension of time on a margin call. Review the Margin Disclosure Statement at www.TradeStation.com .
TradeStation Securities, Inc. and TradeStation Technologies, Inc. are each wholly owned subsidiaries of TradeStation Group, Inc., both operating, and providing products and services, under the TradeStation brand and trademark. When applying for, or purchasing, accounts, subscriptions, products and services, it is important that you know which company you will be dealing with. Visit www.TradeStation.com for further important information explaining what this means.
Triangle
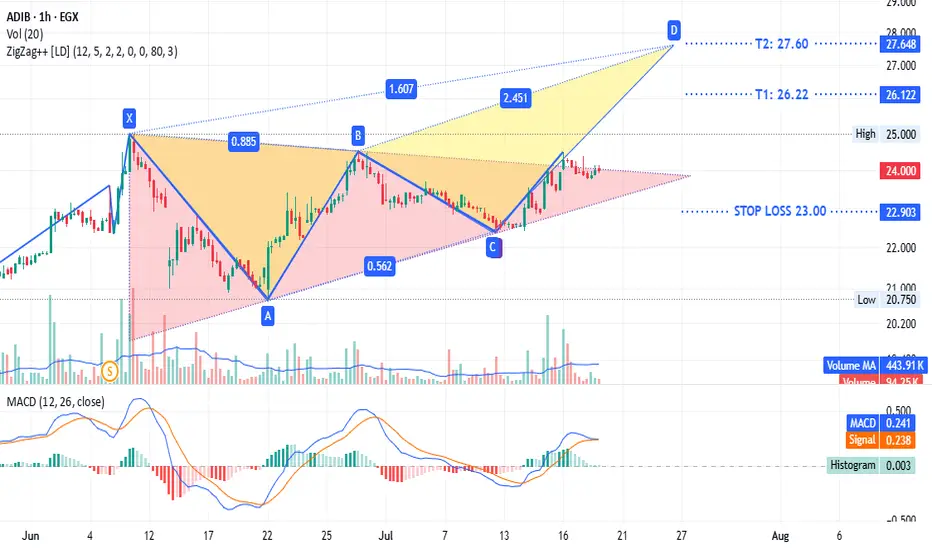
ADIB - same $comi patternADX:ADIB timeframe 1 hour
Is showing a triangle pattern with a potential bearish trend. It is currently testing the upper line of the triangle. The stop loss is at 23.00, and the target sell point ranges from 26.22 to 27.60.
This is not investment advice, only my analysis based on the chart data. Consult your account manager before making any investment decisions. Good luck.
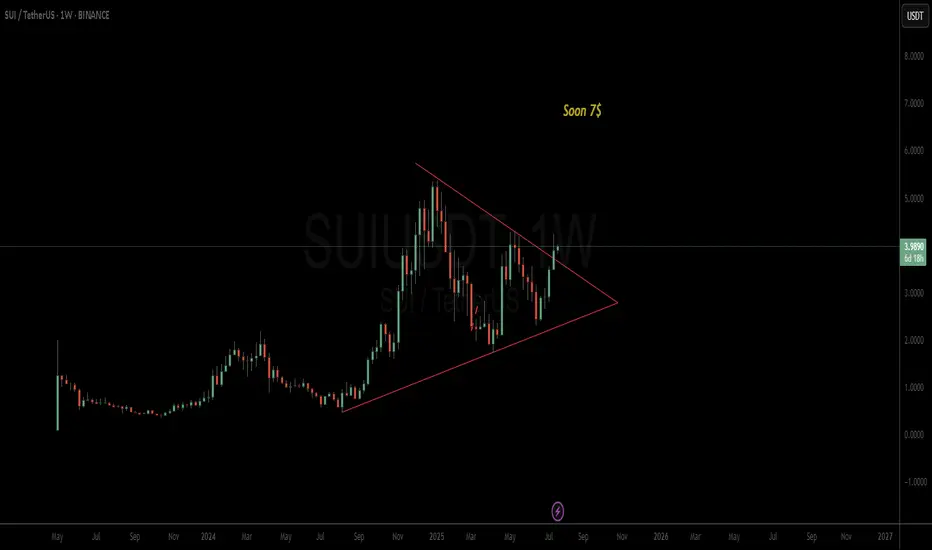
SUI potentail to 7$The chart is clear, folks
The triangle broke, and SUI has the potential to rise to 7$
Good luck
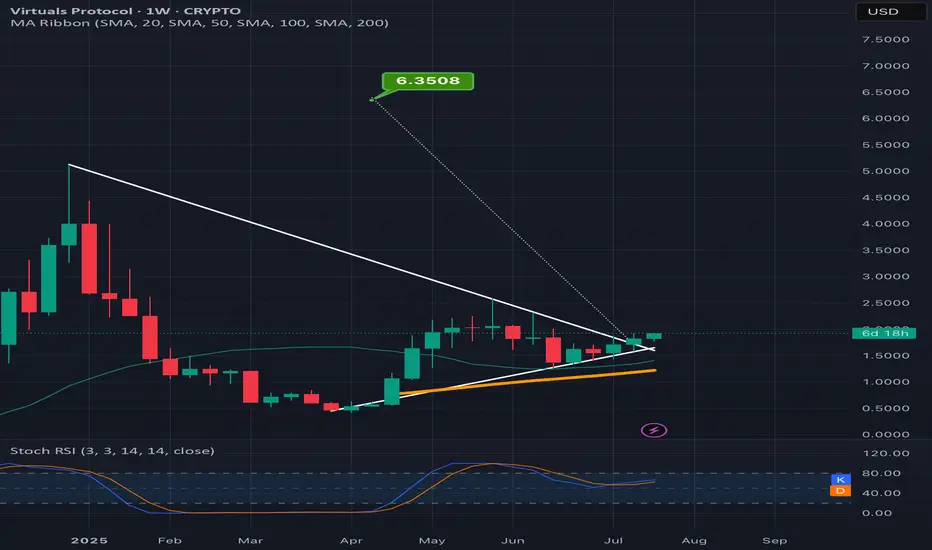
virtuals breaking up from a symmetrical triangle w/a 3x + trgtIf this pattern validates its breakout, the measured move target from here is over 3x. *not financial advice*
ACH - LongWeekly Chart Pattern: Ascending Triangle
An ascending triangle does not guarantee that the stock will enter bearish territory, it can go either way.
ACH is a bit lagging coin comparing to other mainstream cryptos. I have played it twice to the big resistance at ~0.058
PT1: ~.058
PT2: After retesting 0.058
Resistance: ~0.033
Support - Stoploss :~.017

Australia 200: Pullback Presents Second Chance for LongsThe Australia 200 contract continues to trade above former horizontal resistance at 8627, with Monday’s pullback offering an improved entry level for longs looking to buy the breakout.
Bullish positions could be established ahead of 8627, with a stop beneath for protection. The session high of 8727 looms as an initial test for longs, with a push above that level opening the door for further upside.
While some like to use extension targets, the preference would be to wait for a clear topping pattern before exiting the trade. Others may prefer to adopt a target based on the desired risk–reward of the trade.
Bullish price momentum is showing signs of picking up again, favouring a similar bias. Iron ore futures are also flying in Asia, likely assisting gains across the underlying materials sector.
Good luck!
DS

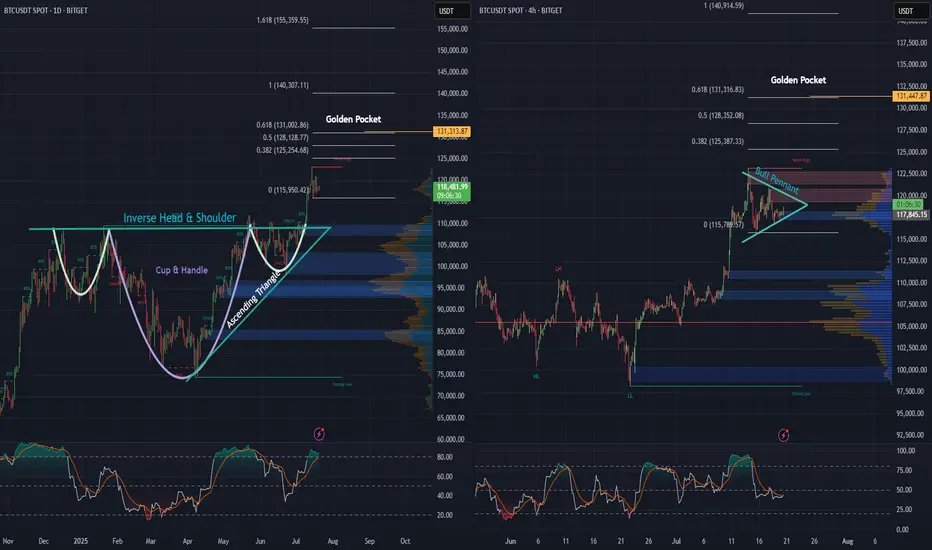
BTC daily, and 4 hr. Bullish Patterns Stack Up!Looking at the Daily and 4-hour charts for BTC, we can see multiple bullish formations unfolding.
An inverse head and shoulders - daily
A cup and handle - daily
An ascending triangle - daily
Price action looks strong, as we’ve begun the breakout from the neckline on the inverse H&S, as well as the cup and handle and ascending triangle simultaneously, and momentum is building fast.
Also, on the 4-hour chart, there’s a pretty substantial bull pennant taking shape. A breakout here could be the next leg up, and the push needed to keep momentum alive.
Zooming out, when we apply the trend-based Fibonacci extension, it reveals a $131,000 golden pocket, on both the the daily as well as the 4 hr. And that could be a major upside target if these bullish structures hold.
Stay tuned to see if BTC continues its move and sets a new all-time high.
Double Bull Flags on an Ascending Triangle breakout on the dailyDaily, double Bull Flag, on top of an Ascending Triangle Breakout. Golden Pocket on the Fib Ext is $588 🥂

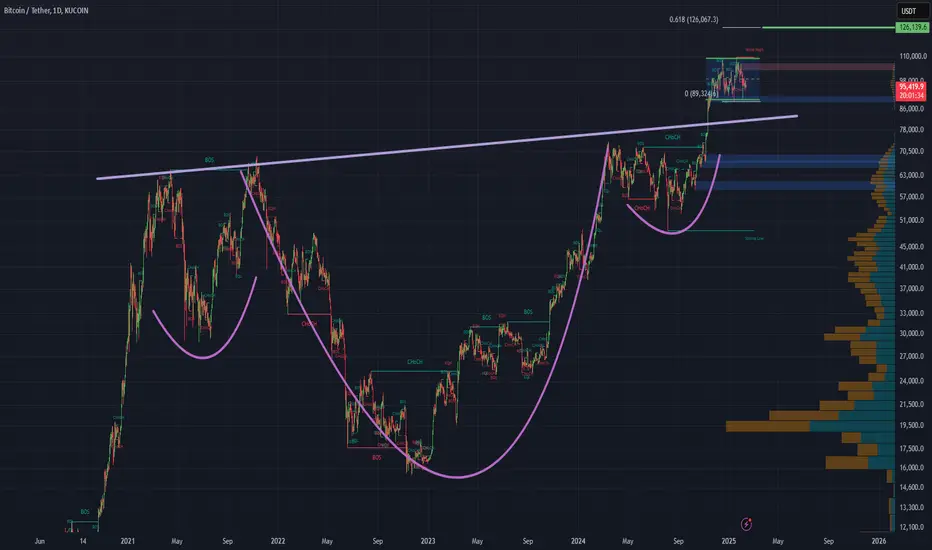
Bitcoin: Promising Patterns and Potential BreakoutBitcoin's recent price action has been nothing short of captivating for traders and analysts alike. On the daily chart, we've observed the formation of an Inverse Head & Shoulders and a Cup & Handle pattern, both of which have now transitioned into a Bull Flag. These bullish signals suggest a strong potential for upward movement.
Zooming into the 4-hour and 1-hour charts, we can see prominent Ascending Triangles taking shape. These patterns are often harbingers of significant breakouts, and it appears that Bitcoin is winding up for a substantial move.
Moreover, when utilizing a Trend-based Fibonacci Extension on the daily timeframe, the golden pocket points to a target of $126k, with the next pocket at $185k. This aligns with historical data and technical indicators, suggesting that Bitcoin might be poised to rewrite history once again.
Stay tuned as we monitor these developments and anticipate what could be a historic breakout for Bitcoin!
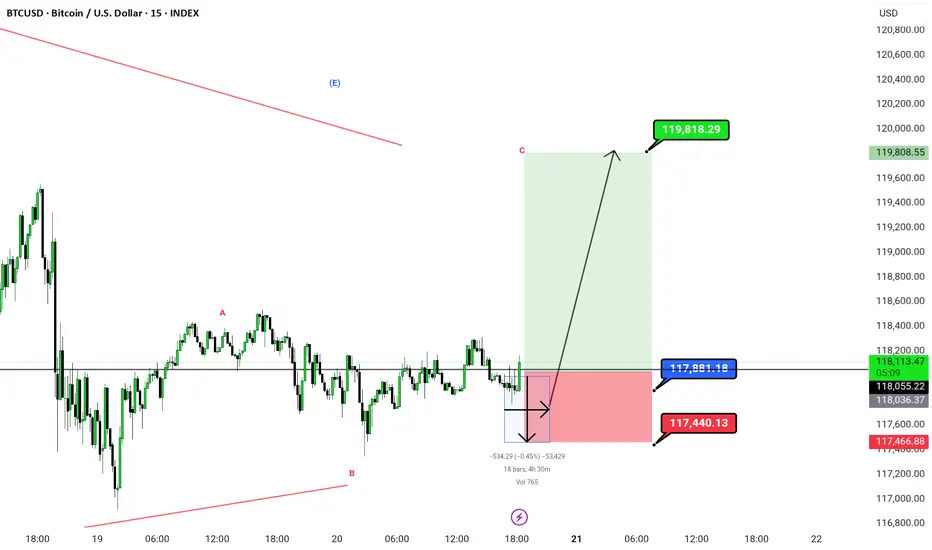
Btc triangle burst |. Bullish This chart shows a 15-minute timeframe analysis for BTC/USD (Bitcoin/US Dollar) using Elliott Wave .
---
📊 Chart Summary:
Wave Structure:
Labeled with corrective wave A–B–C, indicating the end of a corrective pattern.
Price is currently in the potential reversal zone near Wave B, suggesting a bullish move toward Wave C completion.
---
✅ Trade Setup:
Entry Zone: Around current price levels (≈117,889.74)
Stop Loss (SL): 117,440.13 (marked in red)
Target (TP): 119,818.29 (marked in green)
Risk-to-Reward Ratio (RRR): Approx. 1:4, a favorable trade setup
---
🔍 Key Technical Observations:
Bullish Projection: A large green zone indicating strong bullish momentum if Wave C plays out.
Invalidation Zone: Price falling below 117,440.13 would invalidate the bullish count.
Volume Marker: Small thunderbolt symbol at the bottom could imply a volume spike or a critical event time.
Chart Title: Published under Greenfireforex branding, timestamped Jul 20, 2025, likely indicating a public or private analysis post.
---
📌 Possible Interpretation:
This chart suggests a buy opportunity for BTCUSD if price respects the bottom zone (117,440) and begins to climb toward the projected target (119,818). It uses wave theory logic assuming this is a Wave C rally, and price has completed a corrective move.
I'm ready to answer in comments session
Dogecoin - Time to buy again!So if you pay attention to the DOGE chart you can see that the price has formed a Ascending Triangle which means it is expected to price move as equal as the measured price movement.( AB=CD )
NOTE: wait for break of the triangle .
Best regards CobraVanguard.💚

BTC Analysis (2H)Bitcoin is currently consolidating within a symmetrical triangle, suggesting indecision in the market. However, a breakout is imminent — and when it comes, it will likely be sharp.
🔹 Bullish Scenario:
A breakout above $120K would likely lead to a new All-Time High near $124K.
🔹 Bearish Scenario:
A breakdown below $116,400 opens the door for a quick drop toward the $112K–$110K zone, which should be considered a buy opportunity.
⚠️ Pro Tip:
There’s a volume imbalance just below the $116.4K level. If price breaks below it, the move down may be faster and more aggressive than expected — so plan accordingly.
Regardless of short-term volatility, the macro trend remains bullish, and Bitcoin will rise again.
Thanks for reading.

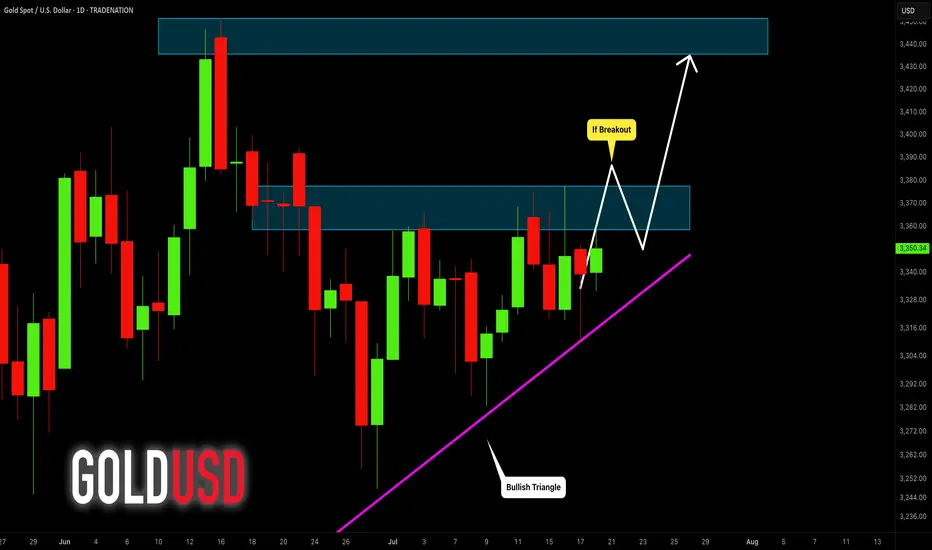
GOLD (XAUUSD): Sticking to the Plan
Update for my last Sunday's post for Gold.
Previously, we spotted a cup & handle pattern on a daily time frame.
It turned into an ascending triangle pattern - another bullish formation this week.
I am sticking to the same plan - our strong bullish signal is a breakout
of a neckline of the pattern and a daily candle close above 3378.
It will confirm a strong up movement.
❤️Please, support my work with like, thank you!❤️
I am part of Trade Nation's Influencer program and receive a monthly fee for using their TradingView charts in my analysis.
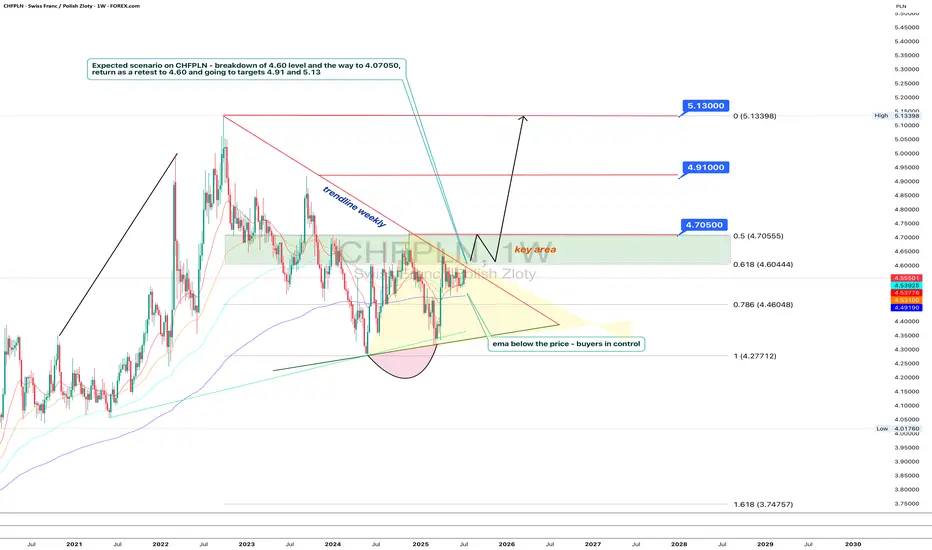
Polish zloty in trouble: Swiss franc is sharpening its teethTechnically, CHFPLN has completed a consolidation phase within a narrowing triangle and broke to the upside. The pair is now testing the 4.60 level (the 0.618 Fibonacci retracement) from below — a decisive zone. A breakout and confirmation above this area opens the path toward 4.705, which coincides with the 0.5 Fibo level and a local resistance. A pullback from that zone back to 4.60 is possible, but this time as a support retest. If the level holds, the targets remain: 4.91 and 5.13 - both marked by Fibonacci extensions and major long-term horizontal resistance. The EMAs are aligned in support of further upside, with price consistently trading above them.
Fundamentally, the Swiss franc remains a safe-haven currency, especially amidst increasing instability in the Eurozone. Weak growth in Germany, looming ECB policy easing, and rising inflationary pressures are all tilting investor interest toward CHF. Meanwhile, Poland faces political uncertainty, budgetary debates, and volatility in the agricultural and energy sectors. All of this strengthens the case for the franc in this pair.
Tactically, the game plan is straightforward: a confirmed breakout above 4.60 signals the start of a bullish impulse. The 4.60–4.705 zone is the key area of interest for buyers. If this zone is reclaimed and held, the next targets - 4.91 and 5.13 - remain valid, where large players may look to take profits.
If this scenario plays out, the zloty may soon be tuning into Polish radio to sing nostalgic songs about the golden days of its strength.
Gold may rise a little and then drop to support levelHello traders, I want share with you my opinion about Gold. Initially, gold was trading within a large consolidating pennant, showing both upward and downward impulses as it moved between the converging trend lines. The price eventually saw a breakout from this pattern, followed by a strong impulse up, but this momentum stalled as it approached the major horizontal resistance level at 3390. This level, which corresponds with the upper seller zone, has proven to be a significant barrier for buyers, rejecting the price and confirming a strong seller presence in that area. Currently, the market is in a corrective phase after being rejected from the highs. The price is drifting upwards once again in what appears to be a final retest of the aforementioned seller zone. This slow upward movement lacks the impulsive strength of the previous trend, suggesting that buyers are losing control and sellers are preparing to defend the 3390 resistance level once more. I expect this corrective move to fail upon reaching the seller zone around 3390. After this retest, I anticipate a sharp reversal and the beginning of a new downward trend. The logical target for this move is the major support level at 3310, an area that has historically acted as a strong buyer zone. That is why my TP is set at 3310. Please share this idea with your friends and click Boost 🚀
Disclaimer: As part of ThinkMarkets’ Influencer Program, I am sponsored to share and publish their charts in my analysis.

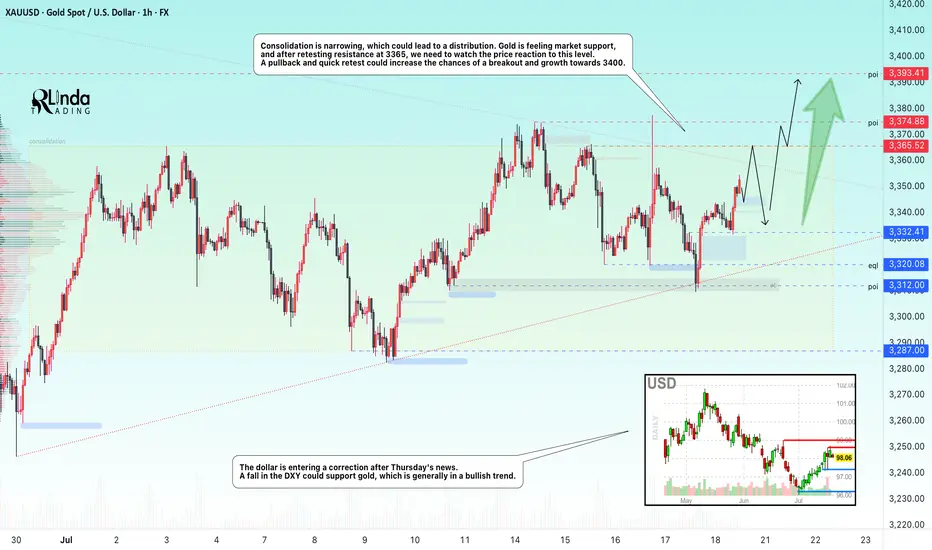
GOLD → Retest of consolidation resistance. Chances of a breakoutFX:XAUUSD bounces off support at 3312, forming a false breakdown at 3320. The price is heading towards consolidation resistance. The chances of continued growth are increasing...
Gold rebounded from its low amid statements by Fed member Waller about a possible rate cut in July. However, strong US sales and labor market data strengthened the dollar and held back XAU/USD growth. Despite statements by some Fed members about maintaining a tight policy, traders continue to expect rate cuts before the end of the year. The focus is on new economic data that could affect the dollar and gold prices.
Technically, consolidation is narrowing, which could lead to distribution. Gold is feeling market support, and after retesting resistance at 3365, we need to watch the price reaction to the level. A pullback and quick retest could increase the chances of a breakout and growth to 3400.
Resistance levels: 3365, 3375
Support levels: 3332, 3320, 3312
There is a high probability that there will be an attempt to break through the consolidation resistance amid expectations of a rate cut. This phase may be accompanied by either a correction to retest and return for a breakout, or a breakout and consolidation of the price above the level. Today, Friday, I expect a retest and correction, as there may not be enough local potential for a breakout of this level, and the price has already lost some of its momentum since the opening of the session...
Best regards, Linda!
BTC/USD – Triangle Wave E Setup (Potential Bullish Breakout)Bitcoin is currently forming a contracting triangle (ABCDE) structure on the 1H chart. The market appears to be respecting the lower trendline support and could be completing Wave D, now preparing to push into Wave E.
🟢 Entry Zone: 117086 – 117076
🎯 Targets:
• 118709
• 119823
⛔ Stop Loss / Invalidation: Below 117043
🧩 Pattern: Elliott Wave Contracting Triangle
📅 Timeframe: 1H (Heikin Ashi)
📌 Chart by: @Greenfireforex
📌 Wait for a bullish confirmation candle above the support zone for a safe long setup. Triangle break could lead to momentum continuation toward the targets.
---


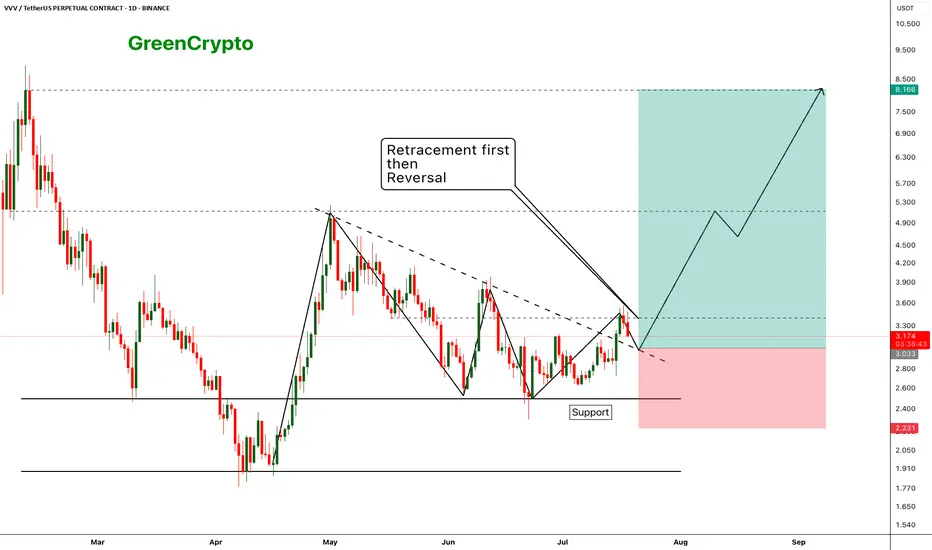
VVV - Expecting perfect reversal after the retracement- price has broken out from the resistance trendline and now we are seeing a retracement as expecting
- Price should hold the support (previous resistance) and reverse from the suppport zone.
- we can enter our trade once the retracement completed
Entry Price: 3.033
Stop Loss: 2.231
TP1: 3.411
TP2: 4.037
TP3: 4.851
TP4: 6.360
TP5: 8.028
Max Leverage 5x.
Don't forget to keep stoploss.
Cheers!
GreenCrypto
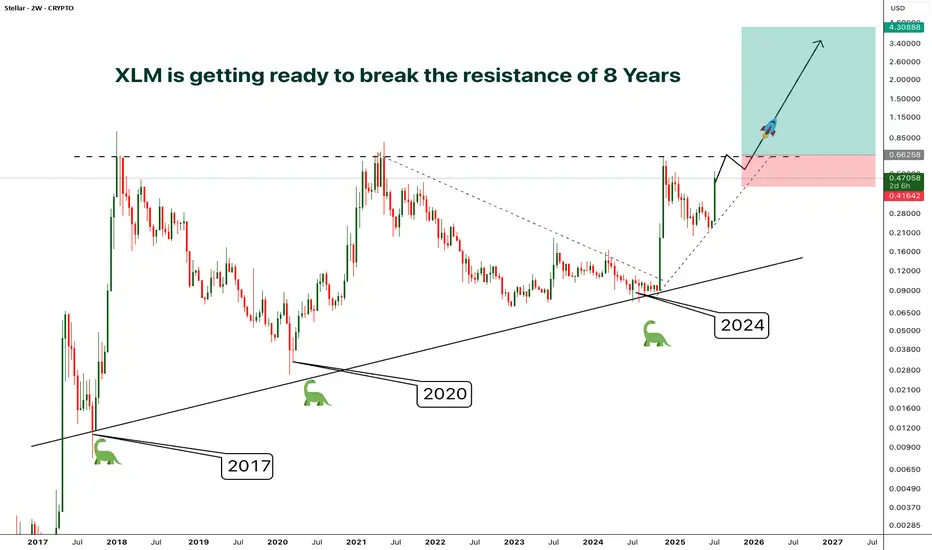
XLM - Resistance/Consolidation of 8 Years- Finally after 8 years of consolidation and getting rejected by the resistance at the same level around 0.65, XLM is preparing to break out from the almost decade old resistance
- A clear breakout from this resistance will phenomenal
- The price surge after the breakout will be unlike anything you've ever seen.
- I'm planning to enter after a confirmed breakout, entry before the breakout will be risky in case if the price gets rejected again.
Entry Price: Candle closeAbove 0.65
Stop Loss: Below 0.41
TP1: 0.88574
TP2: 1.21012
TP3: 1.92545
TP4: 2.68849
TP5: 4.27772
Don't forget to keep stoploss
Cheers
GreenCrypto
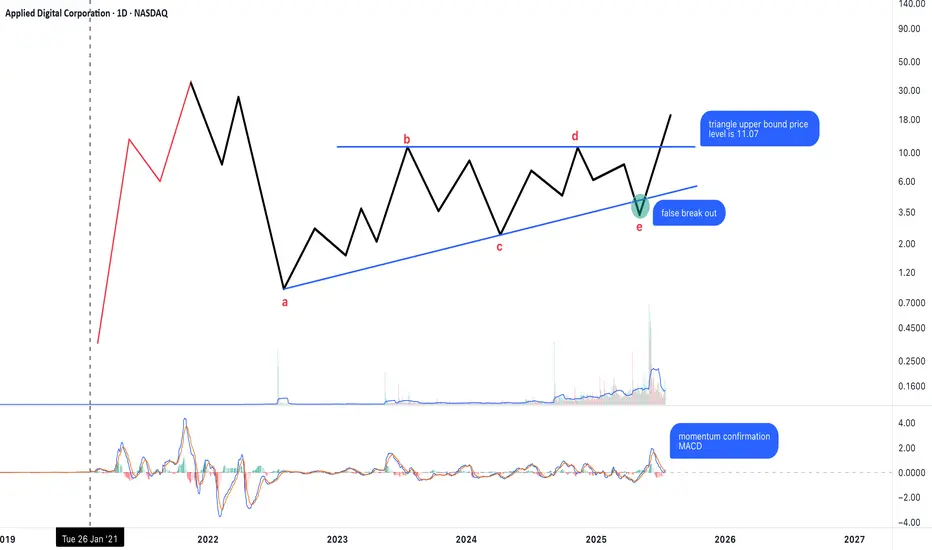
Possible Neutral Triangle Breakout – Key Level at 11.07The chart appears to show a completed neutral triangle (a–b–c–d–e), with a breakout emerging above the upper boundary at 11.07.
Wave a looks like a complex structure (possibly elongated flat or flat + zigzag).
The rest of the legs are mostly zigzag forms, consistent with triangle rules.
False breakdown below wave e followed by a strong reversal.
MACD is confirming momentum during the breakout attempt.
As long as price stays above 11.07, this breakout may be sustained. If confirmed, the next target zone could align with the height of the triangle projected upward.
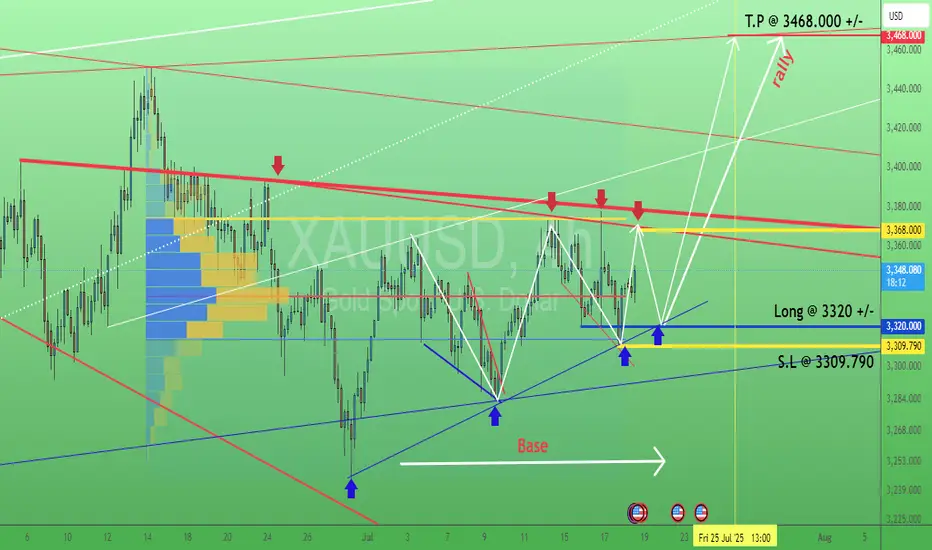
Gold. Swing trading signal. 18/July/25XAUUSD probably still ranging within 3309 - 3368 before breakout to the upside...targeting still around 3460 +/-