XAU/USD Forms Bearish Continuation Triangle – Future Downside
XAU/USD (4H) | FX | Gold Spot vs US Dollar
🔴 SHORT BIAS
📅 Updated: July 18
---
🔍 Description
Gold is trading within a bearish contracting triangle, suggesting a continuation move to the downside after the recent corrective bounce. Price is currently approaching the key 3,371–3,376 resistance zone, which aligns with the 78.6% Fibonacci retracement and upper triangle boundary.
This resistance confluence could mark the termination of the (E) wave of the triangle, paving the way for a larger downward thrust. A confirmed break below 3,302 would open the door toward 3,221 as the next major target.
The structure also leaves room for a minor internal triangle (a)-(b)-(c)-(d)-(e) pattern within the broader range, reinforcing the bearish setup.
---
📊 Technical Structure (4H)
✅ Bearish contracting triangle: (A)-(B)-(C)-(D)-(E)
✅ 78.6% Fibonacci + supply zone = ideal rejection point
✅ Internal triangle projection aligns with lower support test
📌 Downside Targets
Target 1: 3,302.47
Target 2: 3,221.78
🔻 Invalidation: Above 3,376.03
---
📈 Market Outlook
Macro View: Rising real yields and cooling inflation reduce gold’s appeal
Fed Watch: Hawkish tone supports USD, weighing on XAU
Technical View: Structure favors downside break from triangle formation
---
⚠️ Risks to Bias
Break and daily close above 3,376.03 invalidates triangle structure
Sudden risk-off sentiment or dovish Fed shift could boost gold demand
Sharp reversal in dollar strength
---
🧭 Summary: Bearish Breakout Setup Forming
XAU/USD is completing a bearish triangle structure, with price sitting just below resistance. A rejection from the 3,371–3,376 zone can trigger a breakout lower, first toward 3,302, then extending to 3,221. As always, confirmation and tight risk control are key.
---
Triangle

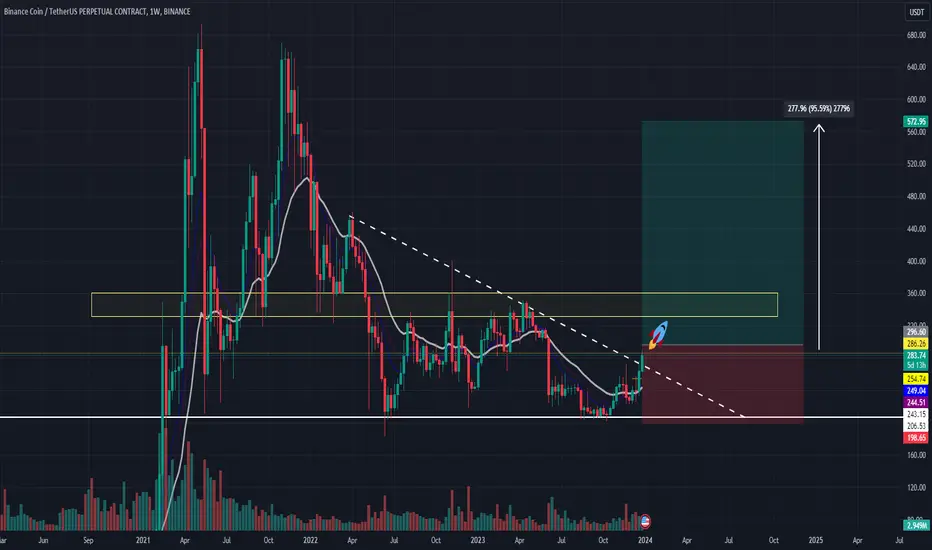
XRP rally to $8.50After XRP broke above the resistance at $1.80 now that became the major support for the past few months and XRP is taking off again.
According to this huge monthly triangle and calculate from the breakout, so the next target for XRP is $8.50 for the coming months.

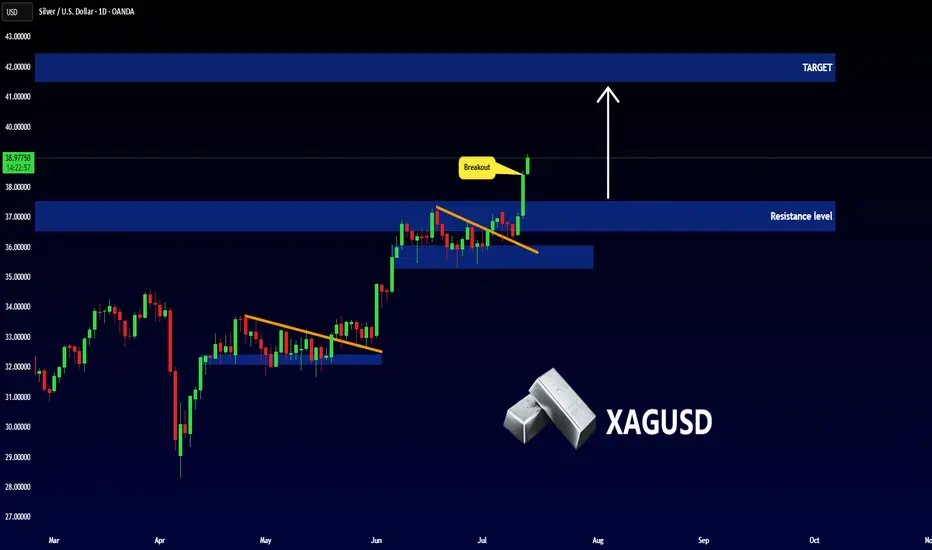
SILVER - NEW BREAKOUT !Hello Traders !
The Silver price formed a bullish descending triangle!
Currently, the resistance level (37.50 - 36.50) is broken!
This key level becomes new support level!
So, I expect a new bullish move🚀
______________
TARGET: 41.50🎯
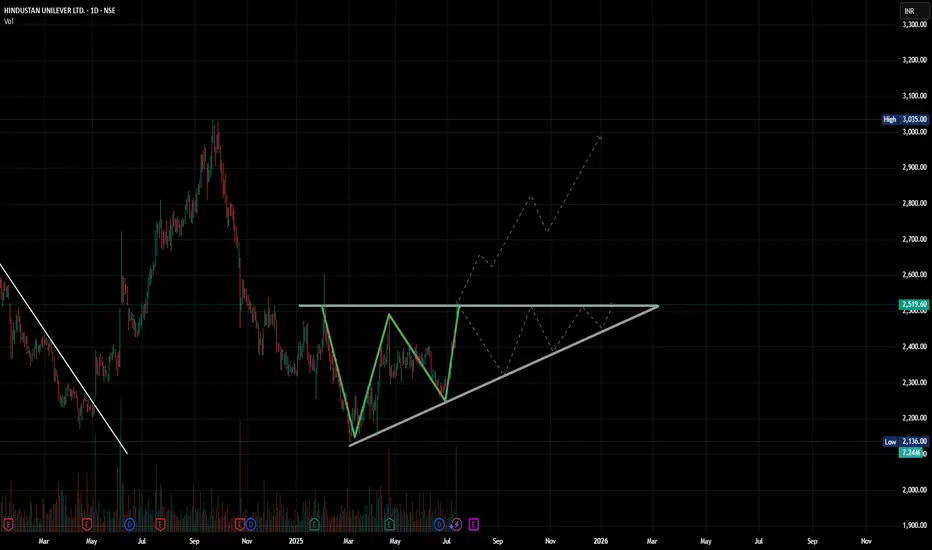
W For Win? HUL Pulls Up with a Perfect Double BottomPrice showing up to resistance like it forgot the last time it got slapped here. But this time it brought volume. Respect?
(Or the probable ascending triangle.. u know?)
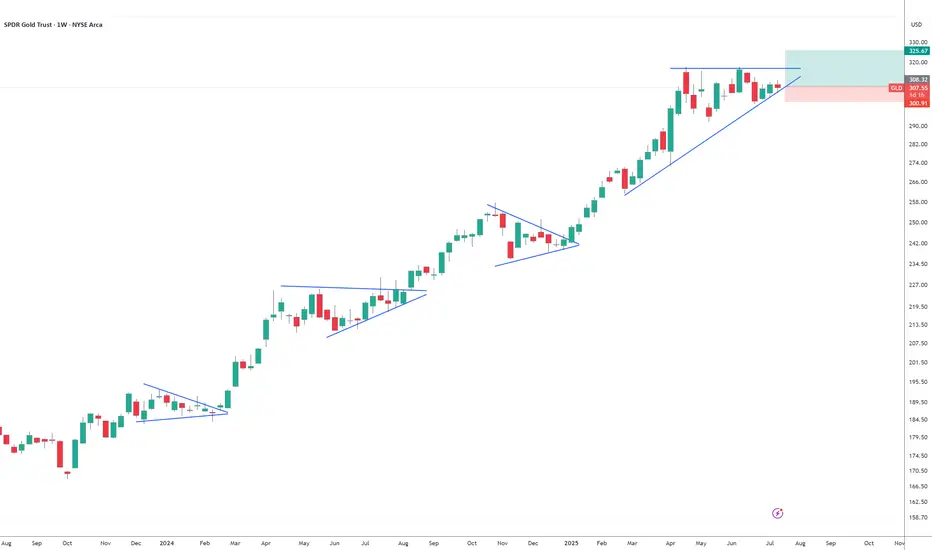
Gold!!!!!Looks like GLD is setting up for a big move to the upside. It likes to consolidate for a few weeks before a massive breakout. I have some GLD calls strike 310 for September 19. My SL triggers if a weekly candle closes under trendline. TP 325 ish.
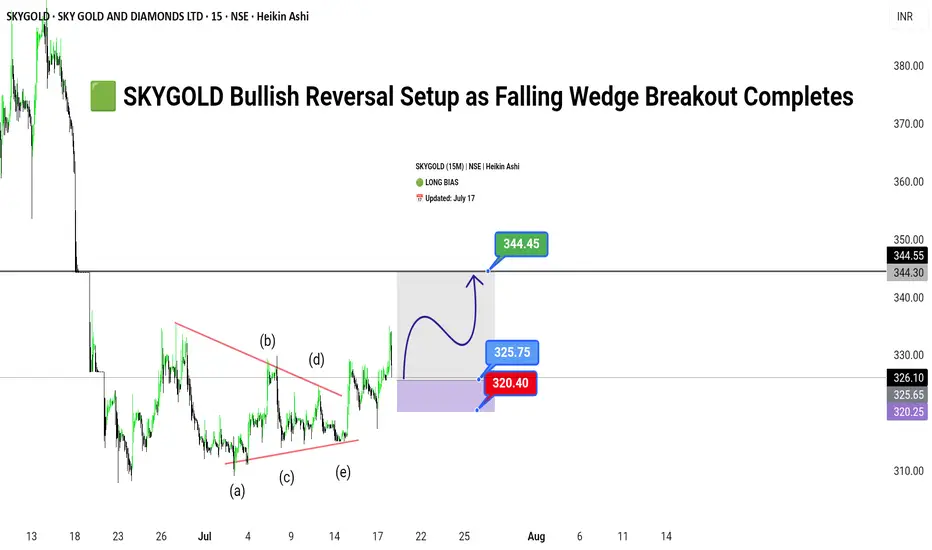
SKYGOLD Bullish Reversal Setup as Falling Wedge Breakout Complet🟩
SKYGOLD (15M) | NSE | Heikin Ashi
🟢 LONG BIAS
📅 Updated: July 17
---
🔍 Description
SKYGOLD has emerged from a prolonged corrective phase, breaking out of a well-defined falling wedge pattern on the 15-minute chart. The price action has respected a clean Elliott Wave ABCDE structure within the wedge, suggesting a completed consolidation cycle. With bullish momentum building above ₹325, the stock now appears poised for a breakout rally towards ₹344.45.
This setup reflects both a technical breakout and possible short-covering rally, making it an attractive opportunity for short-term swing traders. However, risk remains below the ₹320.40 zone, which invalidates the breakout structure if breached.
---
📊 Technical Structure (15M)
✅ Breakout above wedge resistance
✅ ABCDE wave structure complete (classic consolidation)
✅ Impulse targets in sight
📌 Upside Targets
First: ₹325.75
Final: ₹344.45
🔻 Risk Zone
Below: ₹320.40 (Breakdown invalidates setup)
---
📈 Fundamental/Flow Highlights
Sector Sentiment: Positive traction in mid-cap jewellery and gems segment.
Volume Spike: Notable rise in volume on breakout candle.
Short-Covering Potential: Highly likely due to prolonged consolidation.
---
⚠️ Risks to Watch
Sudden broad market correction in Nifty Midcap segment.
Lack of follow-through volume post-breakout.
Intraday rejection near ₹344 zone (previous supply).
---
🧭 Summary: Bias and Watchpoints
SKYGOLD is bullish above ₹325 with a breakout structure favoring continued upside toward ₹344.45. As long as the price holds above ₹320.40, the long thesis remains valid. Watch volume confirmation, and use trailing SL to lock gains.
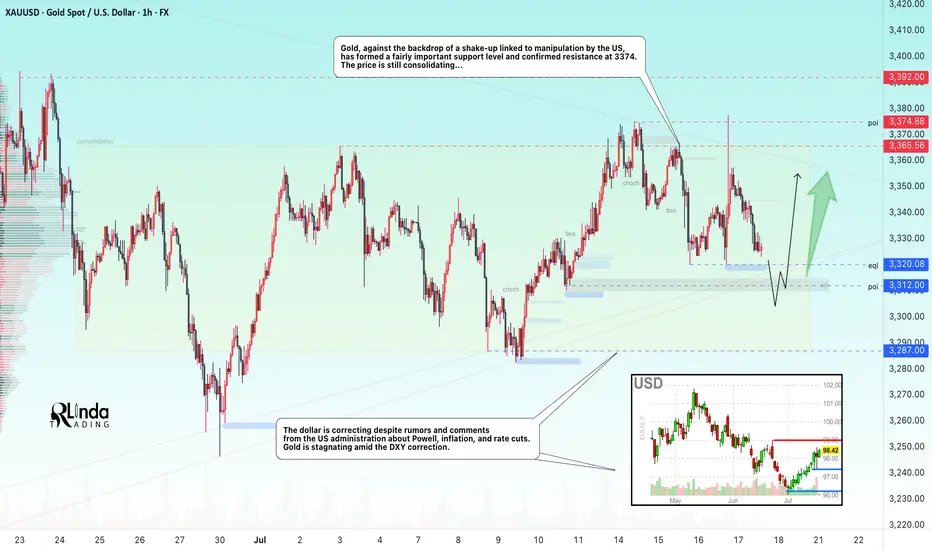
GOLD → The triangle is contracting. Retest of support...FX:XAUUSD tested a local high of 3375 but quickly returned to consolidation. The reason is manipulation by the US administration related to Powell, inflation, and interest rates...
Demand for gold has risen sharply amid global risks: Trump's aggressive tariff plans, strong inflation, and uncertainty about the Fed's actions have increased interest in defensive assets. Despite the temporary strengthening of the dollar, gold remains a popular hedging instrument. Technical analysis also points to a bullish outlook. However, growth potential is limited until the Fed clarifies its interest rate policy
Technically, on the D1 chart, it is clear that the price is consolidating, with the range continuing to narrow. Due to the bullish factors listed above, we can expect growth to continue. However, it is difficult to say where and when the growth will begin due to the uncertainty factor. All attention is on the support at 3320-3312, the triangle support, as well as the consolidation support at 3287.
Resistance levels: 3365, 3375
Support levels: 3320, 3312, 3287
Since the opening of the session, the price has spent part of its daily range, so there may not be enough potential for the decline to continue. A false breakdown of support and consolidation of the price above the key zone may attract buyers, which will trigger growth towards resistance.
Best regards, R. Linda!
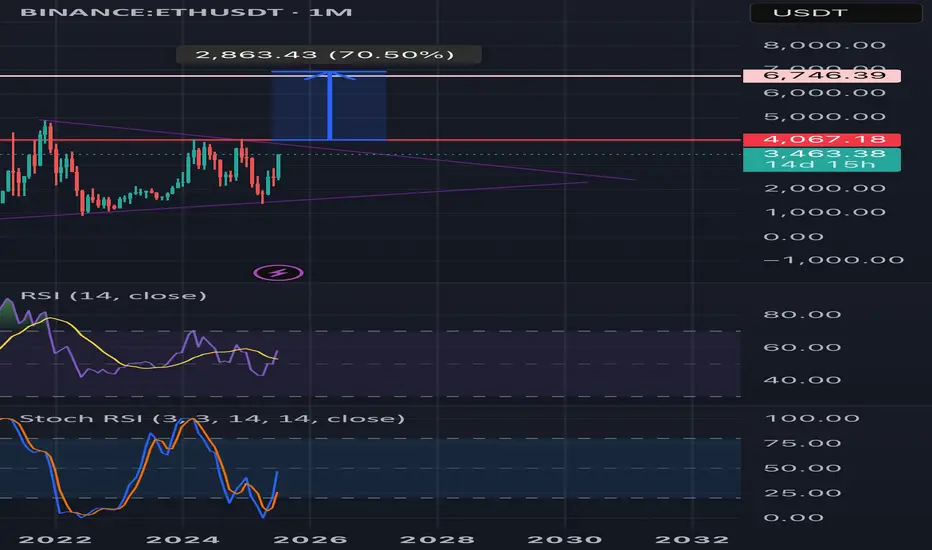
Upward breakout for ETH monthly?🟣 Ethereum Monthly Timeframe Analysis – Large Symmetrical Triangle
📌 Current Situation:
• On the monthly chart (1M), Ethereum (ETH) has formed a large symmetrical triangle pattern.
• This pattern typically signals a major price consolidation before a significant move.
• The descending resistance line connects the 2021 all-time high to recent lower highs.
• The ascending support line is drawn from the 2018 low through the 2022 bottom.
• Price is nearing the apex of the triangle, indicating a breakout is likely soon.
⸻
🔼 Bullish Scenario (Breakout to the Upside):
If ETH breaks above the triangle resistance and confirms the move:
✅ Signs of a Bullish Continuation:
• Strong breakout above the $4,000–$4,500 zone
• Increased volume confirming breakout
• Price holds above resistance-turned-support
🎯 Potential Price Targets by 2027 (based on triangle height & Fibonacci projections):
1. Target 1: $6,800 – $7,500
2. Target 2: $9,000 – $10,000
3. Long-term Target: $12,000 – $15,000 (if macro bull market continues)
⸻
🔽 Bearish Scenario (Fakeout or Breakdown):
If the breakout fails or price breaks down:
• ETH could revisit lower supports around $2,000 or even $1,400
• Bullish momentum delayed until another strong base forms
⸻
🔍 Conclusion:
• This triangle could mark the beginning of a major rally into 2027, especially if supported by fundamentals (e.g., ETF approval, DeFi growth).
• Wait for a confirmed breakout with volume and retest before entering a long-term position.
XAUUSD , Bullish Setup , R:R 17Hello friends
I am back after a long time and I want to share the results of my efforts of several years with you.
Gold is starting a 5th wave of bullishness and yesterday it gave us the necessary confirmations by rejecting the previous ceiling. I have identified the best buying position for you now. With a reward to risk 17
Take advantage of this opportunity.
If you are interested in Elliott waves or work in this field at a professional level, contact me and share your analysis with me.
I hope we will all be profitable together.

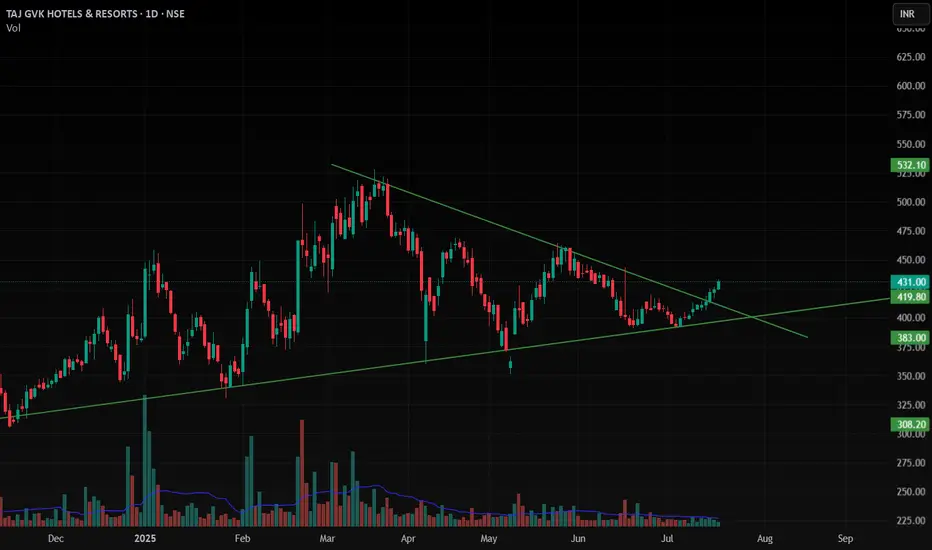
TAJGVK , 1D , Bullish as this stock given breakout from the Triangle Pattern with Good Volume , this stock is ready to Enter .
put SL below its swing low
follow more swing ideas like this .
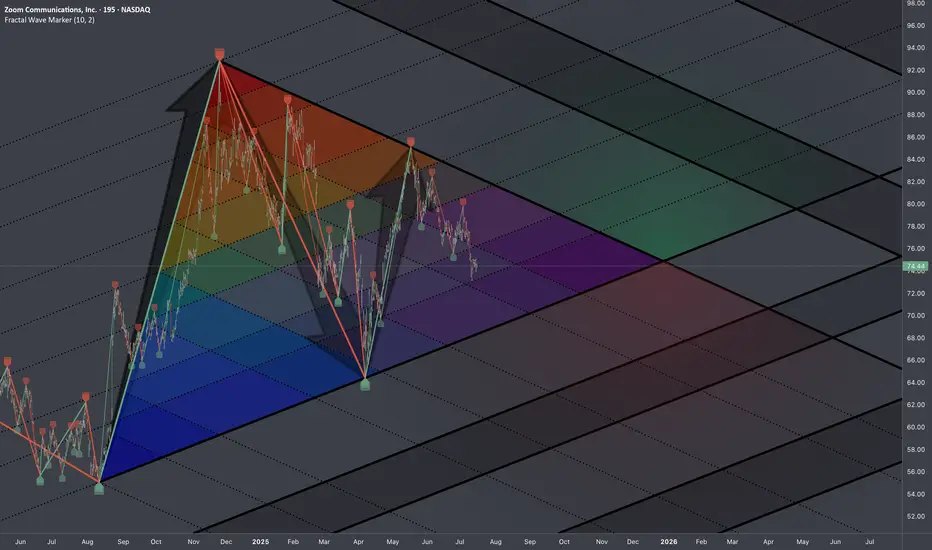
$ZM: Fib TriangleChose TF 195m (3h15m) so that each candle is half of trading session.
Research Notes
Documenting identified compression of cycles and their phases on multiple scales:
Fib Interconnections of critical points:
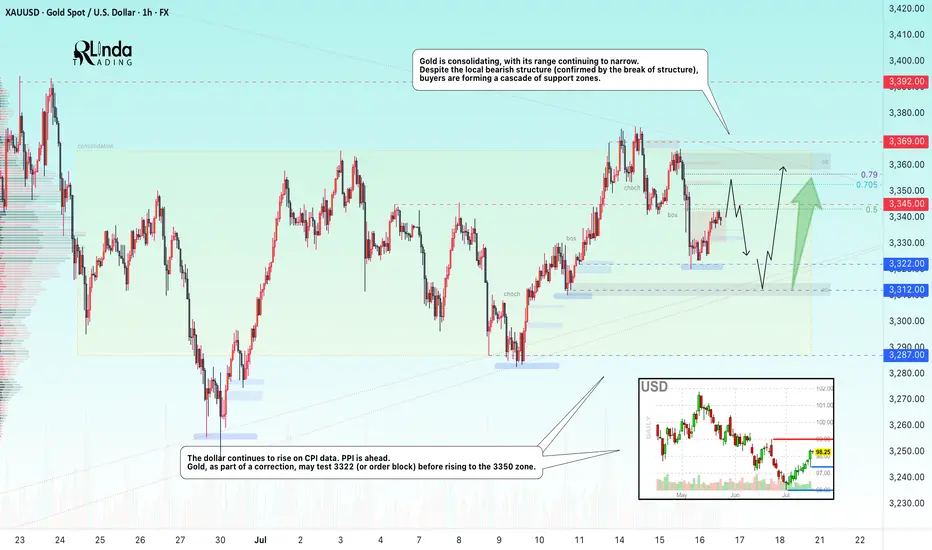
GOLD → Borders are shrinking. Consolidation continues...FX:XAUUSD is adjusting amid controversial CPI data and confirming the local bearish market structure. The PPI is ahead, and gold is consolidating, with its boundaries continuing to narrow...
Gold is recovering slightly but remains under pressure amid rising bond yields and a stronger US dollar. Higher inflation in the US reduces the chances of a quick Fed rate cut. Traders are cautious ahead of the PPI data release. If producer inflation exceeds forecasts, the dollar may rise again, putting further pressure on gold
Technically, we see consolidation in a symmetrical triangle pattern. Trading within the consolidation has a negative side - low volatility and unpredictable movements. The purpose of such movements is accumulation. However, decisions can be made based on relatively strong levels. In the current situation, we are seeing a rebound from 0.5 Fibonacci (I do not rule out a retest of the 0.7 zone before correction). The price may head towards the liquidity zone of 3322 before rising to the upper boundary of the consolidation and the zone of interest of 3350-3360.
Resistance levels: 3345, 3353, 3369
Support levels: 3322, 3312, 3287
The problem is that the price is in a consolidation phase. That is, technically, it is standing still and moving between local levels. You can trade relative to the indicated levels. Focus on PPI data. At the moment, gold is in the middle of a triangle and is likely to continue trading within the boundaries of a narrowing channel due to uncertainty...
Best regards, R. Linda!
Solana breakout setup: why I am watching this level closelySolana is forming a clear ascending triangle. We already saw one breakout earlier, followed by a few hard retests. Now price has stalled. This might frustrate some, but I see opportunity. A clean break could deliver 14% upside. I also discuss Bitcoin, false moves, and why time stops matter in this environment. Watch closely.

XRP/USD (RIPPLE) BUYtitle: XRP/USD (RIPPLE) BUY
Asset: Crypto
Symbol: XRP/USD
Market Entry Price 1: $2.9450
Limit Entry Price 2: $2.7450
Stop Loss: $2.6450
Take Profit 1: $3.145 (close 10%)
Take Profit 2: $3.345 (close 25%)
Take Profit 3: $3.645(close 50%)
Take profit 4: $3.845 (close 75%)
Let any remaining Xrp run risk free

NZDCHF → Pre-breakdown consolidation on a downtrendFX:NZDCHF is forming a pre-breakout consolidation amid a downtrend. Focus on support at 0.4759. Global and local trends are down...
On July 10-11, the currency pair attempted to break out of the trend. In the chart, it looks like a resistance breakout, but technically it was a short squeeze aimed at accumulating liquidity before the fall. We can see that the price quickly returned back and the market is testing the low from which the trap formation began. The risk zone for the market is 0.4759 - 0.475. In simple terms, this is a bull trap against the backdrop of a downtrend. The NZD has passed through the risk zone. At this time, the currency pair is forming a pre-breakout consolidation relative to the support level of 0.4759 with the aim of continuing its decline.
Support levels: 0.4759, 0.4753
Resistance levels: 0.477, 0.4782
A breakout of the 0.4759 level and consolidation in the sell zone could trigger a continuation of the decline within the main and local trends.
Best regards, R. Linda!

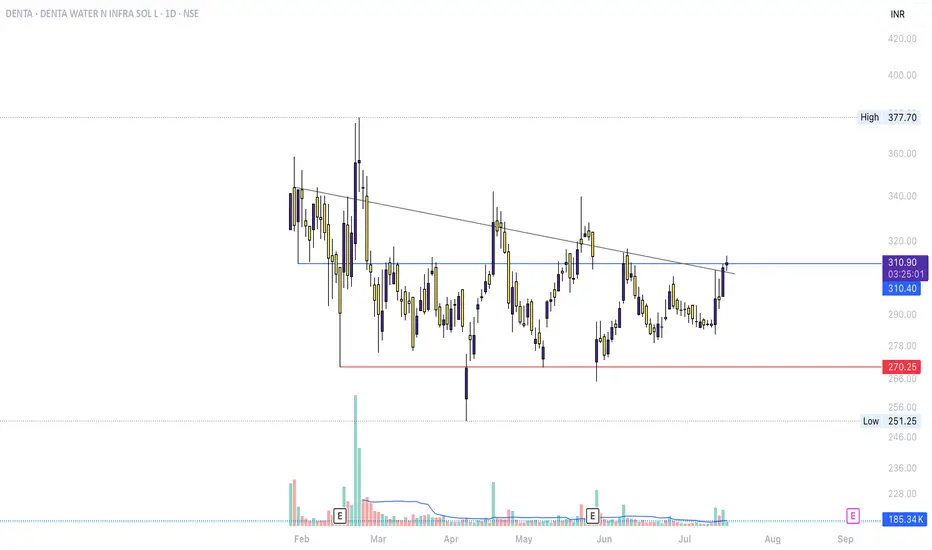
DENTA – SMC & Breakout Structure Analysis (Jul 2025)Accumulation/Distribution: Long consolidation near ₹270–₹311
Break of Structure (BOS): Trendline breakout + recent close above prior top
Neutral toward Bullish: Awaiting volume and price action confirmation to validate trend shift
1. Defined Range Structure
Support ~₹270 (red line) holding over 4+ months
Resistance ~₹311–₹315 (blue line) tested multiple times before today
2. Possible Breakout Attempt
Price has breached the descending trend line—an early mark of bullish structure shift
Close is marginally above resistance, but lacks volume confirmation for breakout validation
3. Volume & Confirmation
No substantial volume spike yet—breakouts typically require accompanying volume
Watch for multi-session closes above ₹315 with sustained volume to support continuation
4. Pullback as an Opportunity
Retracing into ₹305–₹310 could form a higher-low
Such a move would align with healthy trend behavior, offering clearer structure and stronger validation
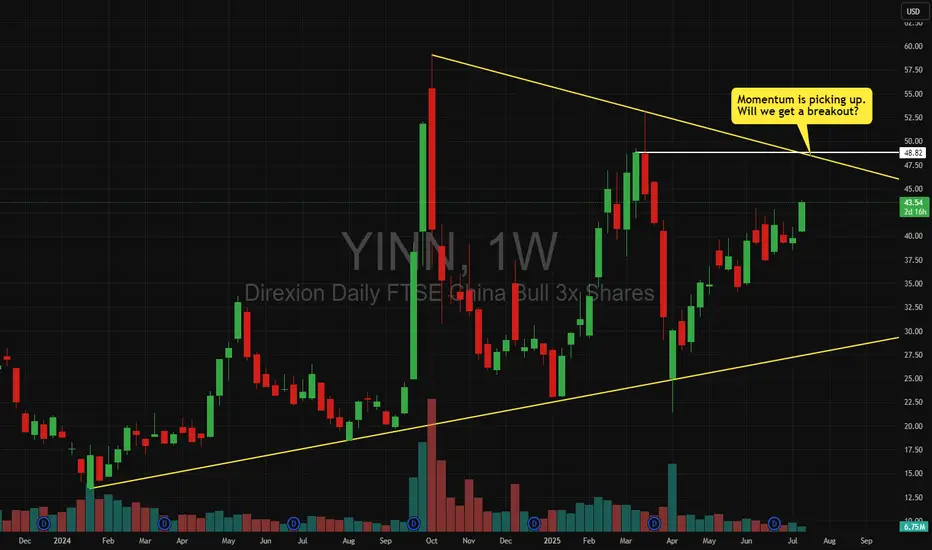
YINN - We could get a bullish breakout of the triangleMomentum seems to be picking up.
Will we a break out of the triangle?
Let's watch the $48 level.
FX: XAUUSD set for a bullish legIn XAUUSD, I’m seeing a promising bullish setup that could offer a strong opportunity for upside continuation. The chart shows a breakout from a descending triangle pattern, followed by a clean retest of the breakout zone. What really catches my attention is the confluence of support, where the price is currently reacting to both the former descending trendline and a longer-term ascending trendline. This area, around the 3,320–3,330 level, is now acting as a critical decision point.
I believe this retest could serve as a launchpad for a bullish continuation toward the next key resistance at 3,450. That level has acted as a strong ceiling in the past, and it’s a logical target if the market maintains upward momentum. The higher lows forming since May suggest growing buying pressure, reinforcing the bullish bias.
Of course, this setup isn’t without risk. If price breaks below this confluence zone, we may see a return to the previous range or a deeper correction. But for now, I’m leaning bullish, especially if we get a strong bullish candle or increased volume confirming the bounce.
I’ll be watching closely and updating if conditions shift, but for now, XAUUSD looks poised for another leg up.

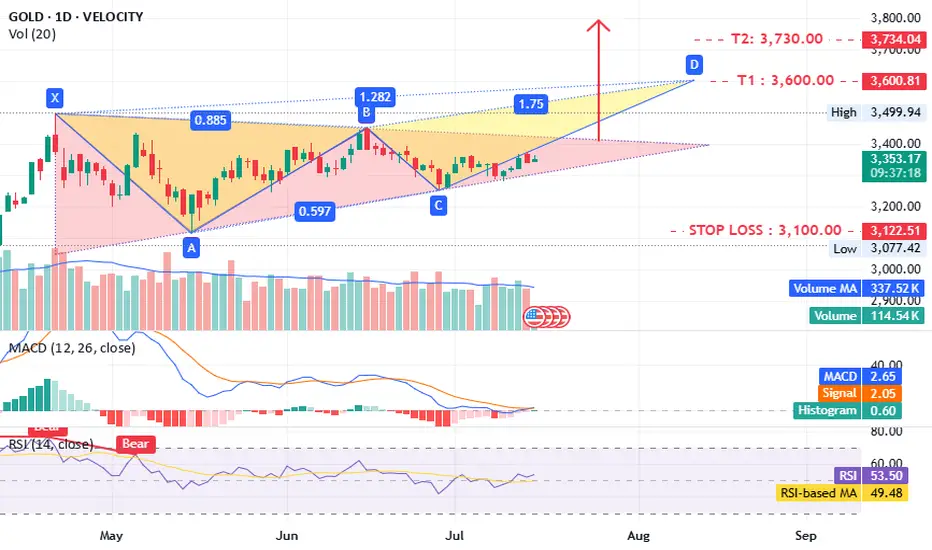
Gold what is next ?!!TVC:GOLD timeframe 1 day
is forming a potential triangle pattern, which could lead to a bearish setup.
The MACD and RSI indicators are positive, supporting this outlook. A close above 3400 would further confirm the idea.
Targets:
- T1: 3600
- T2: 3730–3800
Stop loss: 3100
Support: 3300–3260
Consider opening a long position now, with confirmation above 3400.
Disclaimer: This is not investment advice, only an analysis based on chart data. Consult your account manager before making any decisions. Good luck.
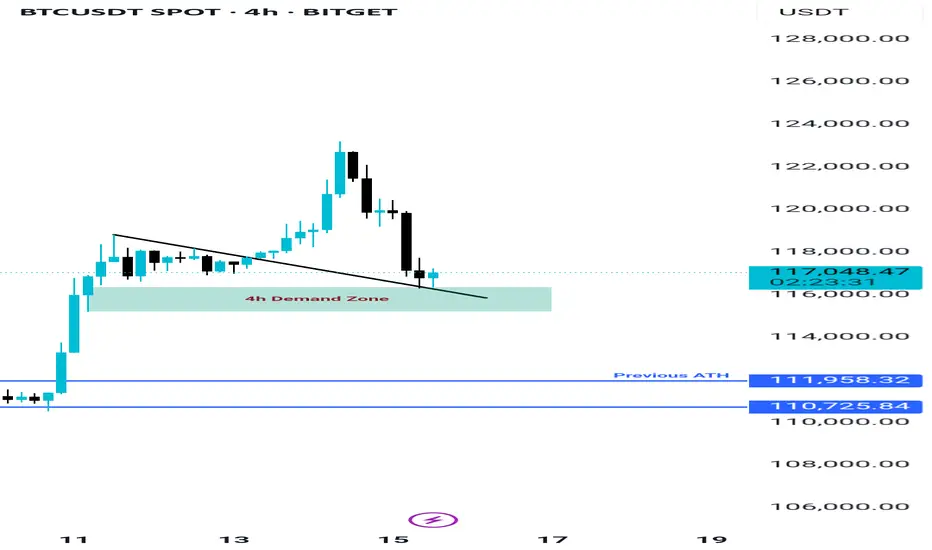
BTC still Holding the Demand Zone, Bitcoin is currently holding the demand zone between $116K and $117K, which also aligns with the retest area of a previously broken trendline—making this zone quite strong. If BTC manages to close above $117.8K on lower timeframes, we could see the beginning of a new uptrend targeting around $130K. However, if this zone fails due to any unexpected news or events, the next key support lies between $111K and $113K.
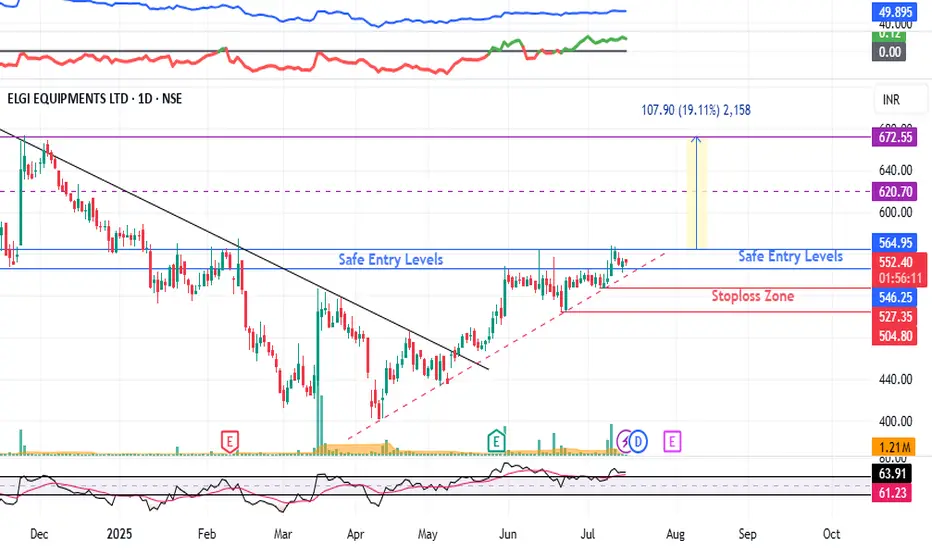
ELGIEQUIP : Breakout Soon#ELGIEQUIP #breakoutstock #swingtrade #trendingstock
ELGIEQUIP : Swing Trade
>> Breakout candidate
>> Trending changing happening
>> Good strength & Volume
>> Risk Reward Favorable
Swing Traders can lock profit at 10% and keep trailing
Pls Boost, Comment & Follow for more analysis
Disc : Charts shared are for Learning purpose not a Trade Recommendation, Take postions only after consulting your Financial Advisor or a SEBI Registered Advisor.
Gold bugs stay ready, breakout aheadGold bugs, don’t lose hope. After weeks of sideways action, gold is showing signs of a strong breakout. We look at charts, key levels, and what could trigger the next big move.
