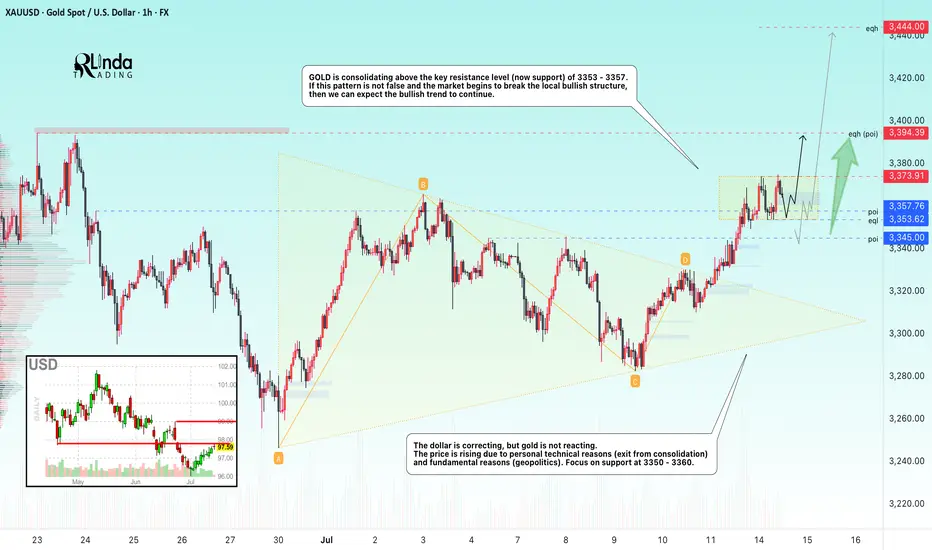
GOLD → Consolidation. Long squeeze before growth to 3400FX:XAUUSD has broken through resistance at 3353-3357 since the session opened, and bulls are currently trying to keep the market in the buying zone. Should we expect a long squeeze before growth?
Gold is in local consolidation after breaking through a key level. The price is still in the consolidation phase formed during a week-and-a-half correction. The price reached a three-week high of $3,374 on Monday but fell after the EU's conciliatory statements. Investors are awaiting US inflation data and Chinese GDP figures as they assess the prospects for a Fed rate cut. Heightened geopolitical and trade tensions are keeping demand for safe-haven assets high.
Technically, gold has entered a local buying zone, but there is a fairly complex resistance zone above it, and consolidation is needed to break through it. Such patterns could include a retest of support and a liquidity grab before growth.
Resistance levels: 3373, 3394
Support levels: 3357, 3353, 3345
There is a possibility of a retest of eql 3353 in a long squeeze format and a return to resistance at 3373 for a breakout. I also do not rule out a retest of the key level of 3345. The global trend is bullish, with the price locally in a fairly wide range, with an emphasis on the support zone of 3345-3355. If the bulls can hold this zone overall, the market will have a good chance of rising to 3400-3450
Best regards, R. Linda!
Triangle
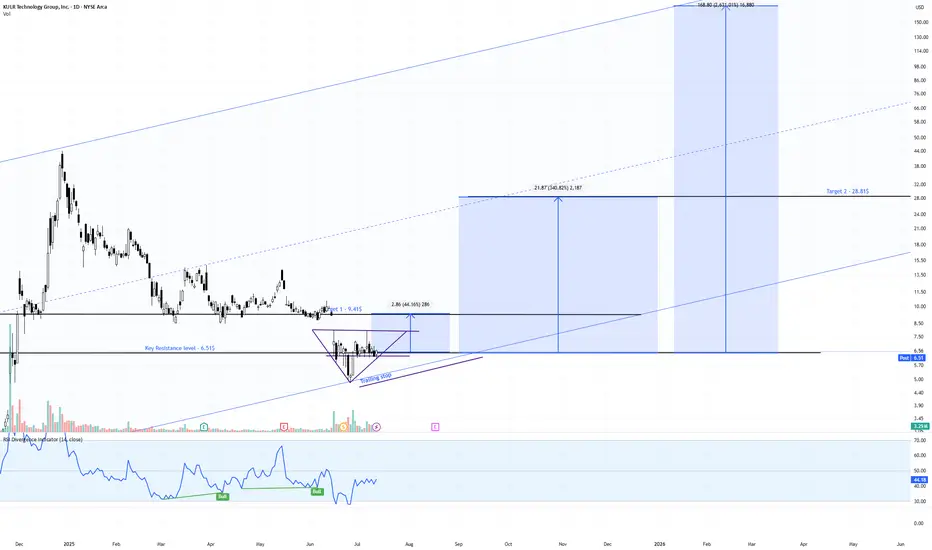
KULR Daily Watch – Triangle Squeeze Loading📍 Price Action:
Sitting tight at $6.50, coiling inside a clean symmetrical triangle. Last fake-out under support didn’t confirm → bulls still holding the line.
📊 Pattern Probabilities (Bulkowski):
Symmetrical triangles break ~54–60% in trend direction. Post-breakout moves hit ~60–75% of measured height → decent odds for upside here.
✅ Volume contracting = typical pre-breakout behavior
✅ RSI divergence still bullish
✅ Channel since 2023 intact, macro structure supports trend-following
🎯 Targets & RR Setup:
Trigger zone: $7.20–$7.50
Target 1: $9.45 (+31% | RR ~2.5:1)
Target 2: $28.81 (+298% | RR ~12:1)
Target 3 (channel top): $168.12 (+2,368% | moonshot 🌙)
⏳ Next Step:
Break over $7.50 = green light for Target 1. We’re trailing stops below the rising trendline to lock in gains without killing the move early.
#KULR #TrianglePattern #BreakoutWatch #TargetTraders #StockMarket
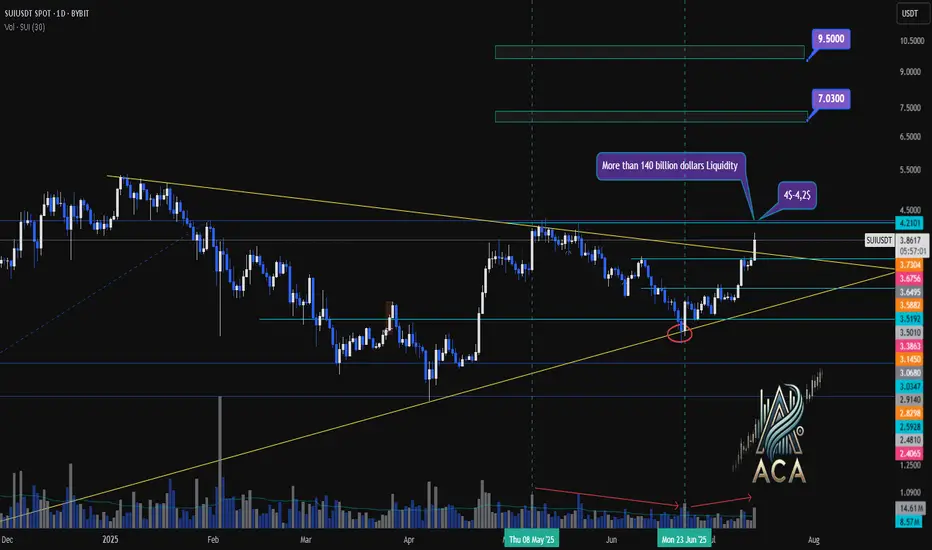
SUIUSDT Weekly Chart Analysis | Breakout Confirmed!SUIUSDT Weekly Chart Analysis | Breakout Confirmed, Massive Liquidity at $4–$4.20
🔍 Let’s dive into the SUI/USDT weekly chart after a decisive breakout from the symmetrical triangle, highlighting the critical liquidity zone and what it means for price action.
⏳ Weekly Overview
SUI has broken out of its multi-month triangle pattern following a textbook fakeout, with volume dynamics confirming renewed bullish momentum. The breakout is now awaiting daily candle confirmation for full validation.
🔺 Bullish Breakout & Key Liquidity Zone
A major liquidity cluster sits between $4.00 and $4.20, with more than $140 billion in liquidity concentrated in this range. This zone is crucial for several reasons:
- It represents a significant area where large buy and sell orders are stacked, likely leading to heightened volatility as price approaches or breaks through.
- Clearing this liquidity could unlock rapid moves toward the next upside targets at $7.03 and $9.50, as shown on the chart.
📊 Key Highlights
- Symmetrical triangle resolved with a bullish breakout, confirmed by increasing volume.
- The $4.00–$4.20 range holds over $140B in liquidity, making it a pivotal battleground for bulls and bears.
- Daily candle confirmation remains essential for trend validation.
- SUI ecosystem has reached a new all-time high in DeFi TVL, adding fundamental strength to the bullish case.
🚨 Conclusion
The breakout above the triangle, combined with surging volume and a record DeFi TVL, sets the stage for a potential rally. Watch the $4.00–$4.20 liquidity zone closely—how price interacts with this level could determine the speed and magnitude of the next move. Stay alert for daily confirmation and be prepared for volatility as SUI tests this high-stakes region.
#SUI #CryptoAnalysis #TradingView #Altcoins #ACA
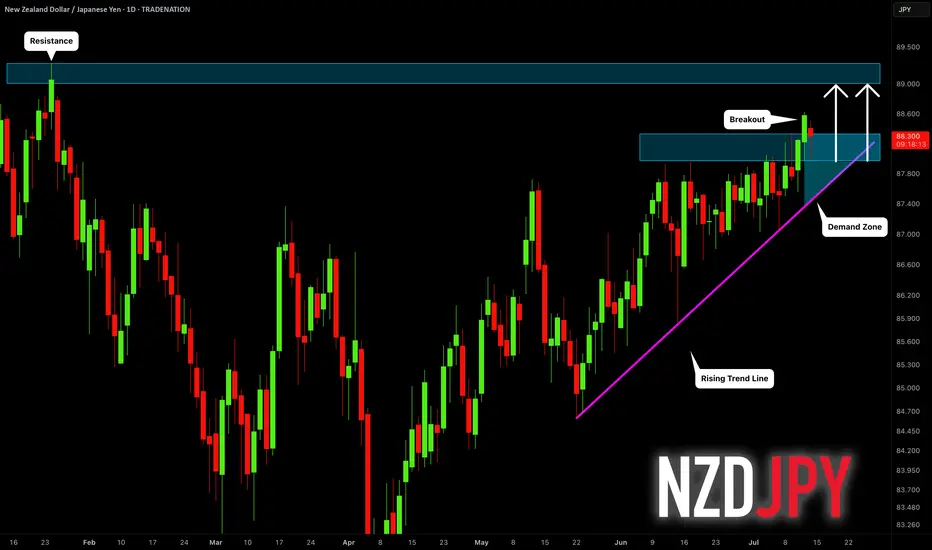
NZDJPY: Another Bullish Wave Ahead?! 🇳🇿🇯🇵
NZDJPY violated a significant daily resistance cluster last week.
The broken structure and a rising trend line compose a
contracting demand zone now.
That will be the area from where I will anticipate a bullish movement.
Next resistance - 89.0
❤️Please, support my work with like, thank you!❤️
I am part of Trade Nation's Influencer program and receive a monthly fee for using their TradingView charts in my analysis.
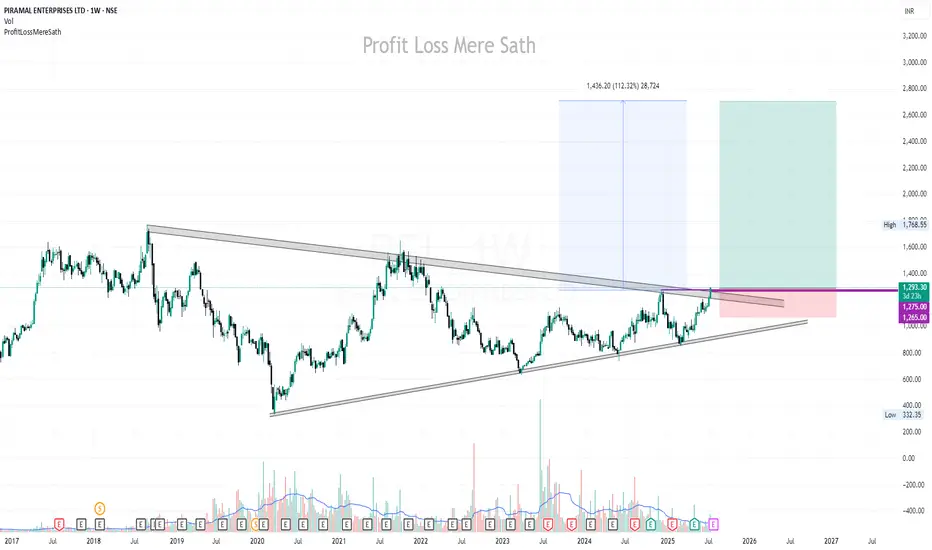
PEL | Buy @LTP | SL below 1070 | Targets 1560, 1765, 2700Disclaimer:
This is not financial advice. Please do your own research or consult with a financial advisor before making any investment decisions. Investments in stocks can be risky and may result in loss of capital.
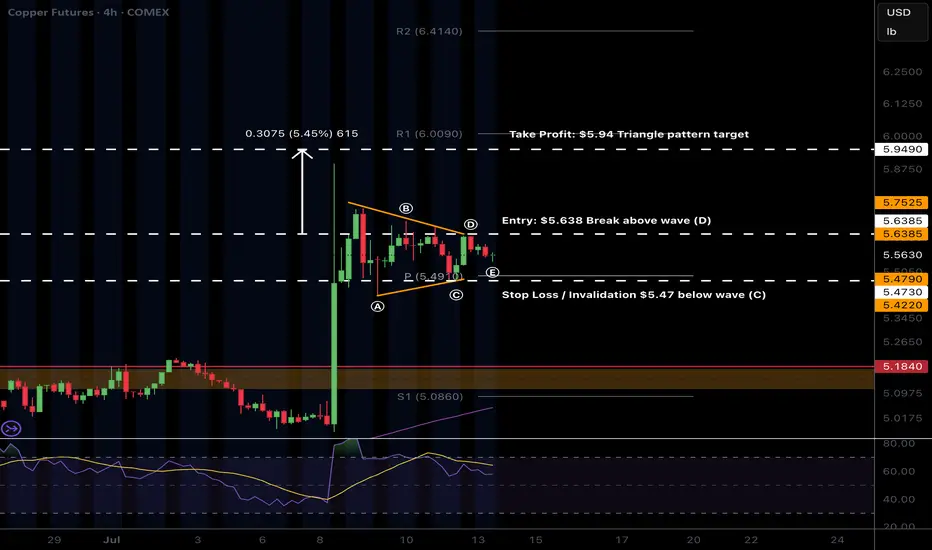
$COPPER triangle trade?CAPITALCOM:COPPER triangle has potentially printed and a triangle is an Elliot wave pattern that results in a terminal thrust up to complete a motif wave.
That would trap bulls as price terminates with a poke above the all time high keeping them believing they can capture the same gains already gone.
After the termination wave 2 often finds support at the triangle base.
Safe trading
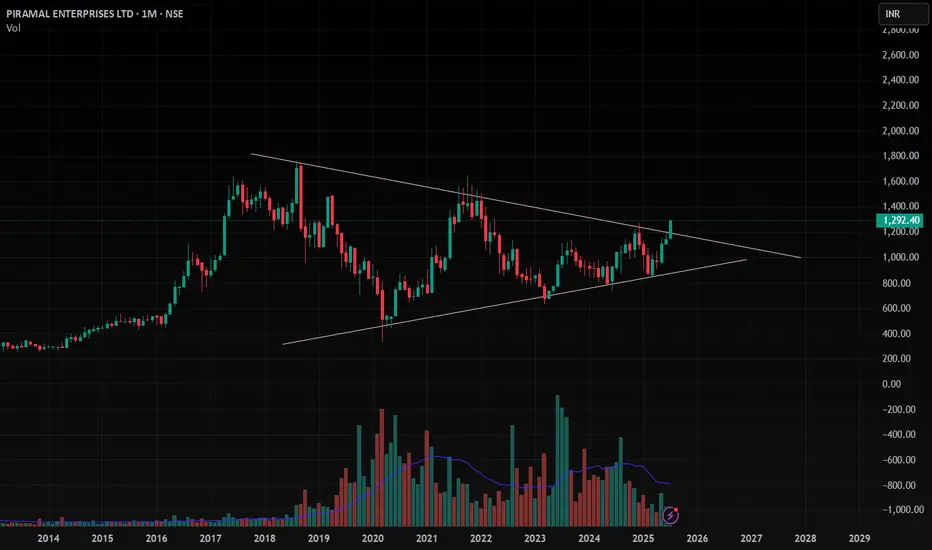
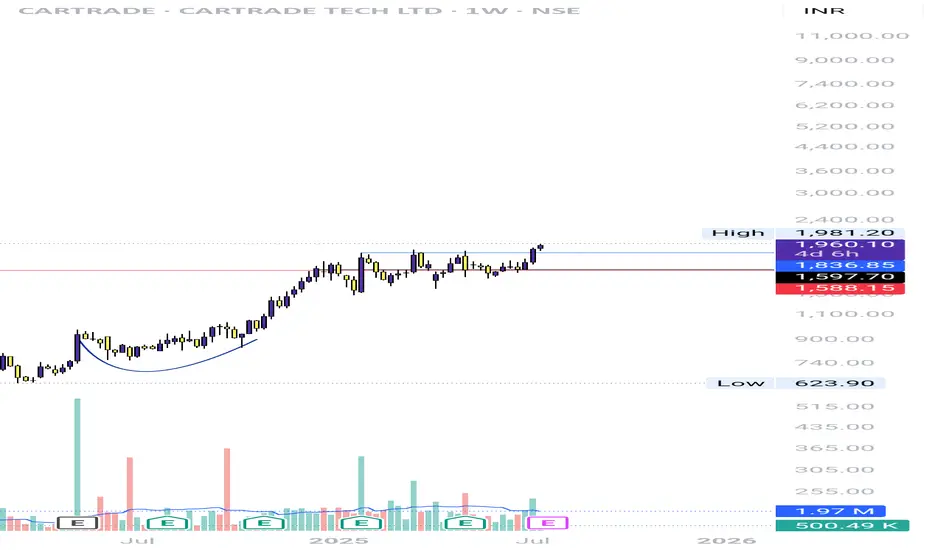
PEL , 1M , BullishThe Triangle Pattern is Breaking Out in Monthly Time Wait for Strong and Perfect close in Weekly Time and Enter after Confirmation .
Take Risk According to your capital
Follow for more ideas like this
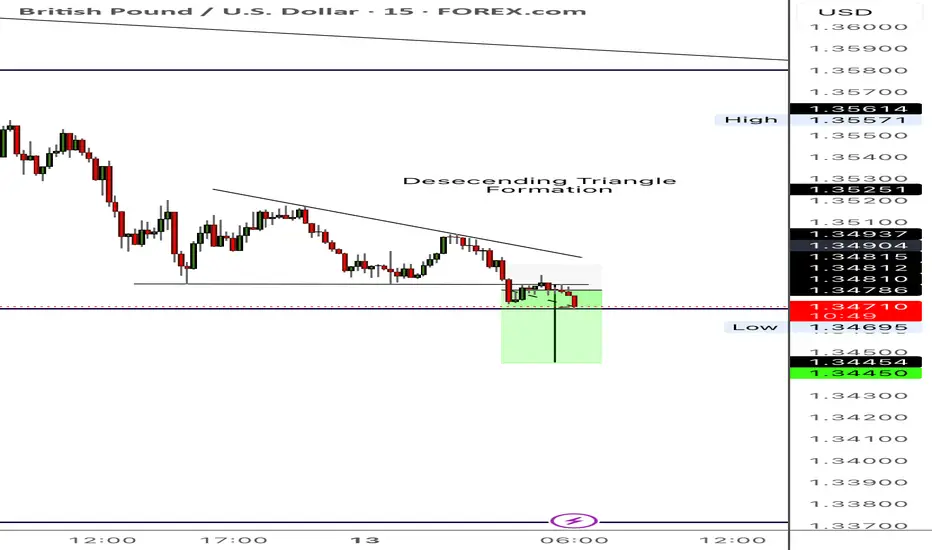
Descending Triangle Formation (GBPUSD)Here I can see a Descending Triangle Formation. I can see all the relevant characteristics such as the 4 touches, breakout and retest. Now it’s just a waiting game to see if it plays out.
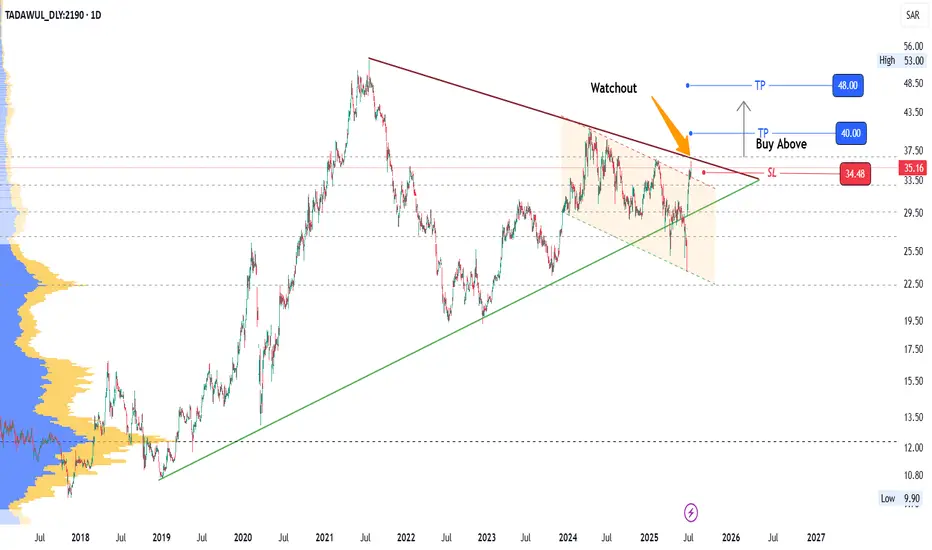
2190: Watch for Breakout2190 has reached Triangle Top (Trendline resistance) breaching a descending parallel channel resistance recently.
Watchout for the breakout of resistance.
Levels are marked.
Manage your risk with proper SL.
Enjoy the ride!
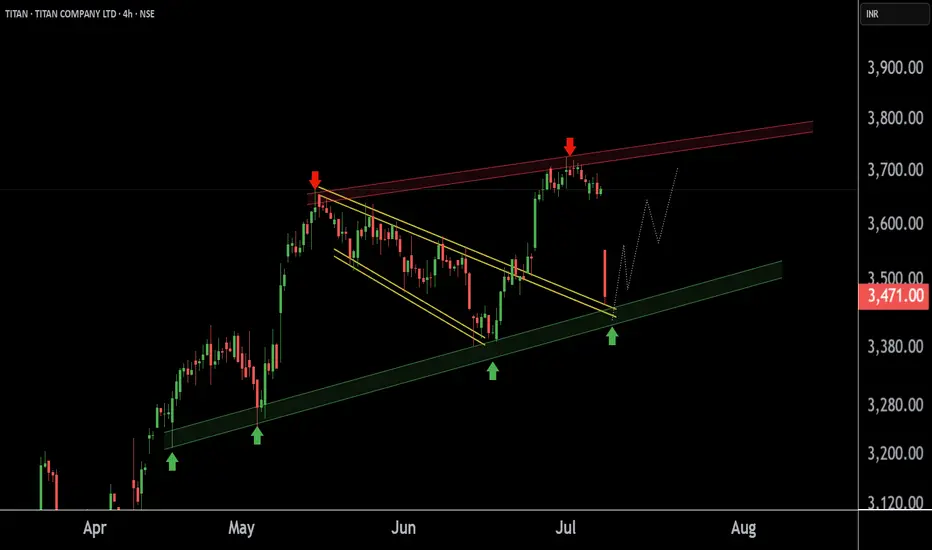
Titan at Best Support Zone !! This is the 4 hour chart of Titan Company.
Titan having a good support zone near 3400-3460 level.
If this level is sustain , then we may see higher prices in Titan company.
Thank You !!
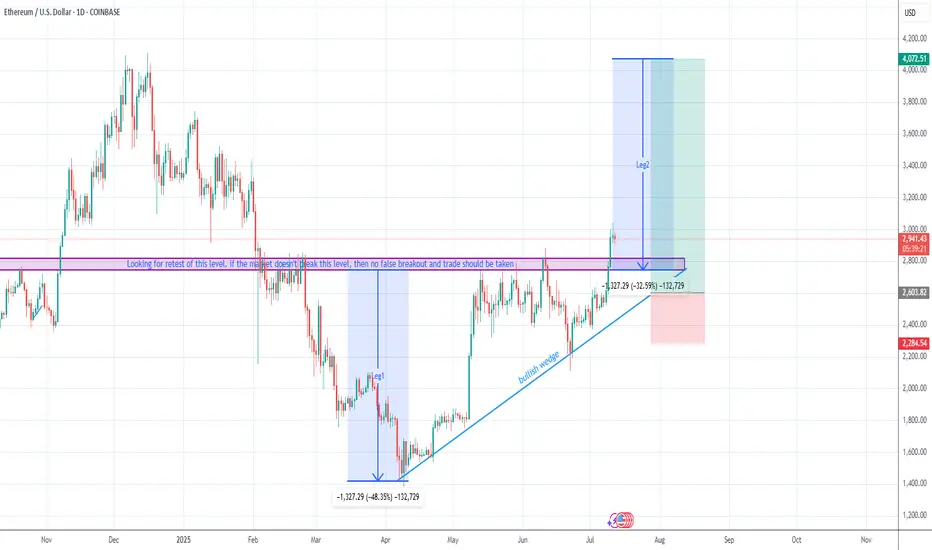
Wajani Investments: ETHUSD Analysis
ETHUSD has currently formed a triangle with a resistance broken to the upside. In most circumstances, I’ll like to wait for a retest of that resistance, i.e. resistance-becomes support to be sure that the breakout was not false. Once that level is tested and held, I’ll take a trade assuming Leg2 would have a similar move like Leg1. This is a very good trade with a 1:4 RR.
If you have any questions, feel free to ask. You can add or subtract from this idea.
Remember, trading always carries risks, and this is for EDUCATIONAL PURPOSES only.
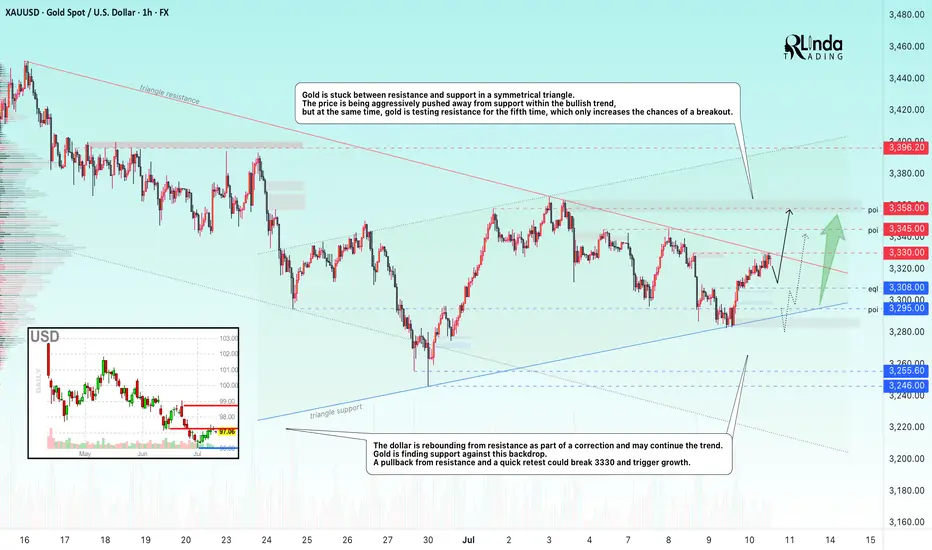
GOLD → Retest of consolidation resistance. Breakout?FX:XAUUSD is consolidating in a symmetrical triangle pattern. The price is stabilizing amid a falling dollar and uncertainty...
Gold is recovering after falling to $3,283 thanks to a weaker dollar and lower bond yields amid concerns over Trump's new tariff threats. The announced tariffs against seven countries, including Brazil and the Philippines, have heightened tensions, partially offsetting the Fed's hawkish signals. Markets are now awaiting new data from the US and speeches by Fed officials, which could influence the further dynamics of gold.
Technically, gold is squeezed between the resistance and support of a symmetrical triangle. The price is being aggressively pushed away from support within a bullish trend, but at the same time, gold is testing resistance for the fifth time, which only increases the chances of a breakout.
Resistance levels: 3330, 3345, 3358
Support levels: 3308, 3295
If gold continues to storm the local resistance at 3330 and the triangle resistance during consolidation, we will have a good chance of catching the breakout and growth. An additional scenario could be growth after a shake-up of the triangle support and the global trend.
Best regards, R. Linda!
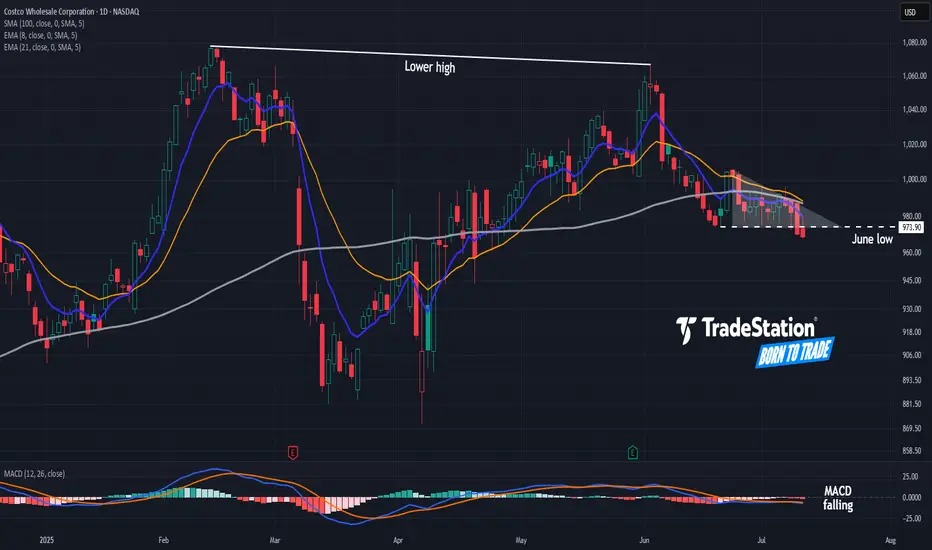
Potential Top in CostcoCostco Wholesale has been quietly limping, and some traders may see downside risk in the big-box retailer.
The first pattern on today’s chart is the June low of $973.90. COST made lower highs while trying to hold that level but is now sliding below it. That may be viewed as a potentially bearish triangle breakdown.
Second, the 8-day exponential moving average (EMA) is under the 21-day EMA. MACD is also falling. Both of those signals may be consistent with short-term downtrends.
Third, COST made a lower high in June compared with February. Compared with the broader market’s breakout, such price action may reflect a lack of buying interest.
Finally, the 100-day simple moving average has turned meaningfully lower for the first time in over two years. That may suggest a weakening longer-term trend.
TradeStation has, for decades, advanced the trading industry, providing access to stocks, options and futures. If you're born to trade, we could be for you. See our Overview for more.
Past performance, whether actual or indicated by historical tests of strategies, is no guarantee of future performance or success. There is a possibility that you may sustain a loss equal to or greater than your entire investment regardless of which asset class you trade (equities, options or futures); therefore, you should not invest or risk money that you cannot afford to lose. Online trading is not suitable for all investors. View the document titled Characteristics and Risks of Standardized Options at www.TradeStation.com . Before trading any asset class, customers must read the relevant risk disclosure statements on www.TradeStation.com . System access and trade placement and execution may be delayed or fail due to market volatility and volume, quote delays, system and software errors, Internet traffic, outages and other factors.
Securities and futures trading is offered to self-directed customers by TradeStation Securities, Inc., a broker-dealer registered with the Securities and Exchange Commission and a futures commission merchant licensed with the Commodity Futures Trading Commission). TradeStation Securities is a member of the Financial Industry Regulatory Authority, the National Futures Association, and a number of exchanges.
TradeStation Securities, Inc. and TradeStation Technologies, Inc. are each wholly owned subsidiaries of TradeStation Group, Inc., both operating, and providing products and services, under the TradeStation brand and trademark. When applying for, or purchasing, accounts, subscriptions, products and services, it is important that you know which company you will be dealing with. Visit www.TradeStation.com for further important information explaining what this means.
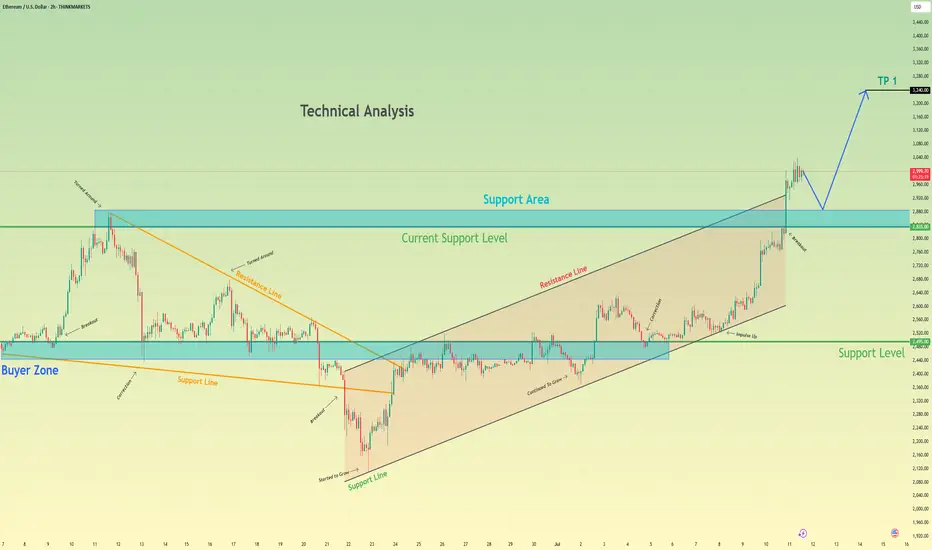
Ethereum can make a small correction before it continues to growHello traders, I want share with you my opinion about Ethereum. After a long period of consolidation within a descending triangle, Ethereum broke out and started forming a steady upward channel. The impulse move from the buyer zone gave the market fresh bullish energy. We saw the price pushing through key resistance levels, showing strong momentum and confidence from buyers. Eventually, ETH reached a local peak and is now hovering just above the current support level at 2835. This area is crucial - it previously acted as resistance and has now turned into a support area, giving bulls a chance to regroup. Based on the structure, I expect a short-term correction toward the support area, followed by a continuation to the upside. The trend remains strong, and the impulse is not yet exhausted. That’s why I set my TP at 3240 points, which aligns with the upper expansion target based on previous movement. Given the breakout, strong uptrend, and support zone now being retested, I remain bullish and anticipate further growth from the current levels. Please share this idea with your friends and click Boost 🚀
Disclaimer: As part of ThinkMarkets’ Influencer Program, I am sponsored to share and publish their charts in my analysis.
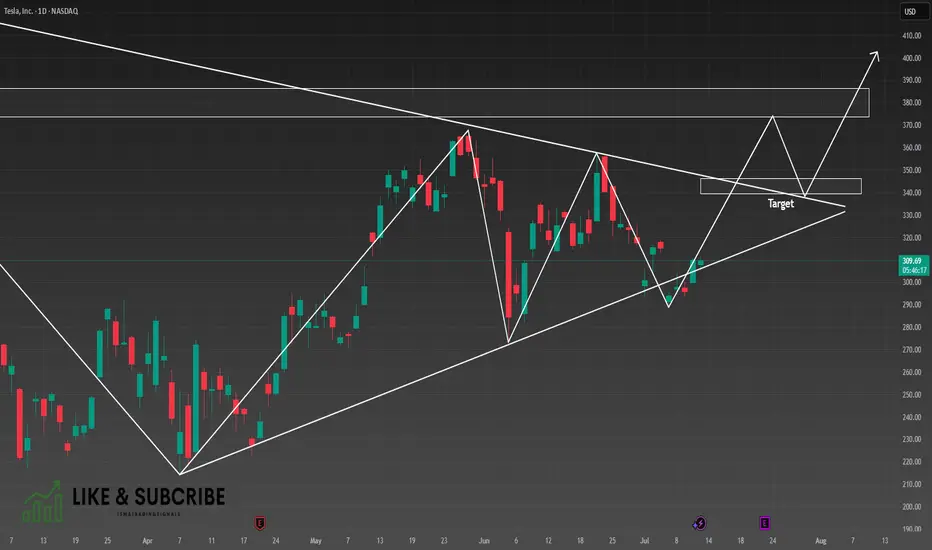
TSLA, Long, 1D✅ TSLA has just broken out of a clear symmetrical triangle pattern, signaling a potential bullish continuation.
Yesterday’s daily candle was a white Marubozu, indicating strong buying pressure and clear dominance by the bulls.
LONG 📈
✅ Like and subscribe to never miss a new technical analysis! ✅
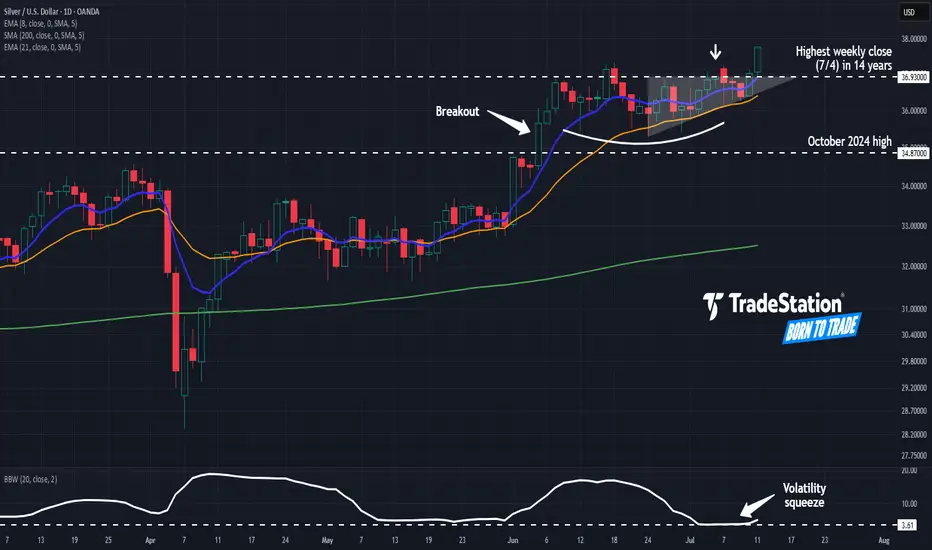
Silver Pushes HighsSilver broke out a month ago, and some traders may think the metal is ready to run.
The first pattern on today’s chart is last Friday’s last price of 36.93. It was the highest weekly close in 14 years, which may reflect buying pressure.
Second, XAGUSD has made higher lows while remaining trapped below resistance. That ascending triangle is a potentially bullish continuation pattern.
Third, the 8-day exponential moving average (EMA) has remained above the 21-day EMA. Such configurations can be consistent with positive short-term momentum.
Finally, Bollinger Band Width recently dropped to a four-year low. Will that tight price compression give way to expansion?
Check out TradingView's The Leap competition sponsored by TradeStation.
TradeStation has, for decades, advanced the trading industry, providing access to stocks, options and futures. If you're born to trade, we could be for you. See our Overview for more.
Past performance, whether actual or indicated by historical tests of strategies, is no guarantee of future performance or success. There is a possibility that you may sustain a loss equal to or greater than your entire investment regardless of which asset class you trade (equities, options or futures); therefore, you should not invest or risk money that you cannot afford to lose. Online trading is not suitable for all investors. View the document titled Characteristics and Risks of Standardized Options at www.TradeStation.com . Before trading any asset class, customers must read the relevant risk disclosure statements on www.TradeStation.com . System access and trade placement and execution may be delayed or fail due to market volatility and volume, quote delays, system and software errors, Internet traffic, outages and other factors.
Securities and futures trading is offered to self-directed customers by TradeStation Securities, Inc., a broker-dealer registered with the Securities and Exchange Commission and a futures commission merchant licensed with the Commodity Futures Trading Commission). TradeStation Securities is a member of the Financial Industry Regulatory Authority, the National Futures Association, and a number of exchanges.
TradeStation Securities, Inc. and TradeStation Technologies, Inc. are each wholly owned subsidiaries of TradeStation Group, Inc., both operating, and providing products and services, under the TradeStation brand and trademark. When applying for, or purchasing, accounts, subscriptions, products and services, it is important that you know which company you will be dealing with. Visit www.TradeStation.com for further important information explaining what this means.
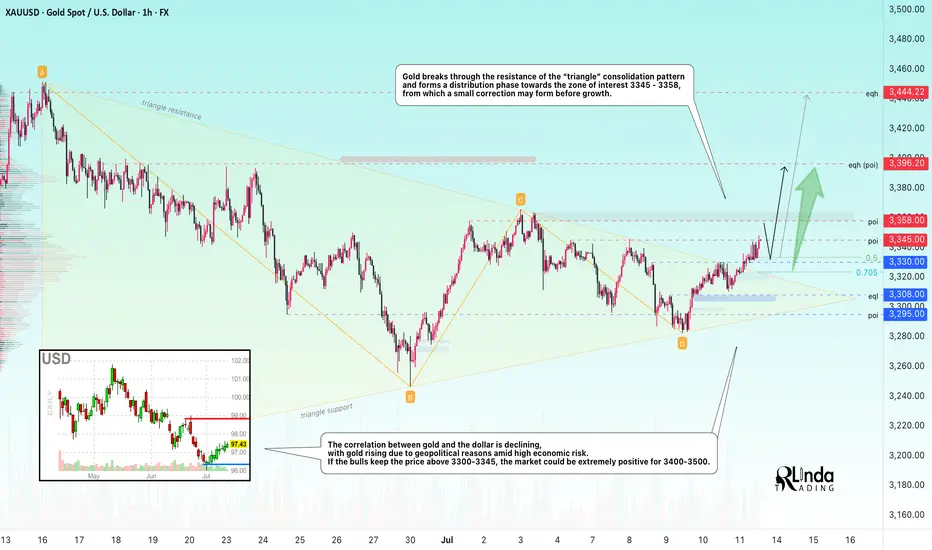
GOLD → Distribution. There is potential for growth to 3450–3500FX:XAUUSD breaks through consolidation resistance and forms a distribution pattern. A breakout of 3345-3358 could lead to another rally amid high economic risks...
Gold is rising for the third day in a row amid growing concerns about new tariffs announced by Trump. He threatened to impose tariffs on Canada and most of its trading partners, as well as the EU. Despite the strengthening of the dollar, demand for gold remains strong due to uncertainty and expectations for US inflation data next week. Investors are cautious ahead of CPI and the Fed's possible response
The correlation between gold and the dollar is declining, with gold rising due to geopolitical reasons amid high economic risks.
If the bulls keep the price above 3300-3345, the market could be extremely positive for 3400-3500.
Resistance levels: 3345, 3358
Support levels: 3330, 3308
Gold has broken through the resistance of the “triangle” consolidation pattern and is forming a distribution phase towards the zone of interest 3345 - 3358, from which a small correction may form before growth. Since 3345 is an intermediate level, the focus is on 3358. I do not rule out the possibility of a long squeeze of the support levels 3330, the triangle support, and 3310 before the growth continues.
Best regards, R. Linda!
DOGE/USDT – Is Dogecoin About to Ignite Altseason Again?Hey Traders!
If you’re finding value in this analysis, smash that 👍 and hit Follow for high-accuracy trade setups that actually deliver!
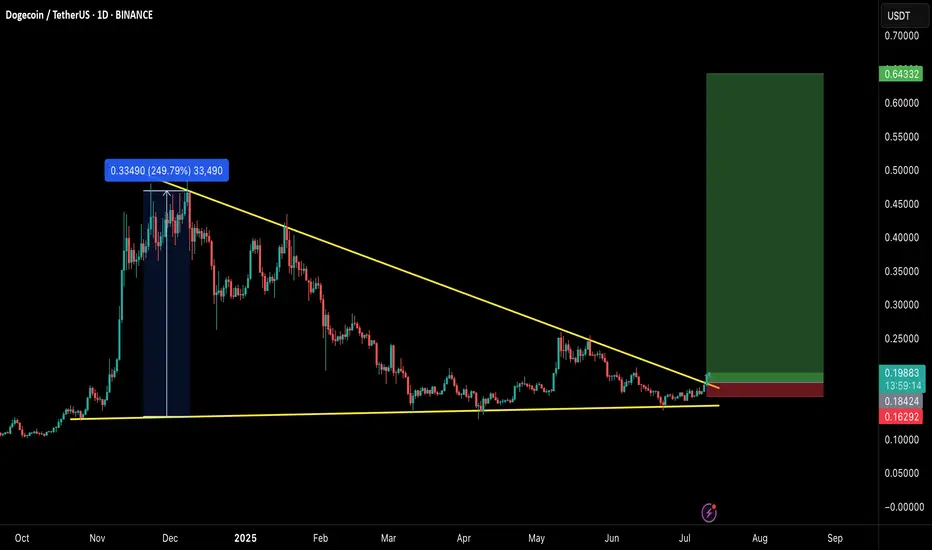
Dogecoin just broke out of a multi-month descending wedge — and history tells us to pay close attention when this meme king wakes up. Let’s dive into why this setup could be the start of something massive.
📈 Chart Pattern
DOGE has been consolidating for months inside a falling wedge — a classic bullish reversal structure. It’s now finally broken out with strong volume confirmation, holding above the 50 EMA and showing signs of momentum building up.
🔍 Historical Clue
Remember what happened in the previous bull markets?
✅ 2021: DOGE exploded 2000%+ and triggered the craziest altseason ever.
✅ 2017: DOGE moved first, followed by hundreds of altcoins rallying massively.
Now, in 2025 — it looks eerily similar. Every time DOGE wakes up, it signals that retail and meme sentiment is heating up, a classic altseason ignition.
🎯 Trade Setup
Entry: $0.198 (Already triggered)
Targets:
TP1: $0.28
TP2: $0.42
TP3: $0.64
Stoploss: $0.162
Risk-Reward: Massive upside potential, with clearly defined invalidation.
💡 Final Thoughts
Altcoins are starting to follow. ETH has broken out. XRP is running. BTC dominance has rejected trendline resistance. Everything is aligning. If history repeats, this breakout in DOGE could mark the official start of Altseason 2025.
👉 Don’t sleep on DOGE. This might just be the trigger we’ve been waiting for.
📌 Follow for more setups & insights. Stay tuned!
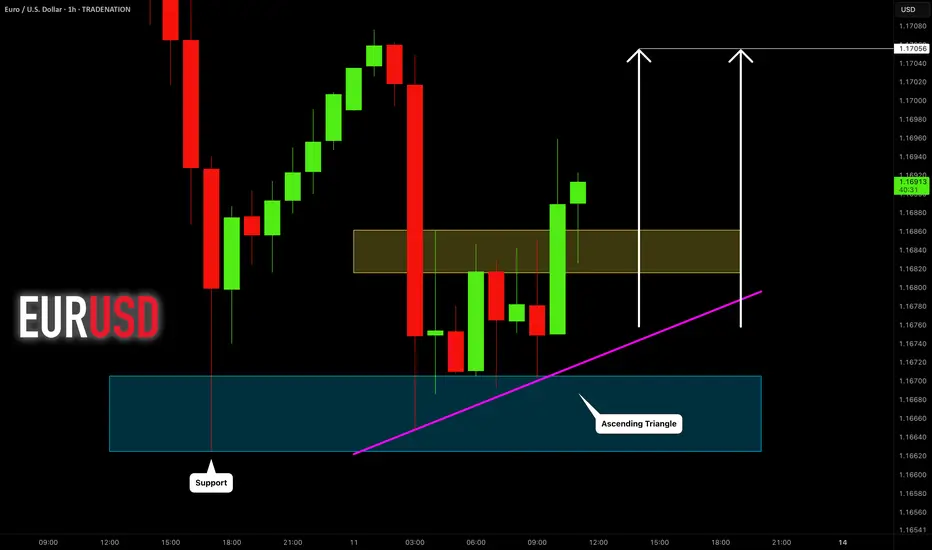
EURUSD: Strong Bullish Confirmation?! 🇪🇺🇺🇸
There is a high chance that EURUSD will move up from the
underlined intraday support.
An ascending triangle formation and a violation of its neckline
indicate a strength of the buyers.
Goal - 1.1705
❤️Please, support my work with like, thank you!❤️
I am part of Trade Nation's Influencer program and receive a monthly fee for using their TradingView charts in my analysis.
Gold. Swing trade setup 11/July/25XAUUSD. Based on latest 'speed' of chart "touching" those trendlines, gold probably having a triangle base now..before moving toward 3460 +/-...

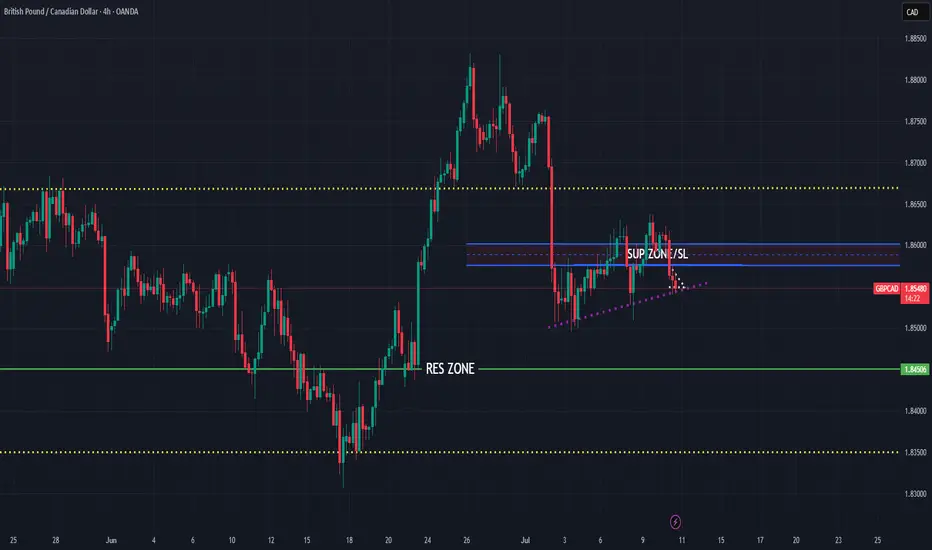
GBPCAD bearish for expect
OANDA:GBPCAD last 4 ideas on this pair attached, we are have one strong fall, price is make few pushes on sup zone (violet doted), which taking for legal zone, currently price in ASCENDING TRIANGL better visible on 15TF (will make in note), expecting break of same and higher bearish continuation.
SUP zone: 1.85750
RES zone: 1.84500
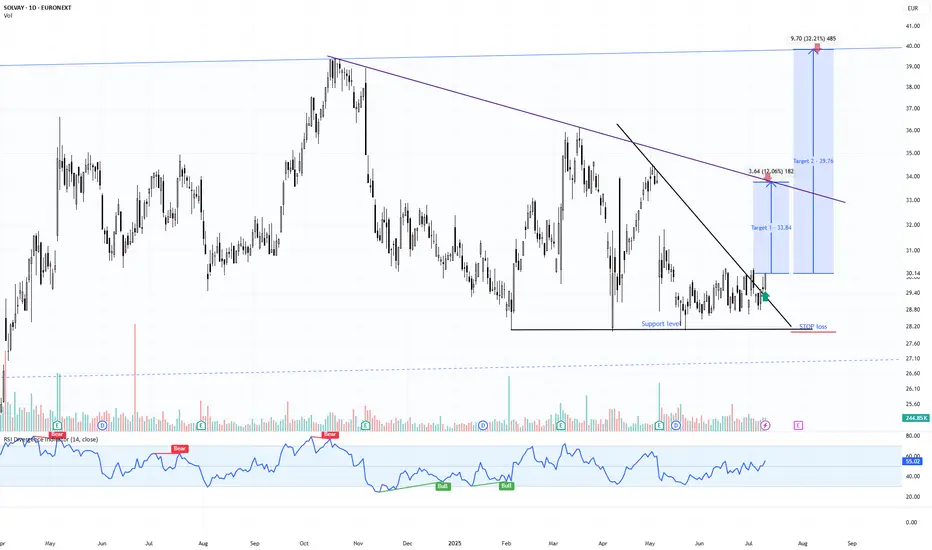
SOLB | Confirmed Descending Triangle Breakout – 32% Target📍 Ticker:
SOLB (Solvay SA – Euronext Brussels)
📆 Timeframe: 1D (Daily)
📉 Price: €30.14
📈 Pattern: Descending triangle breakout confirmed on daily close
📊 Breakout Probability estimation: ~73% (short-term triangle breakout upward)
🔍 Technical Setup (Updated on Daily Chart):
Solvay has now confirmed the breakout on the daily timeframe, closing above both the horizontal support and the descending trendline. This marks a multi-timeframe confluence breakout, increasing confidence in the projected move toward upper resistance levels.
✅ Daily candle close above descending resistance
✅ RSI breakout above 55, building momentum
📉 Stop clearly defined under €27.90 → optimal risk profile
📊 Volume expanding, validating move
🧠 Updated Trade Plan:
📥 Entry Zone: €29.90–€30.50 (daily confirmation)
⛔ Stop-Loss: Below €27.90
🔁 Hold while structure remains above descending trendline support
🎯 Upside Targets & Potential Return (from €30.14)
🎯 Target Price Return
Target 1 €33.84 +12.06%
Target 2 €39.76 +32.21%
📊 Pattern Probability – Daily Structure:
📐 Pattern: Descending Triangle Breakout
🔺 Upward breakout probability: ~73%
🎯 Full measured move supports Target 2 if buyers remain active
⚠️ Technical Signals to Watch:
🔎 Retest of descending line on lower volume = strong
✅ RSI > 55 with bullish structure
📈 Rising volume → growing institutional interest
📊 Price reclaiming structure from broader daily consolidation
💬 Solvay is transitioning from a textbook 4H breakout to a multi-day continuation setup. The alignment of pattern, structure, and momentum makes this one of the cleaner swing setups on the European market right now.
🔔 Follow @TargetTraders for high-probability technical trades.
#SOLB #BreakoutSetup #DescendingTriangle #TechnicalPattern #SwingTrade #Euronext #TargetTraders #VolumeBreakout #ChartAnalysis