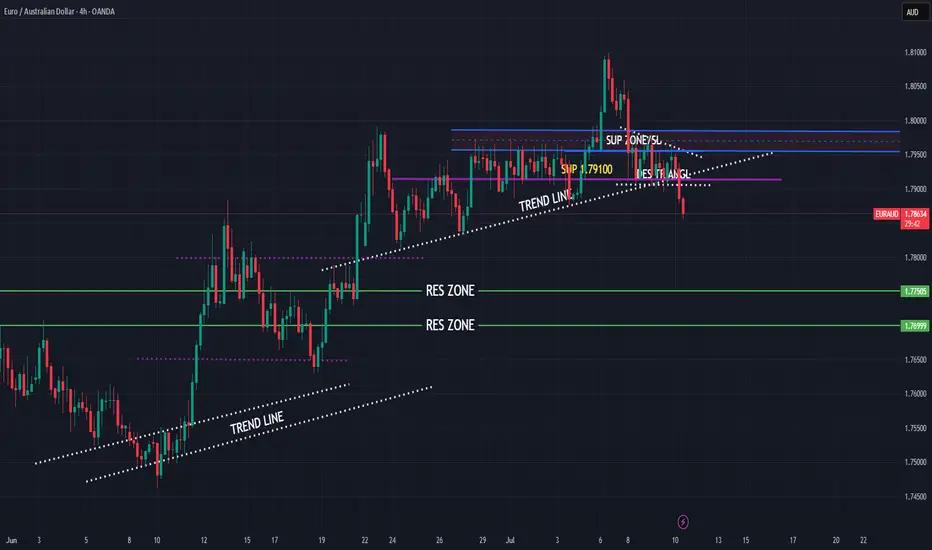
EURAUD higher bearish for expect
OANDA:EURAUD bullish trend nearly last two months.
Good structure visible, we have breaked trend line, sup zone (1.79100) breaked and DESCENDINGING TRIANGL is breaked, we are have and RBA and RBNZ in last days.
EUR looks like is start losing power and like cant more pushing, from here expectations are for more bearish.
SUP zone: 1.79500
RES zone: 177500, 177000
Triangle
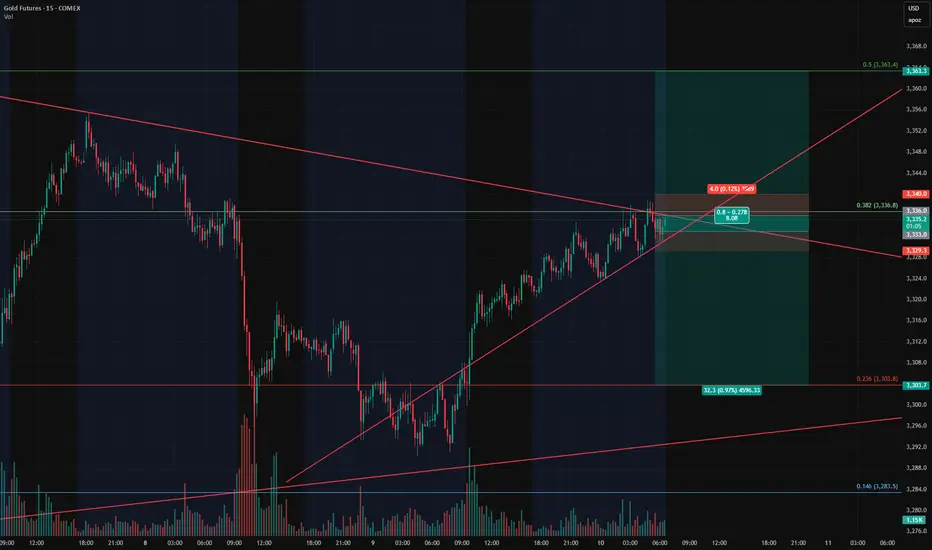
Gold Trade Setup – Watching the BreakoutGold Trade Setup – Watching the Breakout
Gold is currently consolidating between $3,200 and $3,500, with price action now pressing against a descending resistance line that has triggered multiple rejections in the past. We’re approaching a key decision point.
I'm favoring the upside in this setup — the momentum and structure suggest a potential breakout — but I fully recognize the downside potential and want to be prepared for both scenarios. Tight risk controls are key here.
Here’s how I’m positioned:
• Long Entry: Around $3,333
- Stop Loss: $3,330
- Target: $3,363 (looking for this level to be reached by end of day)
• Short Entry: Around $3,336
- Stop Loss: $3,340
- Take Profit: $3,303
The structure could resolve sharply in either direction, so I’m staying nimble and reactive.
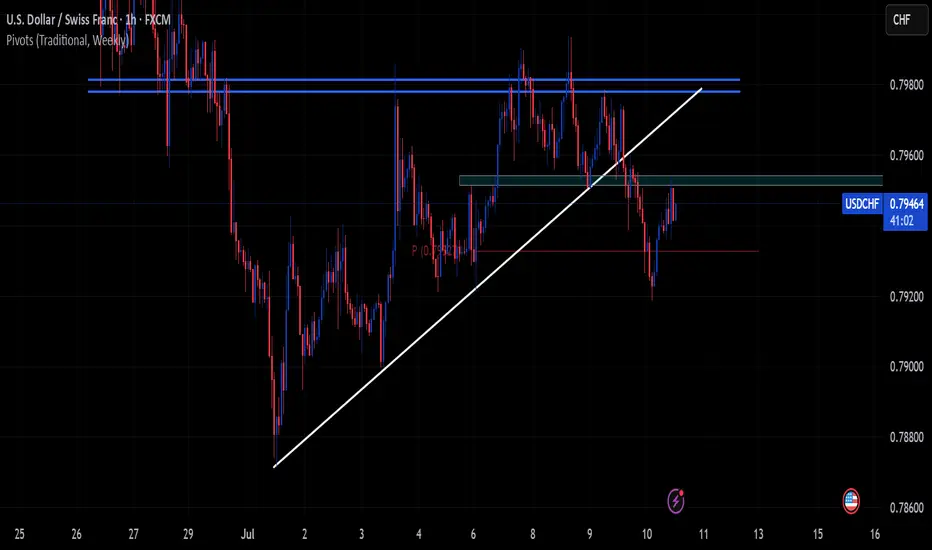
Will USDCHF go down?!!Hello traders, this is a trade that I have been scoping for a while but the week is about to close.
as you can see this is a clear downtrend.
You can clearly see a pullback in a form of a triangle.
A clear divergence.
You can either sell now or try to sell below the pivot point.
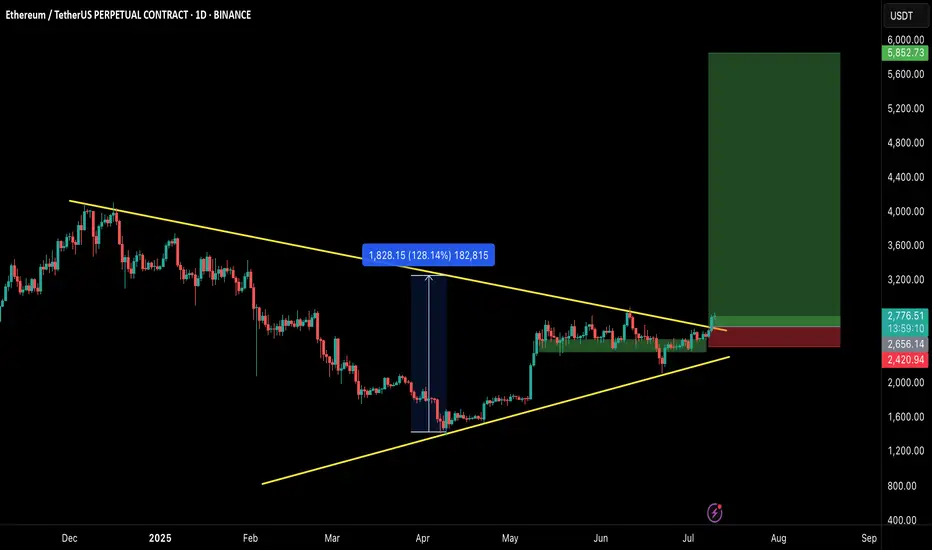
ETHEREUM BREAKOUT CONFIRMED!Hey Traders!
If you’re finding value in this analysis, smash that 👍 and hit Follow for high-accuracy trade setups that actually deliver!
After months of consolidation inside this massive symmetrical triangle, ETH finally breaks out on the daily chart—and this could be the spark for the next major rally! 🔥
📈 Structure: Symmetrical Triangle
✅ Breakout Confirmed
📍 CMP: ~$2,760
🎯 Next Major Target: $5,000+
This is the breakout bulls have been waiting for! If momentum sustains, ETH could enter price discovery territory soon. Buckle up—the real move might just be beginning. 🚀
Let’s see how far it runs from here!
Drop your targets in the comments 👇
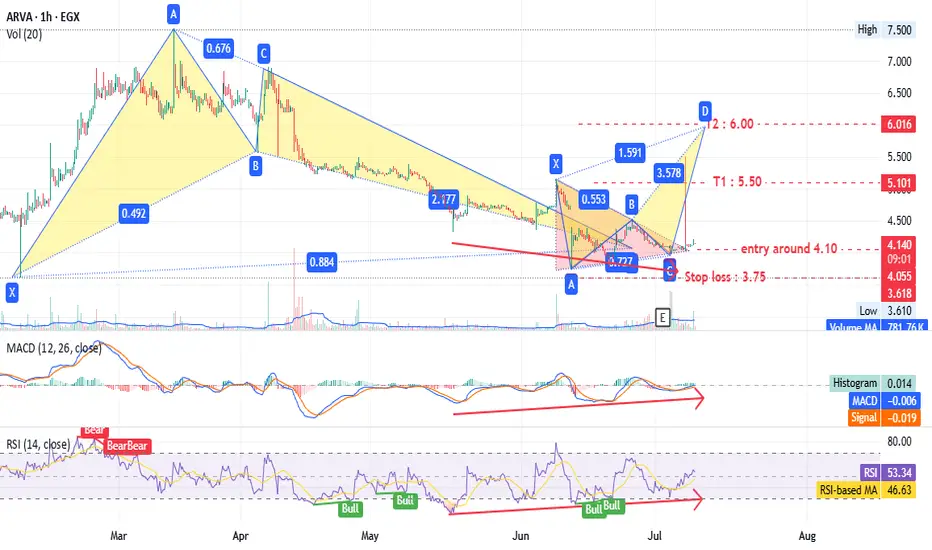
ARVA - many patterns give one target - Amazing EGX:ARVA timeframe 1 hour
Entry around 4.10
Stop loss at 3.75 (10% loss).
Targets at 5.50 and 6.00 (up to 44% profit).
Hourly chart shows a triangle pattern and bearish Gartley pattern.
Daily timeframe also indicates a bullish pattern with the same targets.
MACD and RSI support this analysis.
Note: This is not investment advice—only my analysis based on chart data. Consult your account manager before investing. Good luck!
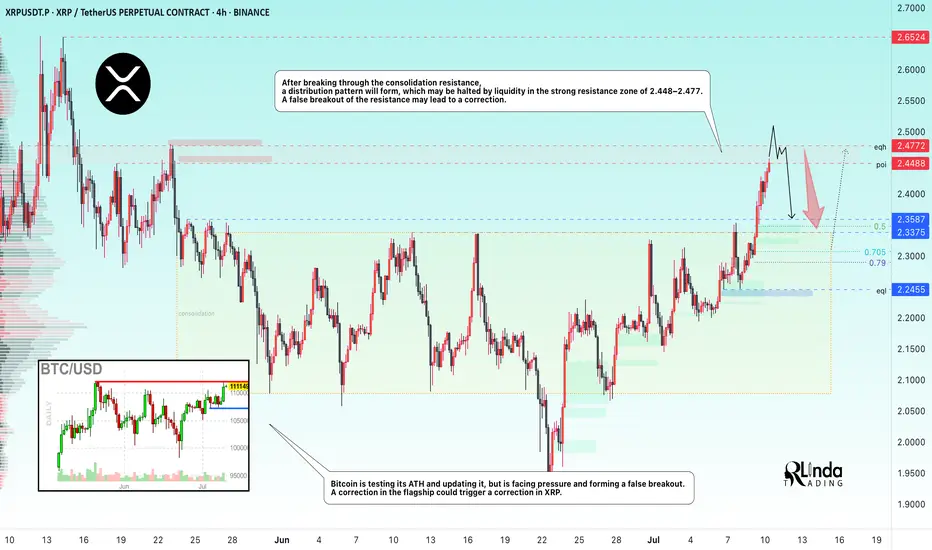
XRPUSDT → Resistance ahead. Correction before growthBINANCE:XRPUSDT is rising after breaking through consolidation resistance. Bitcoin's rally supported the overall market momentum, but a new resistance zone lies ahead...
Bitcoin is testing its ATH and updating it, but is facing pressure and forming a false breakout. A correction in the flagship coin could trigger a correction in XRP, but if Bitcoin continues to storm the 112K area without a pullback, followed by a breakout, the market could find support and continue to rise.
After XRP broke through resistance, the coin entered a distribution phase and is testing an important resistance zone of 2.4488 - 2.4772. The inability to continue growth, a false breakout, and price consolidation in the selling zone could trigger a correction.
Resistance levels: 2.4488, 2.4772, 2.6524
Support levels: 2.3587, 2.3375, 2.2455
Despite breaking through resistance, XRP is still in a local downtrend. Pressure on the market is still present. The formation of a false breakout will indicate that growth is limited for now. However, if the price consolidates above 2.4772 and begins to break out of the local structure, we can expect growth to continue.
Best regards, R. Linda!
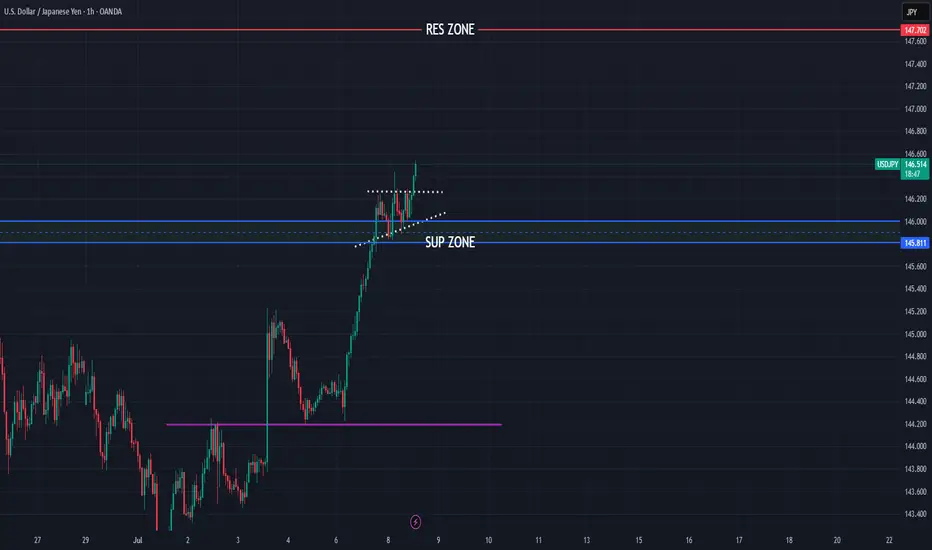
USDJPY – Can the Dollar Squeeze Last?In FX markets, the USDJPY currency pair has moved more than most this week. Initially trading higher, rocked by President Trump’s unveiling of the tariff letter sent to Japan on Tuesday in a social media show outlining new tariffs on Japanese imports of 25%, supported by rising US 10 year treasury yields (+10 bps on week), which often can influence USDJPY prices, and a general squeeze on weak short US dollar positions across all G7/10 currency pairs. This all helped USDJPY to move from Monday’s opening level around 144.40 up to a 3-week high of 147.18 on Wednesday.
Then it was all change as USDJPY ran into a wave of fresh selling as traders took advantage of the squeeze to reopen short positions at higher levels, especially with various Bank of Japan board members discussing the potential for the Japanese central bank to raise interest rates again at some stage later in the year, and then President Trump unveiling more aggressive tariffs on countries such as Brazil (50% tariff), which renewed trader concerns that the US economy may be more negatively impacted by his trade policies. This sent USDJPY to a low of 145.75 this morning before recovering to slightly higher levels (146.25 0700 BST).
Looking forward, trade deals and Trump tariff headlines/social media posts may continue to influence where USDJPY moves into the Friday close, as could the technical outlook ahead of a busy week for scheduled events started on Monday July 14th.
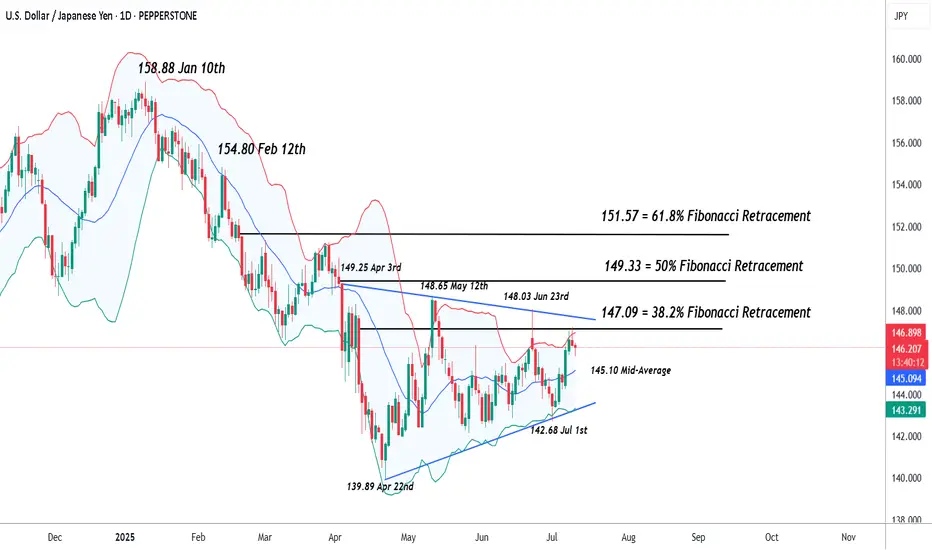
Technical Update: USDJPY Back to Important Resistance?
Since posting the 142.68 July 1st low, USDJPY has rallied strongly, seeing a more than 3% recovery in 6 sessions. This may mean some traders are looking for a more sustained price advance, but as the chart below shows, the latest price strength might only now be back to a resistance focus between the 147.09/147.64 levels.
These levels are equal to a combination of the 38.2% Fibonacci retracement of the January 10th to April 22nd decline at 147.09, and the downtrend that connects the highs seen on April 3rd, May 12th and June 23rd, which currently stands at 147.64. So far at least, this resistance area has capped the latest price strength.
Much will depend on future market sentiment and price trends, but it's possible closing breaks above the 147.09/64 resistance range may be required to suggest potential for a further phase of price strength towards 149.33, the higher 50%, even 151.57 the 61.8% retracements.
What if Resistance at 147.09/64 Continues to Hold?
Of course, the 147.09/64 resistance is currently holding price strength and could even prompt fresh weakness. As such, it could be suggested a more balanced sideways trading range is currently in place, with the latest price strength now back to the upper limit resistance at 147.09/64 .
If this is the case, it is possible price weakness might now emerge, with closing breaks under support at 145.10, the Bollinger mid-average, potentially suggesting further declines are possible towards 143.20, which is the uptrend connecting the recent lows, which also possibly marks the lower limits of the current sideways price range.
The material provided here has not been prepared accordance with legal requirements designed to promote the independence of investment research and as such is considered to be a marketing communication. Whilst it is not subject to any prohibition on dealing ahead of the dissemination of investment research, we will not seek to take any advantage before providing it to our clients.
Pepperstone doesn’t represent that the material provided here is accurate, current or complete, and therefore shouldn’t be relied upon as such. The information, whether from a third party or not, isn’t to be considered as a recommendation; or an offer to buy or sell; or the solicitation of an offer to buy or sell any security, financial product or instrument; or to participate in any particular trading strategy. It does not take into account readers’ financial situation or investment objectives. We advise any readers of this content to seek their own advice. Without the approval of Pepperstone, reproduction or redistribution of this information isn’t permitted.
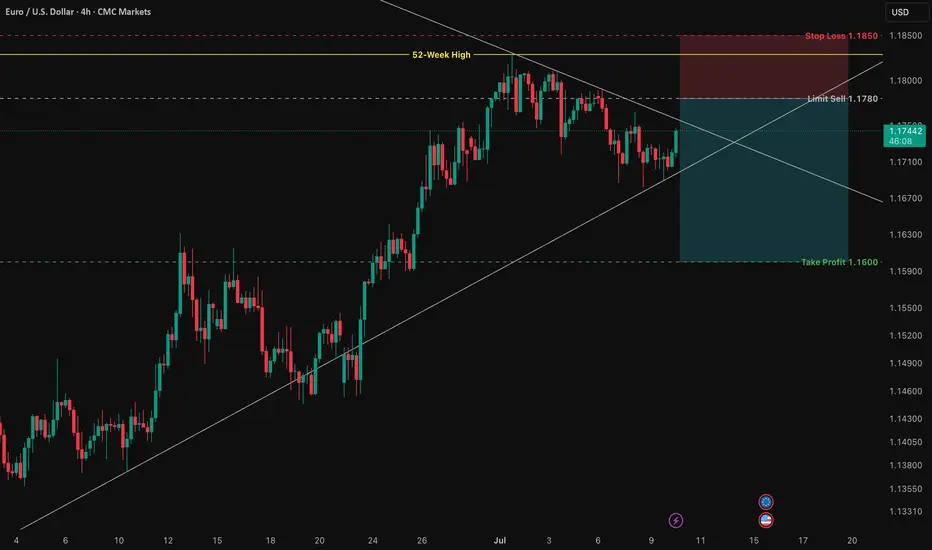
EUR/USD: A High-Probability Short Setup at 1.1829At its core, this trade is driven by a powerful and growing divergence between the US and European economies. While technicals tell us where to trade, fundamentals tell us why we're trading.
1️⃣ The Interest Rate Gap: The U.S. currently offers significantly higher interest rates (4.25% - 4.50%) compared to the Eurozone (2.15%). This makes holding the US Dollar more attractive, creating natural downward pressure on the EUR/USD.
2️⃣ Central Bank Policy: The US Federal Reserve remains hawkish, focused on strength and fighting inflation. Meanwhile, the European Central Bank is dovish, signaling a willingness to keep conditions loose to support a weaker economy.
3️⃣ Labor Market Strength: The US enjoys a robust labor market with unemployment at just 4.1%, while the Eurozone's is significantly higher at 6.3%. This points to a stronger US economy.
In simple terms, the US economy is strong, and its central bank is acting like it. The Eurozone economy is weaker, and its central bank is acting accordingly. This fundamental imbalance is the fuel for a potential significant move down in EUR/USD.
The Technical Picture: The Wall at 1.1829
As you can see on the 4H chart, the price has run into a major wall of resistance at the 52-week high of 1.1829 . After a long uptrend, the momentum has stalled, and the price is now consolidating inside a symmetrical triangle . This coiling of price action often precedes a strong breakout.
Our strategy is not to guess the breakout, but to act on a high-probability retest of resistance. We are looking to enter a short position as the price pulls back towards the upper boundary of this triangle, anticipating a failure at resistance and a subsequent break to the downside.
The Actionable Trade Plan
This setup offers an excellent risk/reward profile.
📉 Asset: EUR/USD
👉 Entry (Limit Sell): 1.1780
⛔️ Stop Loss: 1.1850
🎯 Take Profit: 1.1600
📈 Risk/Reward Ratio: ~2.57:1
Trade safe and manage your risk.
Ethereum Wave Analysis – 9 July 2025- Ethereum broke the resistance area
- Likely to rise to resistance level 2885.00
Ethereum cryptocurrency recently broke the resistance area located between the resistance level 2645.00 (which stopped wave 1 at the start of July) and the resistance trendline of the weekly Triangle from January.
The breakout of this resistance area accelerated the active short-term impulse wave 3 of the intermediate impulse wave (3) from June.
Given the strongly bullish sentiment seen across the crypto markets today, Ethereum cryptocurrency can be expected to rise to the next resistance level 2885.00 (top of wave (1) from June).

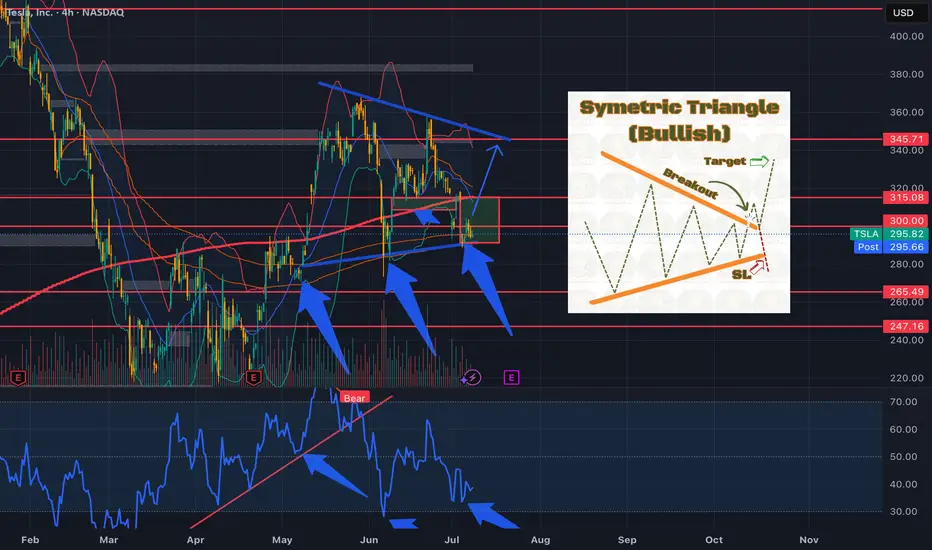
TSLA....Symetric Triangle....Earnings Rally?Could we see the bulls step in and leads us into earnings?
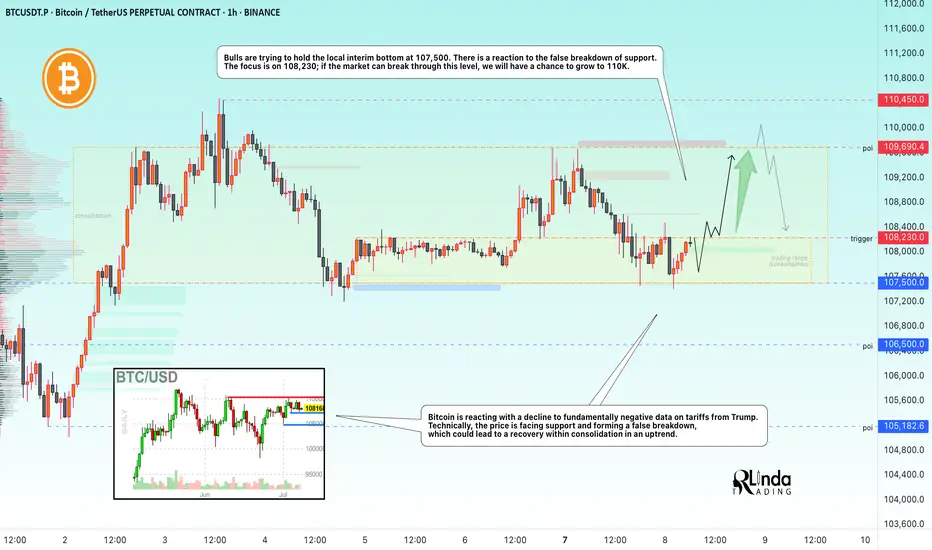
BITCOIN → Market manipulation. Chance for growth to 110KBINANCE:BTCUSDT , as part of a correction triggered by negative news from the US regarding tariffs, is testing liquidity in the support zone. There is a chance of recovery to 110K.
Bitcoin is reacting with a decline to fundamentally negative data on tariffs from Trump. Technically, the price is facing support and forming a false breakdown, the purpose of which was to capture liquidity. This could lead to a recovery within consolidation in an uptrend, but again, there are conditions...
Countries that have received notification of tariffs are responding positively to cooperation (if this trend continues, Bitcoin could receive a local bullish driver).
The market perceives this as positive, and after liquidity is captured, the price could recover to the resistance of the trading range.
Resistance levels: 108230, 109690
Support levels: 107500, 106500
Bulls are trying to hold the local interim bottom at 107500. There is a reaction to the false breakdown of support. The focus is on 108230; if the market can break through this level, we will have a chance to grow to 110K.
Best regards, R. Linda!
USDJPY still bullish to expect
FX:USDJPY strong bullish push, expectations are still bullish to see, currently we can see price is break ASCENDING TRIANGLE, JPY still looks the weakest, dont see changes, here still bull to expect.
SUP zone: 146.000
RES zone: 147.700
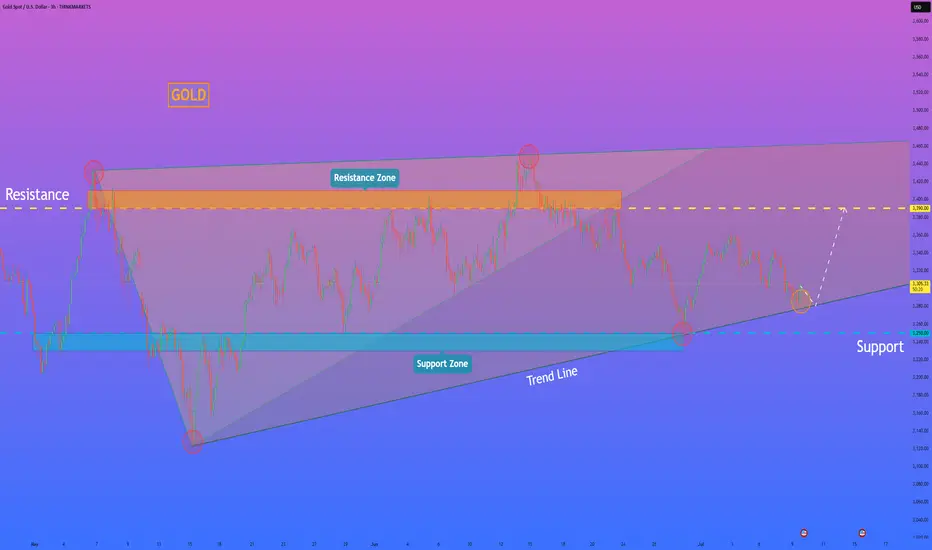
HelenP I. Gold can rebound from trend line and start to move upHi folks today I'm prepared for you Gold analytics. In this chart, we can see that gold has formed a clear wedge pattern, and within it, we can also observe a smaller triangle forming. This structure reflects a narrowing price range and growing tension between buyers and sellers. After testing the upper boundary near the resistance zone at 3390 - 3410 points twice, gold started moving lower and now approaches the trend line again. This level has already held as support multiple times, and each time the price touched it, it showed a rebound with renewed buying interest. Now the price is again trading near this trend line, around the 1300s area, and a small triangle has formed inside the larger wedge. This triangle may act as a base for the next upward movement. I believe that as long as gold respects this trend line and doesn’t break below the 3250 - 3230 support zone, the probability of upward continuation remains strong. My current target is the 3390 resistance level, which aligns with the top boundary of both the wedge and the resistance zone. A breakout above the triangle may give the price enough momentum to approach this area again. That’s why I remain bullish in this situation and expect a bounce from current levels, followed by an upward move toward the resistance. If you like my analytics you may support me with your like/comment.❤️
Disclaimer: As part of ThinkMarkets’ Influencer Program, I am sponsored to share and publish their charts in my analysis.
Silver set to break Higher? chart patterns suggest big moveSilver has been stuck in a sideways range for nearly a month, but a breakout may be near. A large ascending triangle hints at a possible move toward 41.37. Depending on how the market reacts, traders could aim for short-term targets with a 2.75 to 5.87 reward ratio or ride it longer for a potential 9.54. Classic markets are messy, so timing matters. Here's how I’d trade it and where I'd place stops. Let me know what you think in the comments.

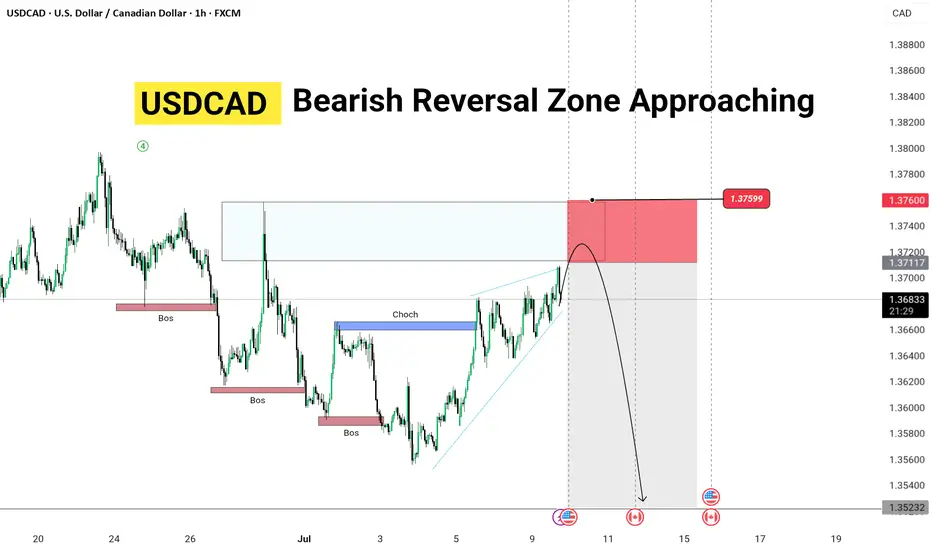
Bearish Reversal Zone Approaching🔹 Pair: USDCAD
🔹 Timeframe: H4
🔹 Price: 1.36806
🔹 Bias: Short/SELL Setup Pending
---
💡 Analysis Summary:
USDCAD is approaching a major resistance zone aligned with the 61.8% Fibonacci retracement level from the previous bearish leg.
Structure shows a clear ABC corrective pattern with signs of exhaustion at current levels.
---
📌 Key Levels to Watch:
🔺 Resistance: 1.3720–1.3740 (Potential Reversal Zone)
🔻 Target Zone: 1.3450–1.3500
🔓 Invalidation Above: 1.3760
---
📉 Plan:
Watch for bearish confirmation (e.g., bearish engulfing, double top, divergence) at resistance before entry.
High RR setup expected if price rejects near 1.3740.
---
🔁 Wait. Confirm. Execute.
🧠 Trade smart, not fast.
📊 More updates coming daily.
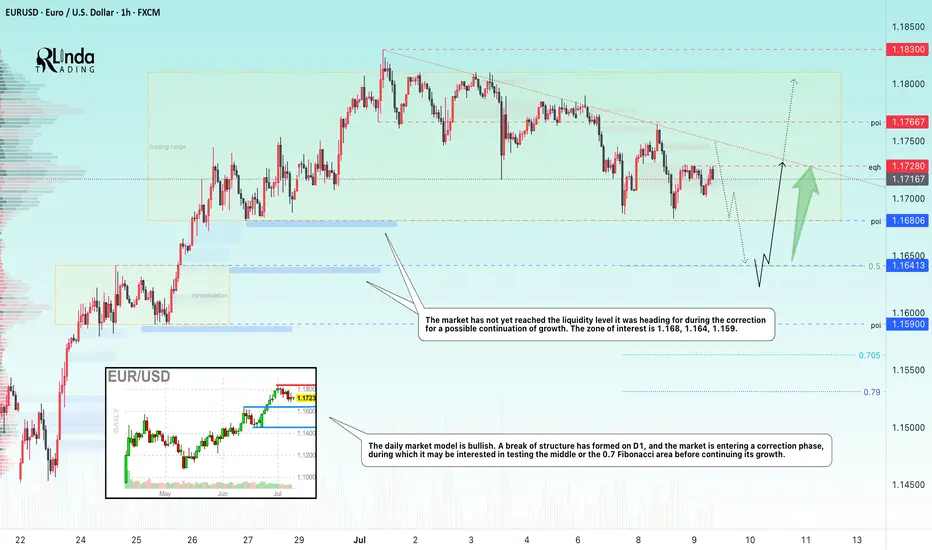
EURUSD → Bullish daily structure. Correction before growthFX:EURUSD , after significant growth and a break of structure, has entered a local correction, the target of which may be a phase of accumulation of potential for updating intermediate highs (1.183).
The daily market model is bullish. A break of the structure has formed on D1, and the market is entering a correction phase, during which it may be interested in testing 0.5 or the 0.7 Fibonacci area before continuing its growth. I would also like to draw attention to the previously broken resistance level of 1.164 - 1.163, which, within the current correction, may act as a support level for buyers...
In addition, the market has not yet reached the liquidity level it was heading for during the correction for a possible continuation of growth. Zone of interest: 1.168, 1.164, 1.159
Resistance levels: 1.1728, 1.1766
Support levels: 1.168, 1.164, 1.159
A false breakdown of the specified support zone could change the market imbalance and attract buyer interest, which could generally support the bullish trend.
Best regards, R. Linda!
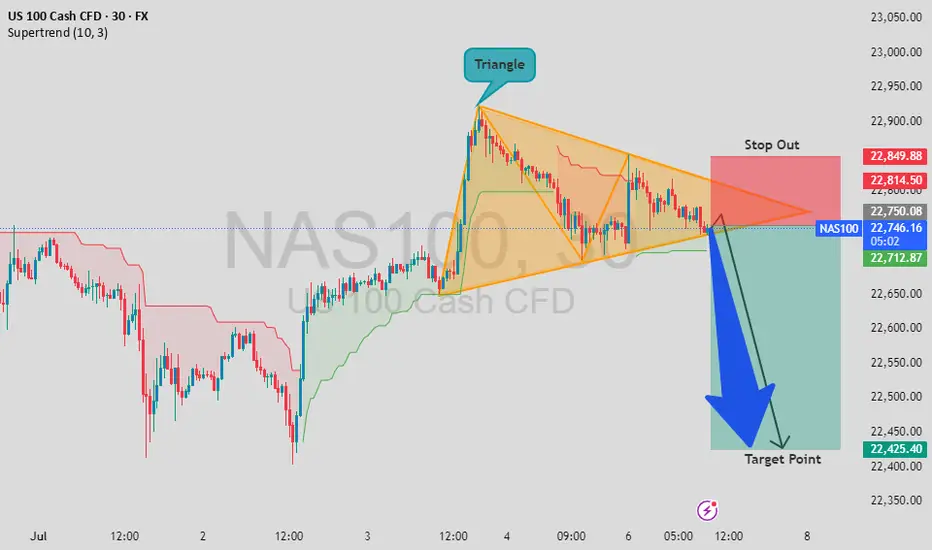
NAS100 - Bearish Triangle Breakdown Forming!NAS100 - Bearish Triangle Breakdown Forming!
A symmetrical triangle pattern has formed on the NAS100 30-min chart, signaling potential volatility ahead. We’re nearing the apex of the triangle, and price action suggests a possible bearish breakout.
🎯 Entry: 22,750.00
🎯Target: 22,400.40
⛔ Stop Out: 22,850.88
The risk/reward setup is favorable if the breakout follows through. Keep a close eye on volume confirmation as price exits the triangle.
What do you think about this triangle formation? Will the breakdown hold, or could bulls trap the shorts again?
💬 Share your opinion below and let’s discuss the setup!
🙏 If you find this helpful, please give it a like and follow for more technical ideas!
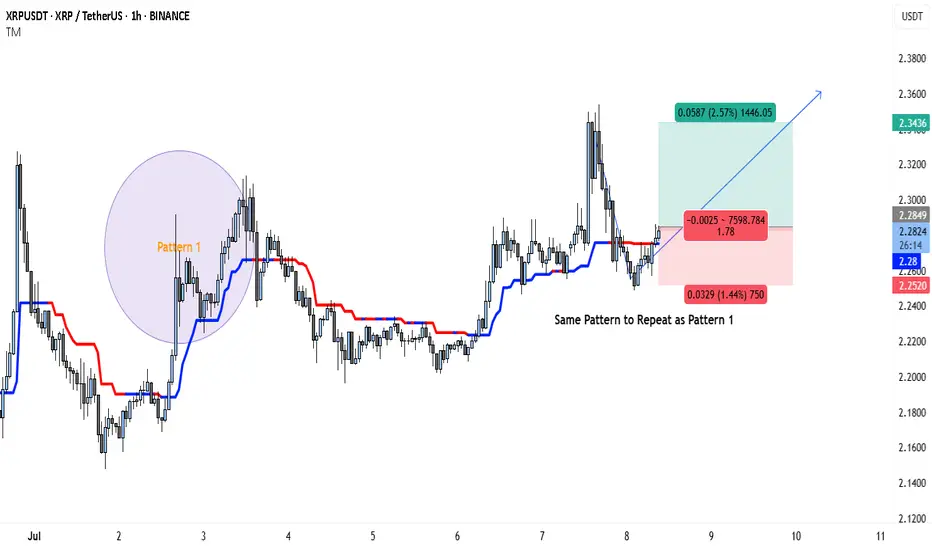
XRP Pattern Repeats—Next Move to $2.34?The XRP/USDT 1-hour chart is showing a compelling setup that may mirror a previously bullish price pattern. The left side of the chart highlights Pattern 1, which played out after a period of sideways consolidation followed by a breakout, resulting in a strong upward move. Now, price action is repeating a similar structure with nearly identical conditions forming.
In Pattern 1, XRP consolidated in a tight range, flipped the trend indicator from red to blue (suggesting a momentum shift), and then surged higher. This same transition is occurring again in the current market phase. Price has reclaimed the trend baseline, which has turned blue, hinting at growing buyer strength.
The idea here is that XRP could be preparing for another impulsive move to the upside, identical to what happened before. The setup is visually marked with a trade box showing entry, stop-loss, and target levels.
Trade Idea Based on Current Pattern
• Entry: 2.2849
• Target: 2.3436
• Stop-loss: 2.2520
• Reward-to-Risk (R:R): ≈ 1.78
• Potential Gain: 2.57%
• Potential Loss: 1.44%
The structure favors a long position, as long as the price holds above the 2.25–2.26 support range. A break below this could invalidate the setup and trigger the stop-loss. If the breakout is confirmed with volume, XRP could move rapidly toward the 2.34 level and possibly beyond.
This kind of fractal behavior, where patterns repeat themselves in similar market conditions, is common in crypto. With the trend indicator already flipping bullish and price forming higher lows, the probability of continuation looks solid—especially for short-term traders.
As always, trade with proper risk management, and be cautious of volatility that can trigger stop-hunts in tightly ranged zones.
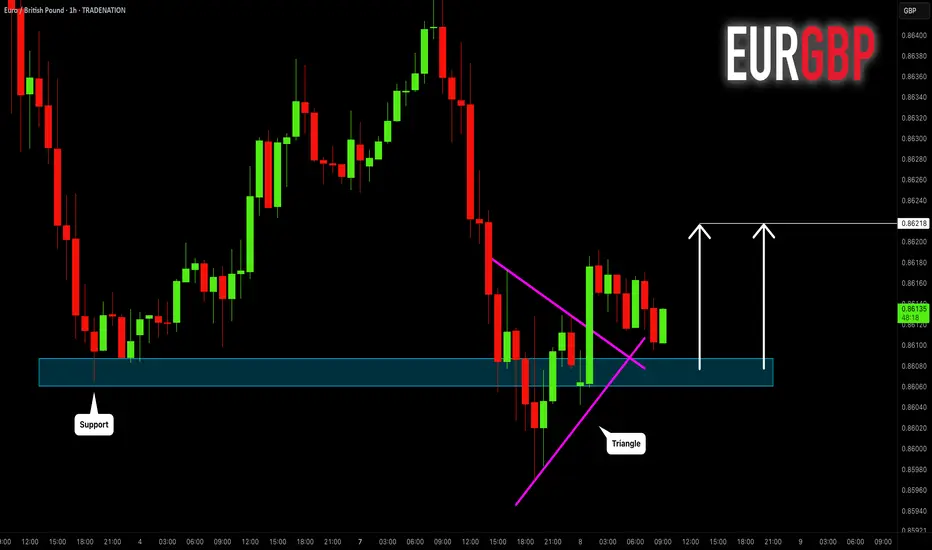
EURGBP: Bullish Move After False Breakout 🇪🇺🇬🇧
EURGBP will likely go up from a key daily/intraday support,
following a bullish breakout of a resistance line
of a bullish triangle on an hourly time frame.
The price may go up to 0.86218 level then.
❤️Please, support my work with like, thank you!❤️
I am part of Trade Nation's Influencer program and receive a monthly fee for using their TradingView charts in my analysis.
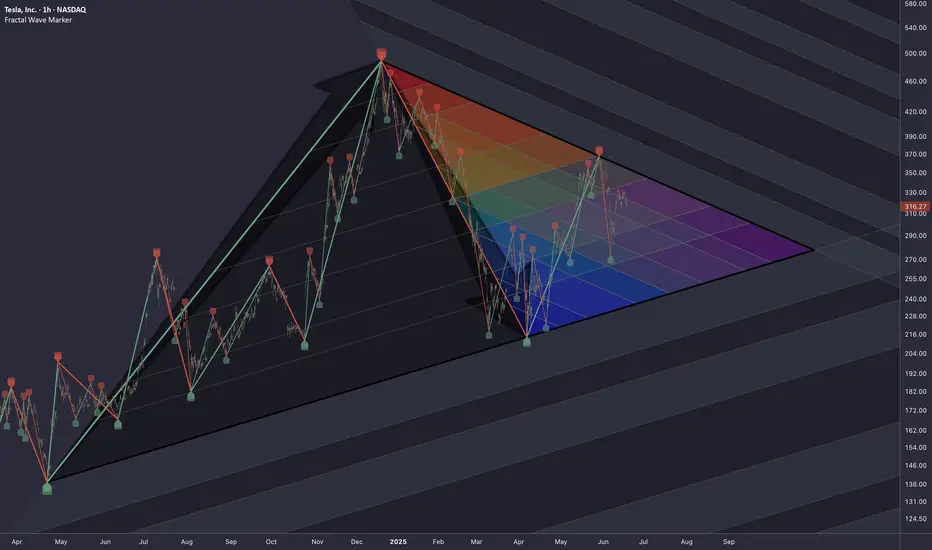
TSLA: Triangle PatternResearching the market through structural lens, particularly the topology of trapped liquidity buildup and compression of volatility, that leads to a proportionally heavier move once a breakout occurs.
Raw compression area derived from waves of higher degrees (2nd, 3rd)
The longer price consolidates within boundaries of a triangular formation, the more significant the breakout tends to be.
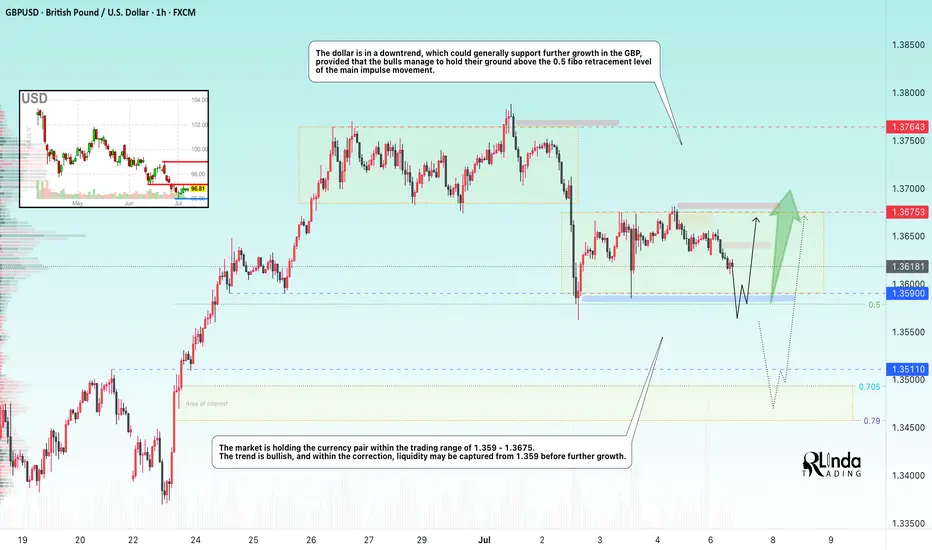
GBPUSD → Correction before the bullish trend continuesFX:GBPUSD is forming a trading range for consolidation of potential ahead of a possible continuation of growth as part of a countertrend correction.
The dollar is trying to recover from its decline due to a local change in the fundamental background, but the global trend for the DXY is bearish. This could provide support for the GBP to continue growing, provided that the bulls hold their defense above the 0.5 Fibonacci zone of the main impulse movement.
The market is holding GBPUSD within the trading range of 1.359 - 1.3675. The trend is bullish, and within the correction, liquidity may be captured from 1.359 before further growth.
Resistance levels: 1.3675, 1.3764
Support levels: 1.359, 1.3511
If the reaction to the subsequent retest of support at 1.359 is weak, we can consider a continuation of the correction to the 0.7-0.79 Fibonacci zone, which would be the most favorable entry point for us (focus on 1.3511 — a false breakout will increase interest in buying). In the current situation, the focus is on 1.359.
Best regards, R. Linda!
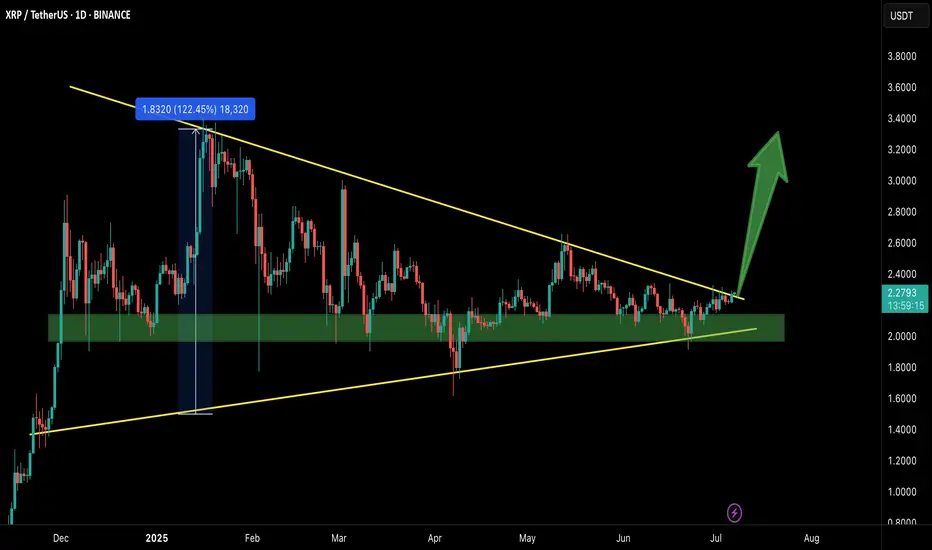
XRP/USDT – Breakout Confirmed!Hey Traders — if you're into high-conviction setups with real momentum, this one’s for you.
XRP has finally broken out from the massive symmetrical triangle on the 1D timeframe after holding the green support zone like a champ.
This structure has been compressing for months, and with this breakout, momentum could be shifting in favor of the bulls.
Entry: Current Market Price (CMP)
Add More: On dips above $2.20
Targets: $2.60 / $2.95 / $3.40 / $3.80
Stop Loss: $2.05
Leverage: 5x–10x
As long as price stays above the breakout zone, this setup holds strong potential. Keep a close eye for volume confirmation and follow-through.
Let’s see how this plays out. Will update as it unfolds.
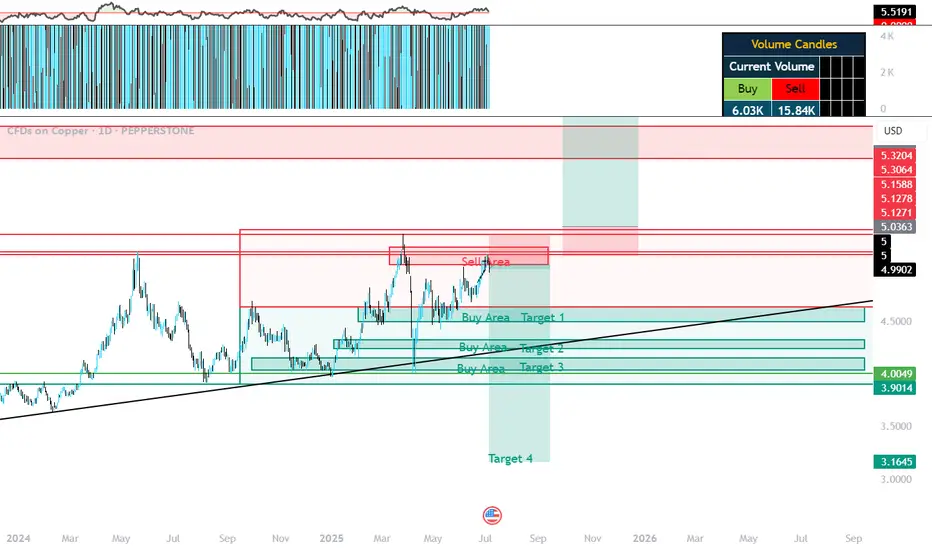
DOUBLE PATTERN:Cup and TriangleHello Traders,
All the eyes now on the next leg for the copper if Trump did not Finalize the Tariffs copper will go back to at least the bottom again 3.4 3.1 as every one kept loading up for the imports now the states is overloaded with loads of materials and minerals imagine what could happened if he didn't sign up this Tariffs on the mineral! they will be selling it for so cheap to cover the losses dramatically same like what happened with the oil its a commodity right !that's one scenario, the other one is every thing move as planned and the copper get back to the bottom of the triangle and shoot straight up so lets see what could happed I'm in short for now good luck, kindly support my idea if you like and make your decisions based on your research