Triangle
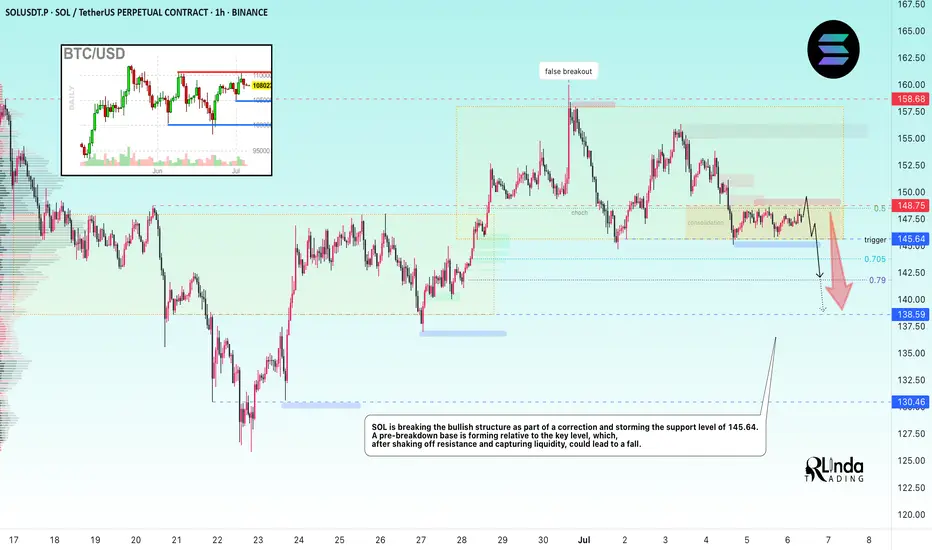
SOLANA → Pre-breakdown consolidation may lead to distributionBINANCE:SOLUSDT is declining and testing the support of the trading range as Bitcoin pauses after strong growth and enters a correction phase...
SOL looks a bit weaker than Bitcoin technically, but SOLANA has some positive fundamentals, though that might not be enough.
After forming a false breakout of key daily resistance, Bitcoin is moving into a correction phase. An update of local lows on the chart could trigger a drop across the entire cryptocurrency market.
In SOL, the focus is on the two nearest levels of 148.75 and 145.64. A breakdown of support could trigger the distribution of accumulated energy within the specified range as part of a downward momentum.
Resistance levels: 148.75, 151.2, 153.88
Support levels: 145.64, 138.59
The ideal scenario would be a false breakout of 148.75 (liquidity capture) and a retest of 145.64, followed by a break of support. Consolidation below 145.65 could trigger a drop to the zone of interest at 138.59.
Best regards, R. Linda!
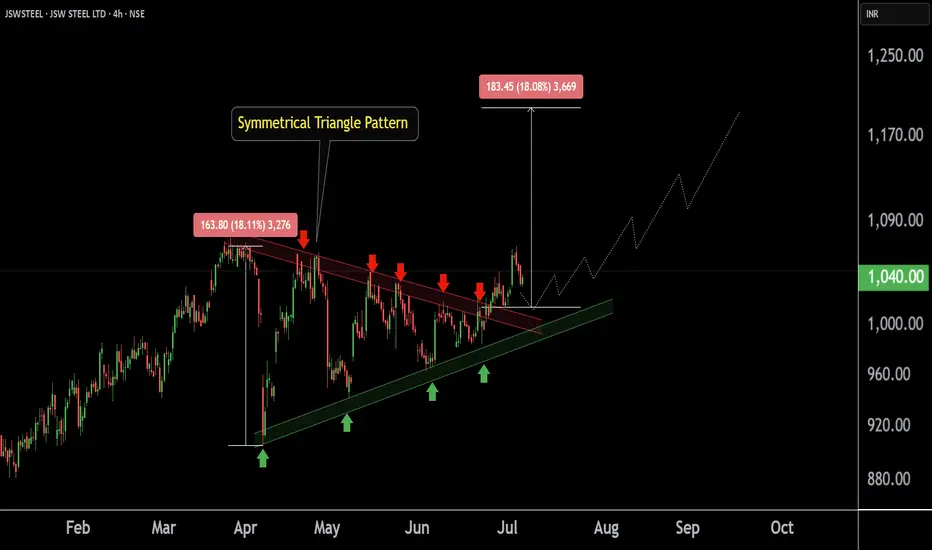
JSWSTEEL ' S Key Level | Big Breakout !This is the 4 hour chart of JSW STEEL.
JSWSTEEL having a good pattern support zone near at 980-1000 level .
JSW Steel has formed a Symmetrical Triangle pattern on the chart, and a breakout has occurred. The stock may retested the breakout level and then appears poised to move toward its projected target at 1180 - 1200 .
If the support zone level is sustain , then we may see higher prices in JSW Steel.
Thank You !!
Bitcoin (BTCUSD) 4-hour timeframe Smart Money Concept (SMC)📌 Key Zones:
Zone Type Price Area Importance
Premium ~111,000-112,000 Sell area / resistance
Buyers Box ~107,000-108,500 Current minor support
FVG Zone ~100,000–106,000 Strong buy zone with imbalance
Discount Below 102,000 High interest zone for large buyers
Resistance Target 111,627.83 Key liquidity target
---
🔔 Conclusion:
As long as buyers defend the current support, price can target the 111.6K resistance.
If rejected, deeper discount entries may be formed in the FVG zone, giving smart money a chance to reaccumulate.
Keep an eye on economic calendar/news (indicated by icons on chart) which might trigger volatility near July 10.

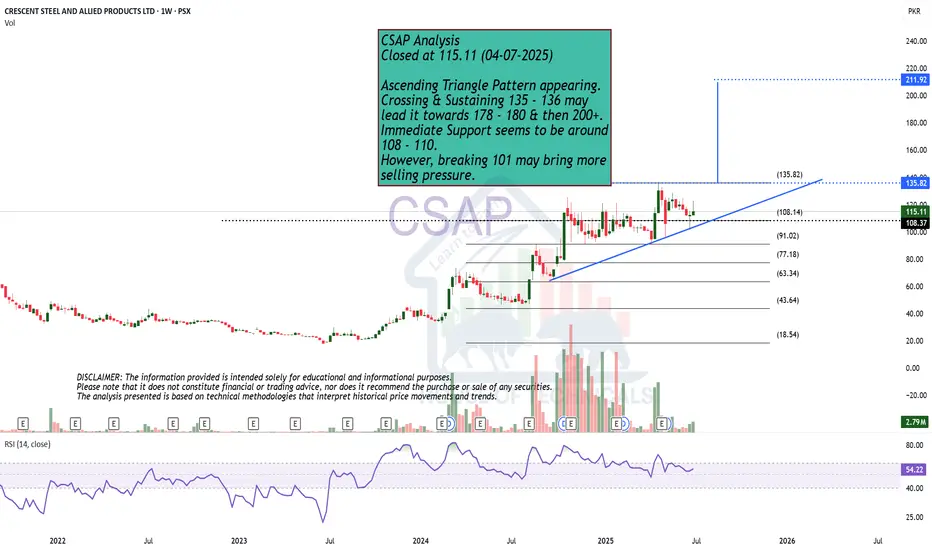
Ascending Triangle Pattern appearing.CSAP Analysis
Closed at 115.11 (04-07-2025)
Ascending Triangle Pattern appearing.
Crossing & Sustaining 135 - 136 may
lead it towards 178 - 180 & then 200+.
Immediate Support seems to be around
108 - 110.
However, breaking 101 may bring more
selling pressure.
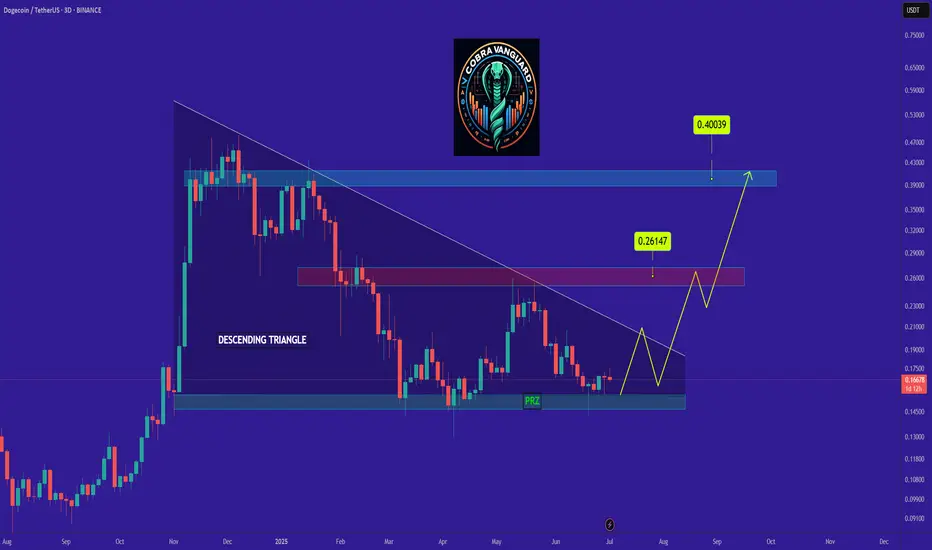
DOGE Ready for PUMP or what ?The price is within a descending triangle, which is discouraging, but this market often behaves contrary to these patterns, and it could be the start of a new price increase. I won’t fall for these patterns anymore.
Best regards CobraVanguard.💚
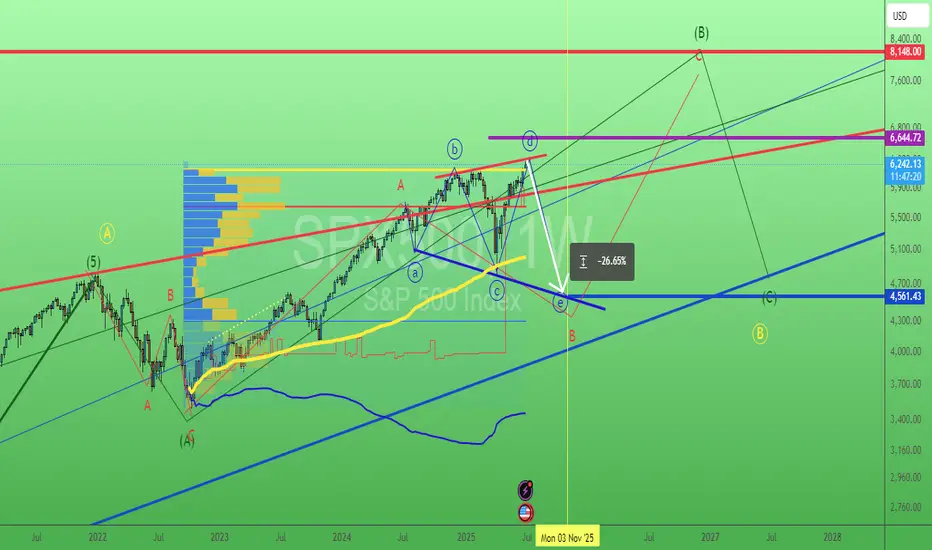
SP500 rock & roll with Trump.. 4/July/25SPX500 breaking ATH again are we in bullish stage? Or again Donald Trump "Inviting" us come to his WWE stage for his favourite "wrestling" games.. Jumping up and down or up side down.( expanding triangle) ......
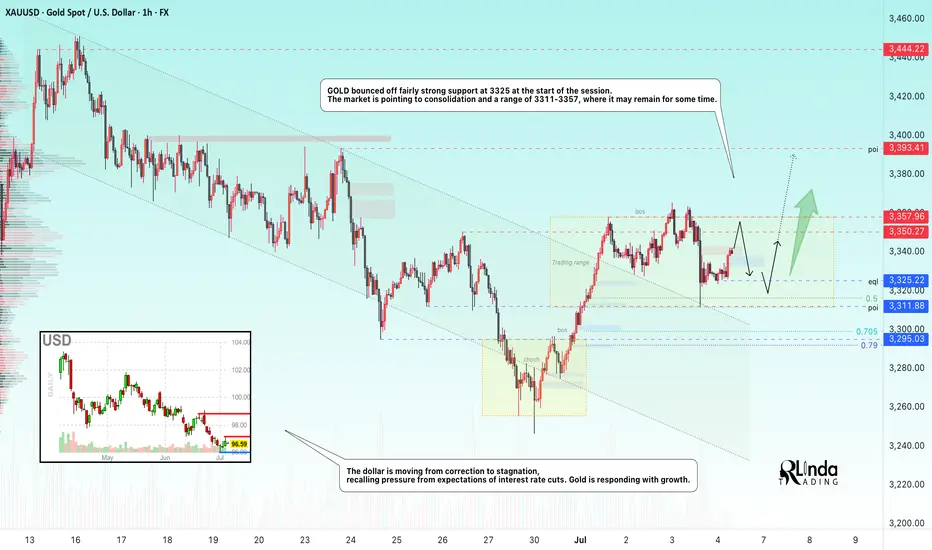
GOLD → Consolidation after a trend break...FX:XAUUSD , after breaking out of a downtrend, is consolidating, which may continue for some time due to Thursday's news and low liquidity on Friday.
Gold stabilized after a correction, but volatility risks remain. After falling from a weekly high of $3,366, gold prices found demand again in Asia on Friday. Strong US employment data cooled expectations of an imminent Fed rate cut, which supported the dollar and limited gold's gains. Additional pressure is coming from the hawkish shift in Fed expectations, but US budget risks and weak liquidity due to the holidays could increase price volatility in the coming days.
Technically, the focus is on the boundaries of the current consolidation at 3311 and 3357. In addition, within the range there is an important level of 3325, which divides the market into bearish and bullish zones...
Resistance levels: 3350, 3357, 3393
Support levels: 3325, 3311
It is important to understand the situation: due to the holiday in the US, liquidity is lower, making it easier to move the price. The rest of the world, interested in gold, can easily push the price up. The trigger will be the zone 3350 - 3350. There is a chance that the market will try to break through the resistance without a pullback and continue to rise to 3393.
However, the most likely scenario is that after yesterday's volatility, gold will remain within 3325 - 3357 before rising next week
Best regards, R. Linda!
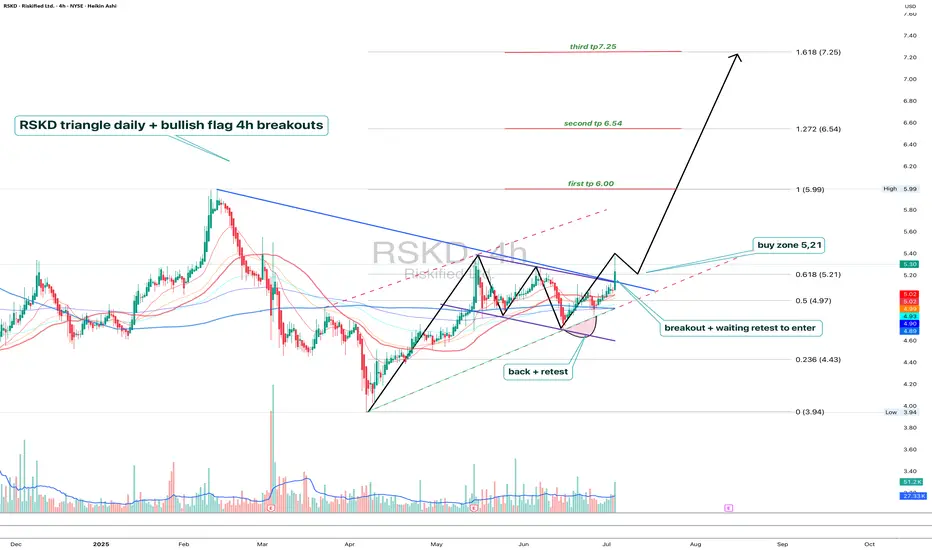
RSKD - breakout confirmed, now waiting for retestRiskified (RSKD) shows a textbook breakout setup: daily triangle plus 4H bullish flag. Price already broke out and is now retesting the 0.618 Fibonacci retracement at $5.21, which also matches the flag resistance flip and EMA cluster. This is a clean buy zone with strong technical alignment.
Volume spiked during the breakout, trend structure remains intact, and moving averages are converging — usually a precursor to strong moves. The current pullback is orderly, and if buyers show strength on this retest, the price could target $6.00, then $6.54, and potentially $7.25 (1.618 extension).
Fundamentally, Riskified offers fraud prevention tech for e-commerce. The business is benefiting from global growth in online transactions and improved margin control. While still unprofitable, recent quarters showed progress toward positive operating leverage and strong client acquisition.
Tactical plan:
— Entry on confirmation from $5.21 retest
— TP1: $6.00
— TP2: $6.54
— TP3: $7.25
— SL: below $4.90 or $4.43 support zone
You’ve been watching this one. The triangle broke. The pullback is clean. Maybe it’s time to stop watching and start participating.
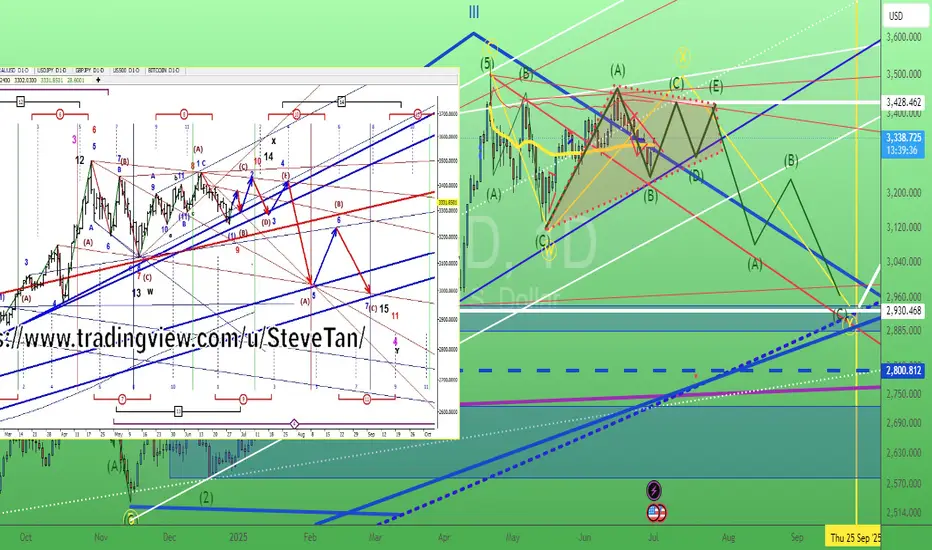
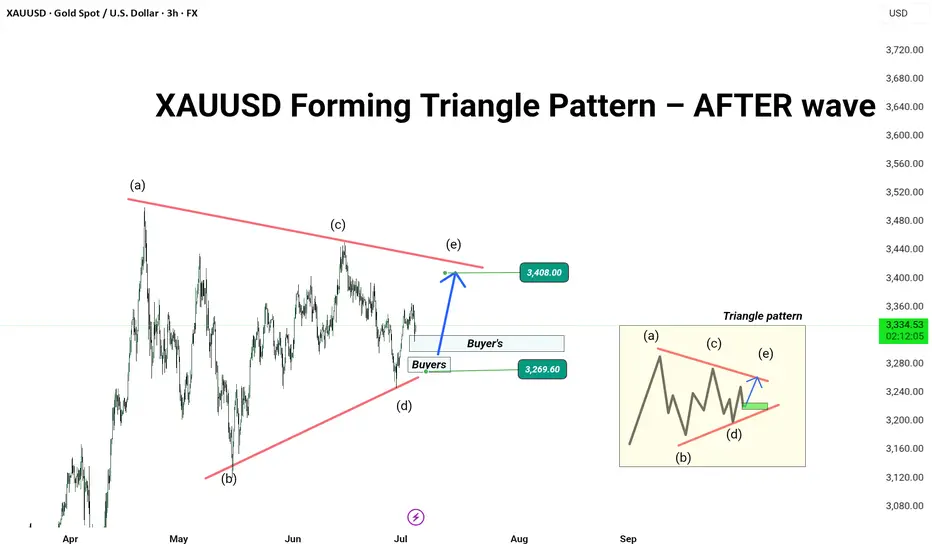
XAUUSD Forming Triangle Pattern – Eyeing Breakout After Wave (e)🚨 Gold (XAUUSD) Technical Analysis – 3H Chart
Gold is currently forming a classic contracting triangle pattern (ABCDE), with wave (e) in progress. Price is bouncing from a strong buyers’ zone near 3269.60, showing signs of upward pressure.
📊 Current Structure:
Wave count: (a)-(b)-(c)-(d)-(e)
Consolidation within a symmetrical triangle
Key support: 3269.60
Resistance zone to watch: 3408.00
📈 Potential Scenario:
If price holds above the buyer’s zone, we can expect a bullish wave (e) push towards the upper trendline at 3408, potentially leading to a breakout continuation.
📍 Trade Plan (Educational Purpose):
Long Setup Valid Above: 3269.60
Target: 3408.00
Stop Loss (SL): Below 3260 (based on your risk profile)
---
🧠 Why This Matters?
This triangle setup often leads to strong breakout moves, especially in commodities like gold during fundamental uncertainty or dollar index shifts. The market is compressing — be prepared for the breakout move.
---
📢 Follow for more clean Elliott Wave + Price Action setups!
💬 Drop your analysis in the comments. Let’s grow together!
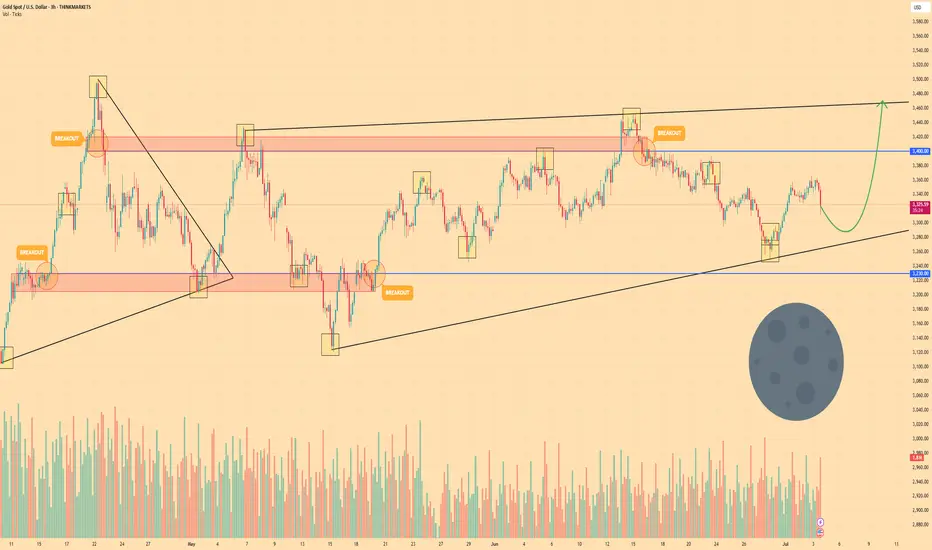
GOLD - Price can continues rise to resistance level and break itHi guys, this is my overview for XAUUSD, feel free to check it and write your feedback in comments👊
Price made an upward impulse from the support line of the triangle and rose to the resistance line, breaking two levels.
Then the price dropped back, after which repeated impulse and exited from the triangle, reaching the resistance area.
After this movement, Gold started to trades inside a wedge, where it dropped from the resistance line to the support line.
Next, the price in a short time rose from this line to the resistance line again, breaking $3230 and $3400 levels.
But recently, it made a correction to the support line, breaking $3400 level again, and then started to grow.
Now, I expect that Gold can little decline and then continue to move up to $3470, breaking the resistance level.
If this post is useful to you, you can support me with like/boost and advice in comments❤️
Disclaimer: As part of ThinkMarkets’ Influencer Program, I am sponsored to share and publish their charts in my analysis.
AUDCHF AUDCHF is preparing to break through support and fallWeak market structure. Gradually declining lows and no reaction to support at 0.5211. Buyers are trying to keep the price above 0.5211, but under market pressure their strength is weakening.
Relative to 0.5211, we see the formation of consolidation, which is of a “pre-breakdown” nature.
Accordingly, a break below the 0.5211 support level could trigger the activation of buyers' SL orders, leading to liquidation and a downward price distribution.
Potential targets include 0.518 and 0.5164.

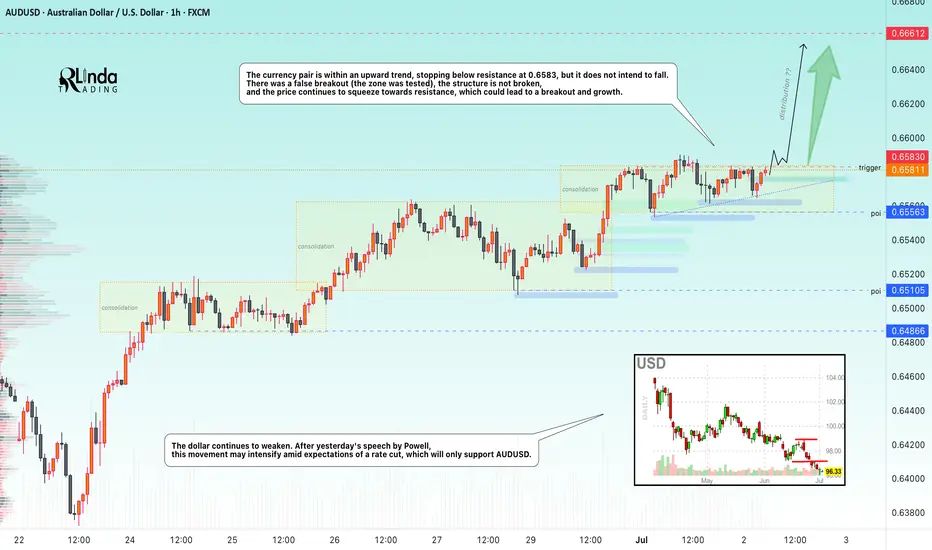
AUDUSD → Pre-breakout consolidation for trend continuationFX:AUDUSD may continue its upward trend. After another local distribution, the currency pair is consolidating and may repeat the cycle
The dollar index continues to fall, the global trend is clear, and the price is testing multi-year lows. After yesterday's speech by Powell, the decline may intensify amid expectations of a rate cut, which will only support AUDUSD.
AUDUSD is moving within an uptrend, stopping below resistance at 0.6583, but is not going to fall.
There was a false breakout (the zone was tested), the structure is not broken, and the price continues to squeeze towards resistance, which could lead to a breakout and growth
Resistance levels: 0.6583
Support levels: 0.6566, 0.6556
There is potential accumulation in the market, and the market is choosing growth against the backdrop of a falling dollar as its direction. Accordingly, the currency pair is one step away from a possible realization phase. Thus, if the price breaks 0.6583 and consolidates above this zone, it may continue to grow in the short and medium term.
Best regards, R. Linda!
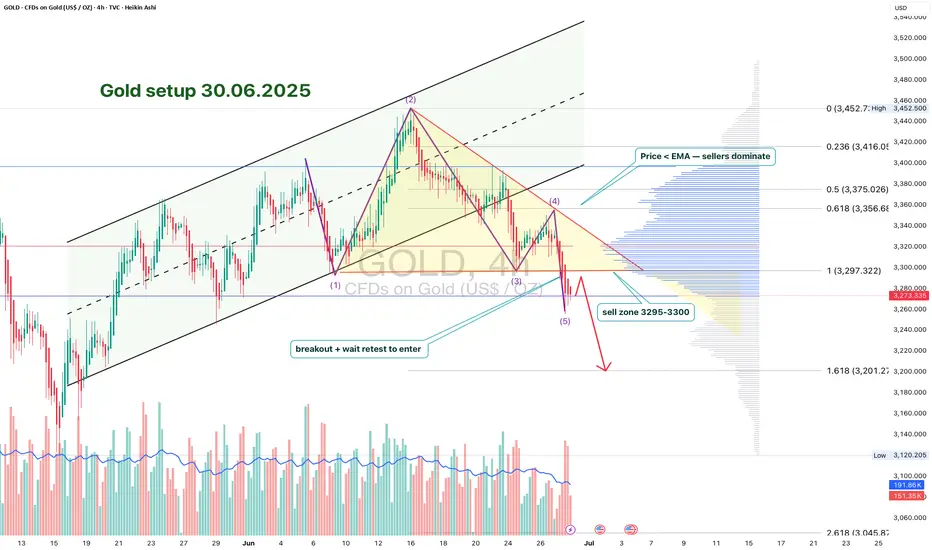
GOLD 4H: structure broken - phase reversal beginsTwo key directional signals were recorded on the gold chart: first, a breakdown of the ascending channel, followed by a confident downward exit from the triangle with a clear fixation under the $3297 boundary. Both figures worked independently, but consistently - and strengthened the impulse towards selling.
The price has already gone beyond the lower boundary of the triangle ($3297), confirming the bearish scenario. Candlesticks closing under the level and local consolidation from below is a characteristic formation before the momentum continues.
Technical parameters:
- Channel breakout: completed
- Triangle breakout: $3297 level
- Retest from below: expected as confirmation
- EMAs reversed downwards, structure broken
- Volumes strengthened at the moment of breakout
Tactical plan:
- Sell after retest of $3297
- Targets on the move: $3248 and $3201
- Stop: above $3305 (above the area of false outs).
The current structure indicates the end of the accumulation phase and the beginning of the downward momentum. As long as the price holds below $3297 - shorts are the priority.
Gold setup: ascending triangle and Trump’s debt bombGold just formed an ascending triangle, and a breakout could send it $300 higher. In this video, we analyse the new pattern, the key breakout level, and why Trump’s new tax bill and Powell’s potential replacement could spark a major move. Will fundamentals match the technicals? Watch to find out.

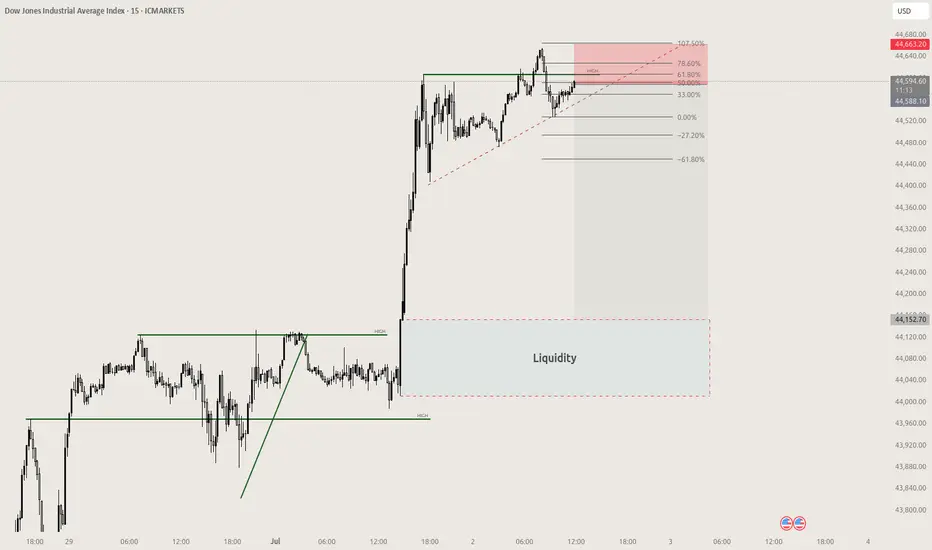
US30 Scalp short Swing failure patternSwing failure pattern with bearish FVG, wait for bearish candle confirmation, liquidity below
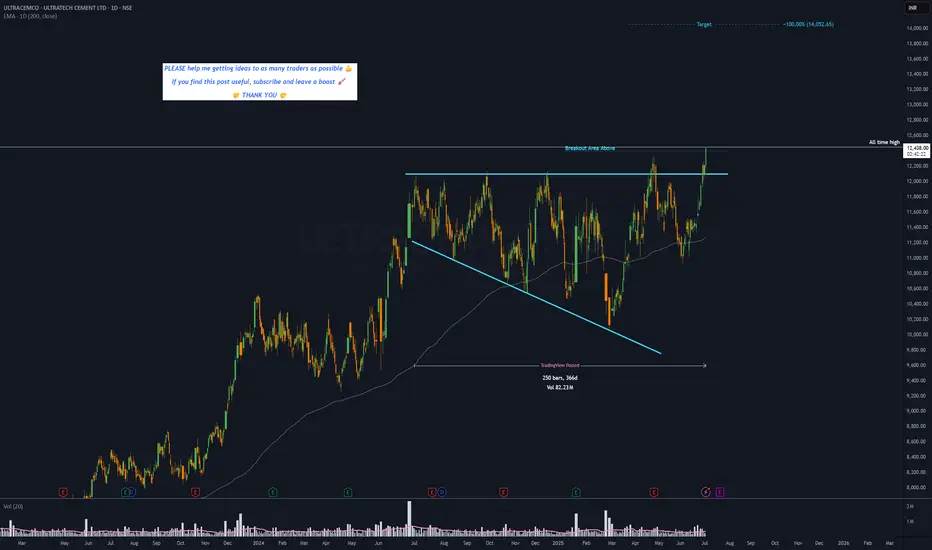
ULTRACEMCO - 1 year INVERTED TRIANGLE══════════════════════════════
Since 2014, my markets approach is to spot
trading opportunities based solely on the
development of
CLASSICAL CHART PATTERNS
🤝Let’s learn and grow together 🤝
══════════════════════════════
Hello Traders ✌
After a careful consideration I came to the conclusion that:
- it is crucial to be quick in alerting you with all the opportunities I spot and often I don't post a good pattern because I don't have the opportunity to write down a proper didactical comment;
- since my parameters to identify a Classical Pattern and its scenario are very well defined, many of my comments were and would be redundant;
- the information that I think is important is very simple and can easily be understood just by looking at charts;
For these reasons and hoping to give you a better help, I decided to write comments only when something very specific or interesting shows up, otherwise all the information is shown on the chart.
Thank you all for your support
🔎🔎🔎 ALWAYS REMEMBER
"A pattern IS NOT a Pattern until the breakout is completed. Before that moment it is just a bunch of colorful candlesticks on a chart of your watchlist"
═════════════════════════════
⚠ DISCLAIMER ⚠
Breakout Area, Target, Levels, each line drawn on this chart and any other content represent just The Art Of Charting’s personal opinion and it is posted purely for educational purposes. Therefore it must not be taken as a direct or indirect investing recommendations or advices. Entry Point, Initial Stop Loss and Targets depend on your personal and unique Trading Plan Tactics and Money Management rules, Any action taken upon these information is at your own risk.
═════════════════════════════
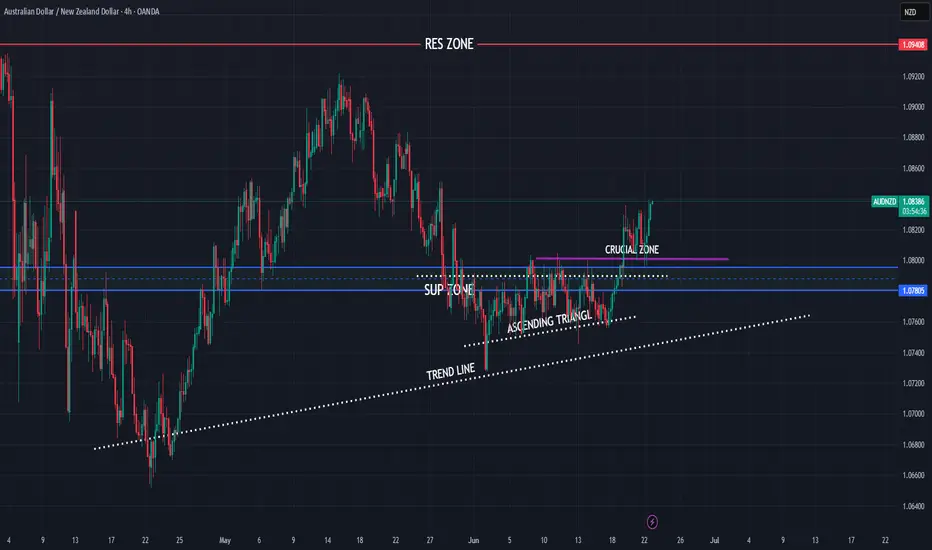
AUDNZD new bullish expected
OANDA:AUDNZD price on trend line, above is ASCENDING TRIANGL, currently is breaked, 1.08000 crucial zone breaked, price pushing strong bullish and technically how looks, its for expect still bullish.
SUP zone: 1.07950
RES zone: 1.09400
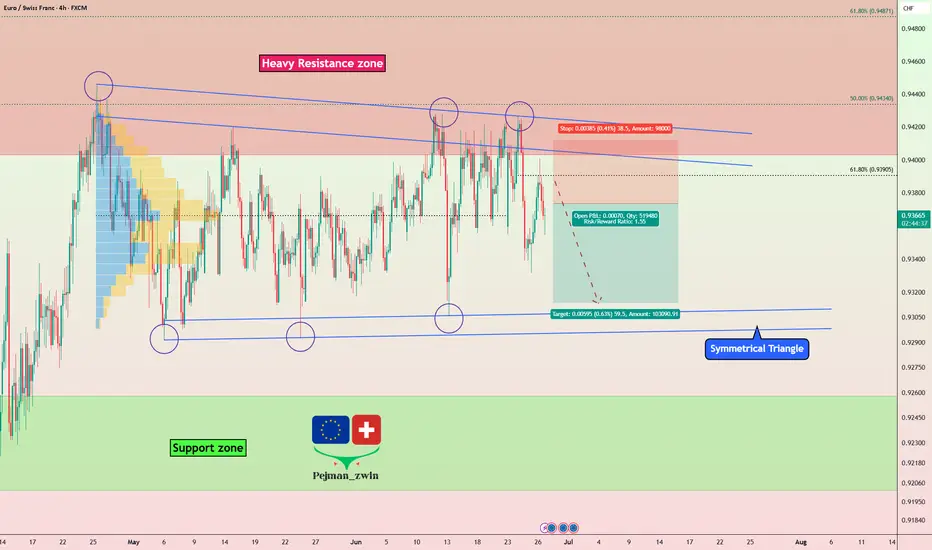
Symmetrical Triangle in EURCHF —Fundamental & Technical AnalysisToday, I want to examine the EURCHF ( FX:EURCHF ) Short position opportunity from both a Fundamental and Technical perspective.
First, let’s examine the EURCHF pair from a fundamental perspective:
The ECB’s dovish policy stance and weakening Eurozone data contrast sharply with the Swiss Franc’s safe-haven appeal and economic stability. With geopolitical tensions in the background, EURCHF may continue to slide lower, supporting short positions.
In terms of technical analysis , EURCHF is moving near a Heavy Resistance zone(0.967 CHF-0.940 CHF) .
In terms of Classical Technical Analysis , EURCHF is moving inside a Symmetrical Triangle Pattern . The point to note about this example is that every time EURCHF approaches the upper lines of the symmetrical triangle , it starts to decline with a lot of momentum . And considering the previous movement of EURCHF, which was bearish, it is better to look for short positions from inside the symmetrical triangle.
Based on the above explanation , I expect EURCHF to move back towards the lower lines of the symmetrical triangle pattern .
Note: Stop Loss(SL): 0.94120 CHF
Please respect each other's ideas and express them politely if you agree or disagree.
Euro/Swiss Franc Analyze (EURCHF), 4-hour time frame.
Be sure to follow the updated ideas.
Do not forget to put a Stop loss for your positions (For every position you want to open).
Please follow your strategy and updates; this is just my Idea, and I will gladly see your ideas in this post.
Please do not forget the ✅' like '✅ button 🙏😊 & Share it with your friends; thanks, and Trade safe.
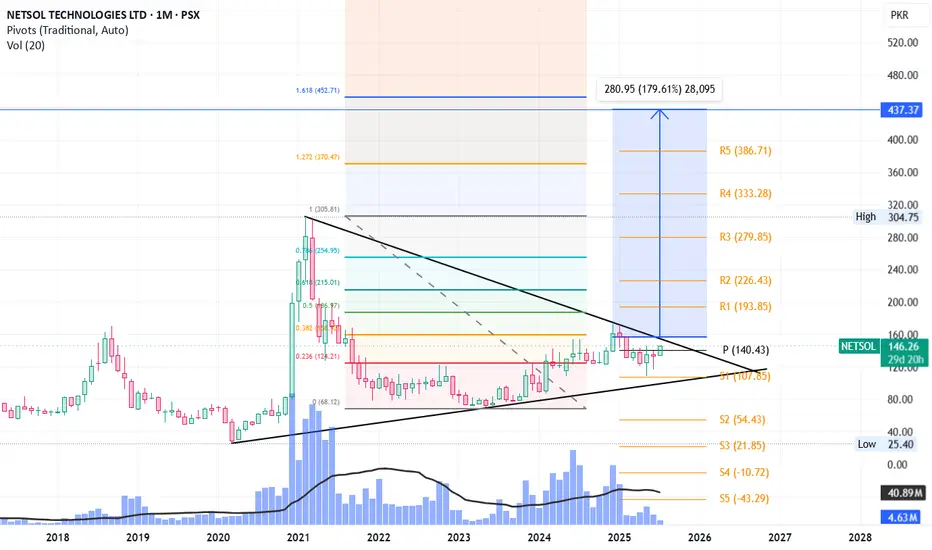
NETSOL Long term targetsLong term targets for NETSOL once it breaks out the triangle are listed in chart. You can take it either as Fib 1.618 or the price arrow top as your targets.
Bitcoin setup: bearish for now but watch Trump’s crypto deadlineBitcoin is sliding, and the technicals point lower with clear RSI divergence and a possible descending triangle. But this could all change fast. Trump’s crypto working group is set to propose major changes by 23 July. If the news points to deregulation or a return of ICOs, Bitcoin could explode higher. In this video, we break down the chart, the risks, and the potential trigger that could flip sentiment overnight.
This content is not directed to residents of the EU or UK. Any opinions, news, research, analyses, prices or other information contained on this website is provided as general market commentary and does not constitute investment advice. ThinkMarkets will not accept liability for any loss or damage including, without limitation, to any loss of profit which may arise directly or indirectly from use of or reliance on such information.

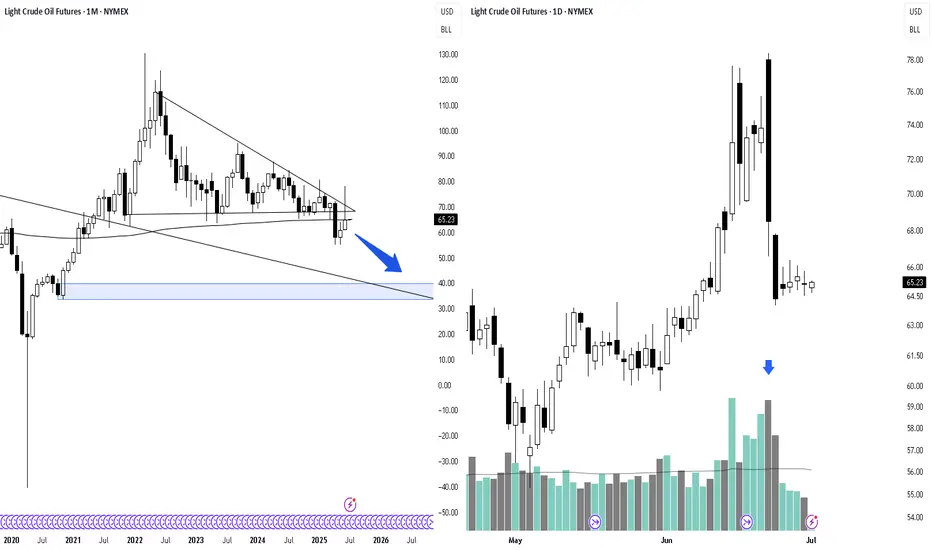
40–50% Decline Possible for Crude OilLight Crude Oil Futures broke below a descending triangle and re-tested the breakdown level on volume twice as high as the 50 day moving average (daily chart). I anticipate a 40–50% decline to approximately $30–40 over the next 6–12 months, despite geopolitical tensions in the Middle East. This move aligns with a broader macro correction. Long-term, I remain bullish on oil.
Gold. Path toward <3000. 1/July/2025XAUUSD, will gold reach ATH soon or below 3000 first?.. Based on cycle analysis and wave structure 50-50, make your own trading decision...