APP Earnings Triangle BreakoutWith APP breaking key resistance to the upside. There is a possibility for an aggressive move to the upside. This will NOT be a straight line up, but does show the possibility of the measured move. If I were to enter this, todays candle would be my entry and my stop loss would be an aggressive close back under the trendline.
Let's see what happens.
Trianglebreak

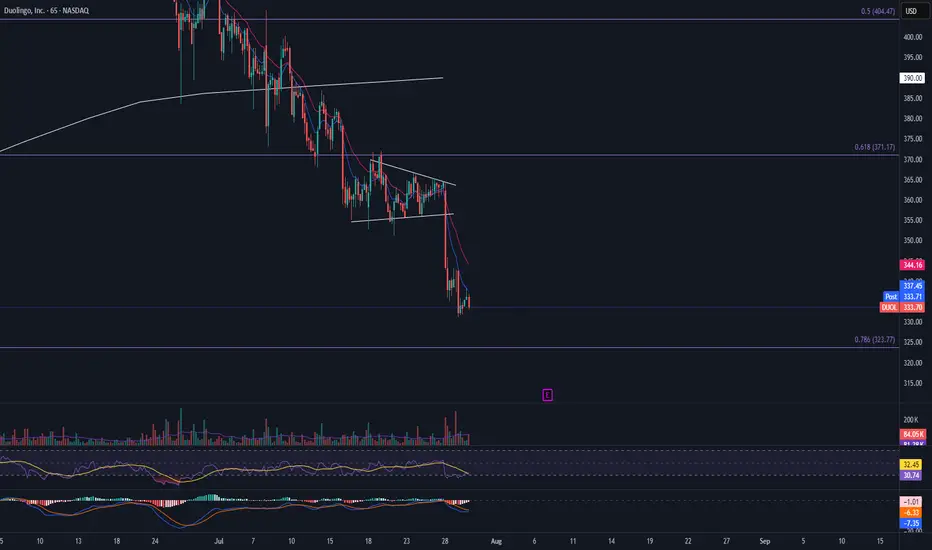
DUOL Bear Flag Break
DUOL has broken the bear flag down and continuing its move towards the 786 FIB level. I would want to see a bounce off this level and then a following close above the 9 EMA on the daily chart.
USDT.D | Macro Breakdown on the Horizon?From a monthly perspective, CRYPTOCAP:USDT.D is showing a textbook bearish descending triangle at the top — right after a decade-long uptrend. Price has repeatedly failed to break above resistance, forming a series of lower highs and consistent support.
Scenario:
If the support gives way and this pattern confirms, we could see a multi-year unwind, with the next major target down at 1.9–2.0%.
The first zone to watch for a reaction is around 3.7–3.8%, but the main macro demand sits much lower.
Why this matters:
A breakdown in USDT dominance typically coincides with a massive rotation into risk-on assets and altcoins — the end of a cycle in stablecoins often sparks the next big phase of the crypto bull market.
Plan:
Watch for confirmation of the breakdown on a monthly close below 3.7%.
Until then, this is just a setup — not a trigger.

JINDALSTELNSE:JINDALSTEL
Note :
1. One should go long with a Stop Loss, below the Trendline or the Previous Swing Low.
2. Risk :Reward ratio should be minimum 1:2.
3. Plan your trade as per the Money Management and Risk Appetite.
Disclaimer :
>You are responsible for your profits and loss.
>The idea shared here is purely for Educational purpose.
>Follow back, for more ideas and their notifications on your email.
>Support and Like incase the idea works for you.

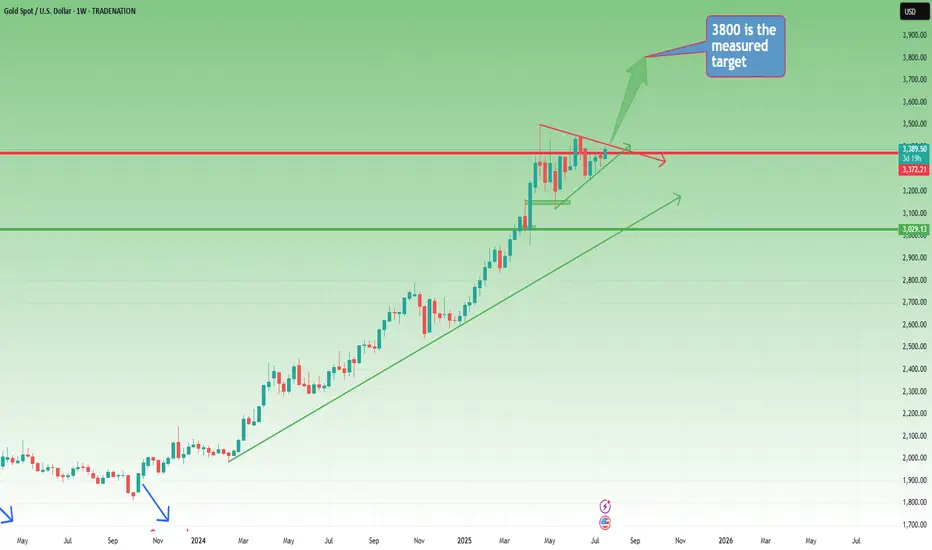
Weekly Outlook: Gold Builds Pressure – Is the Big Move Coming?📆 Big Picture View
Since the start of 2024, Gold has been moving in a well-defined long-term bullish trend.
Yes, there were meaningful pullbacks along the way — but the direction was never in doubt. Step by step, Gold climbed over 15,000 pips in just over a year, reaching a new all-time high in late April.
📉 Post-ATH: A Period of Stabilization
After peaking, Gold shifted into consolidation mode, with price gravitating around the 3300 zone.
This sideways movement has been ongoing for the past three months, but it’s not a sign of weakness — it’s the market catching its breath.
On the weekly chart, this consolidation is now forming a symmetrical triangle, a classic continuation pattern that often appears mid-trend.
📐 The Technical Setup
- The symmetrical triangle shows compression of volatility
- Buyers and sellers are slowly converging toward a decision point
- A breakout is approaching, and when it comes, it could be explosive
🎯 What’s the Trigger?
- A confirmed break above 3450 would validate the triangle breakout
- That opens the door to quickly test the 3500 round figure
- The measured target for the triangle sits at 3800
Given the time Gold has spent consolidating (3+ months), this target could realistically be reached by year’s end
🧭 Strategic Takeaway
- As long as Gold holds above 3300, the bullish structure remains valid
- Breakout above 3450 is the green light for the next leg up
- Until then, the consolidation continues, and smart money prepares
📌 Conclusion:
Gold is building pressure. The weekly triangle is maturing.
This isn’t the end — it’s the pause before the next move.
Stay patient. Stay focused.
Because if 3450 breaks… 3800 is not a dream — it’s a destination. 🚀
Disclosure: I am part of TradeNation's Influencer program and receive a monthly fee for using their TradingView charts in my analyses and educational articles.
P.S: Here you have a short term analysis on Gold
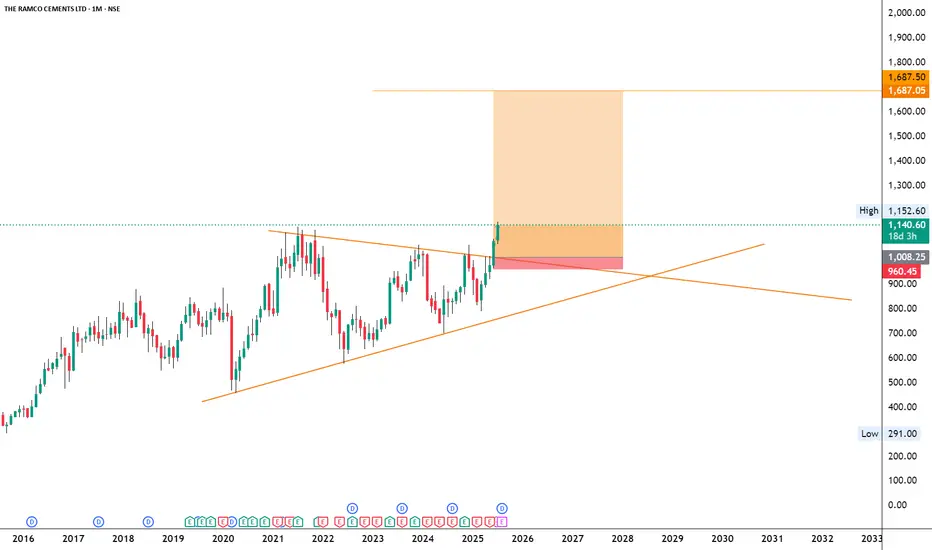
RAMCOCEM
NSE:RAMCOCEM
Note :
1. One should go long with a Stop Loss, below the Trendline or the Previous Swing Low.
2. Risk :Reward ratio should be minimum 1:2.
3. Plan your trade as per the Money Mangement and Risk Appetite.
Disclamier :
>You are responsible for your profits and loss.
>The idea shared here is purely for Educational purpose.
>Follow back, for more ideas and their notifications on your email.
>Support and Like incase the idea works for you.
Ethereum - This structure decides everything!Ethereum - CRYPTO:ETHUSD - trades at a key structure:
(click chart above to see the in depth analysis👆🏻)
After Ethereum retested the previous all time high in the end of 2024, we saw quite a harsh move lower. This move was followed by an expected recovery, however Ethereum is still trading below a key structure. Either move is still possible and will shape the future of Ethereum.
Levels to watch: $2.500, $4.000
Keep your long term vision!
Philip (BasicTrading)

Xrp - The expected rally of +50%!Xrp - CRYPTO:XRPUSD - is still clearly bullish:
(click chart above to see the in depth analysis👆🏻)
Ever since Xrp rallied more than +550% in the end of 2024, we have been witnessing a quite expected consolidation. However Xrp still remains rather bullish and can easily retest the previous all time highs again. Maybe, we will even see another parabolic triangle breakout.
Levels to watch: $3.0, $10.0
Keep your long term vision!
Philip (BasicTrading)

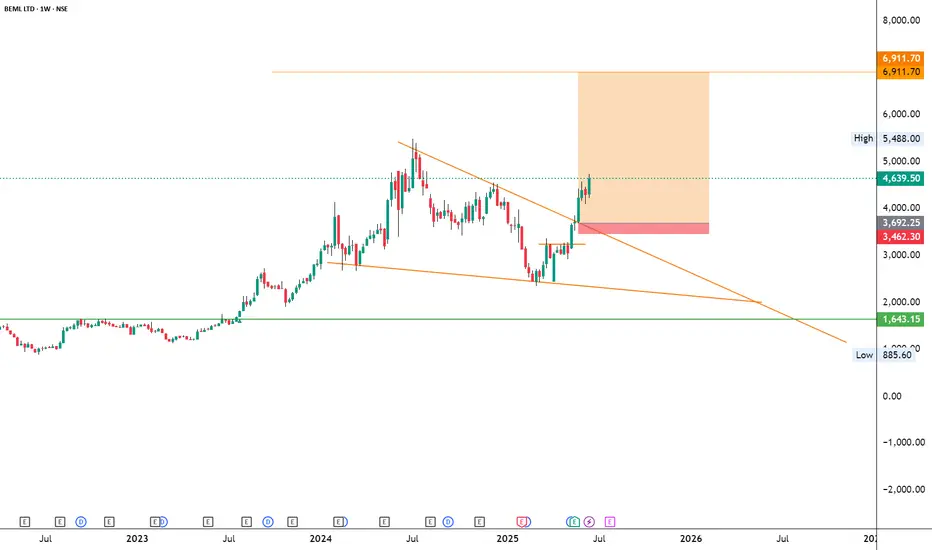
BEMLNSE:BEML
Note :
1. One should go long with a Stop Loss, below the Trendline or the Previous Swing Low.
2. Risk :Reward ratio should be minimum 1:2.
3. Plan your trade as per the Money Management and Risk Appetite.
Disclaimer :
>You are responsible for your profits and loss.
>The idea shared here is purely for Educational purpose.
>Follow back, for more ideas and their notifications on your email.
>Support and Like incase the idea works for you.
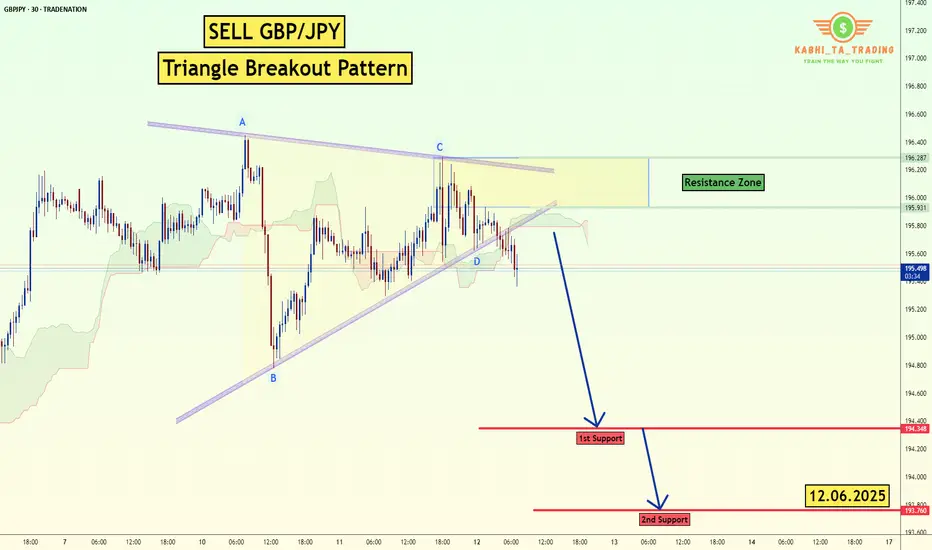
GBP/JPY - Triangle Breakout (12.06.2025)The GBP/JPY Pair on the M30 timeframe presents a Potential Selling Opportunity due to a recent Formation of a Triangle Breakout Pattern. This suggests a shift in momentum towards the downside in the coming hours.
Possible Short Trade:
Entry: Consider Entering A Short Position around Trendline Of The Pattern.
Target Levels:
1st Support – 194.34
2nd Support – 193.76
🎁 Please hit the like button and
🎁 Leave a comment to support for My Post !
Your likes and comments are incredibly motivating and will encourage me to share more analysis with you.
Best Regards, KABHI_TA_TRADING
Thank you.
Disclosure: I am part of Trade Nation's Influencer program and receive a monthly fee for using their TradingView charts in my analysis.
HARSHAHARSHA giving triangle breakout with decent volume. It is coming out of long 5 months consolidation. 400 seems good support. HARSHA may give momentum rally in nr future with resistance near 510.

Ethereum - The most important analysis for 2025!Ethereum - CRYPTO:ETHUSD - is clearly shifting bullish:
(click chart above to see the in depth analysis👆🏻)
After four years of trading, Ethereum is now sitting at the exact same level compared to mid 2021. However, Ethereum has been creating a significant triangle pattern and with the recent bullish price action, a breakout becomes more and more likely. Then, the sky is the limit.
Levels to watch: $4.000
Keep your long term vision!
Philip (BasicTrading)

Small Clues In A Big Breakout PatternSilver has been consolidating as of late and if there's one thing we no about contraction is that it eventually leads to expansion aka a breakout.
The issue with this particular setup is that based on location of the pattern, there's no predetermined directional bias for the breakout.
Therefor, what we're doing today is looking for small clues that the market has provided to give us any type of edge in predicting a breakout one way or another and guess what. WE FOUND SOME!
If you have any questions or comments, please leave them below!
Akil

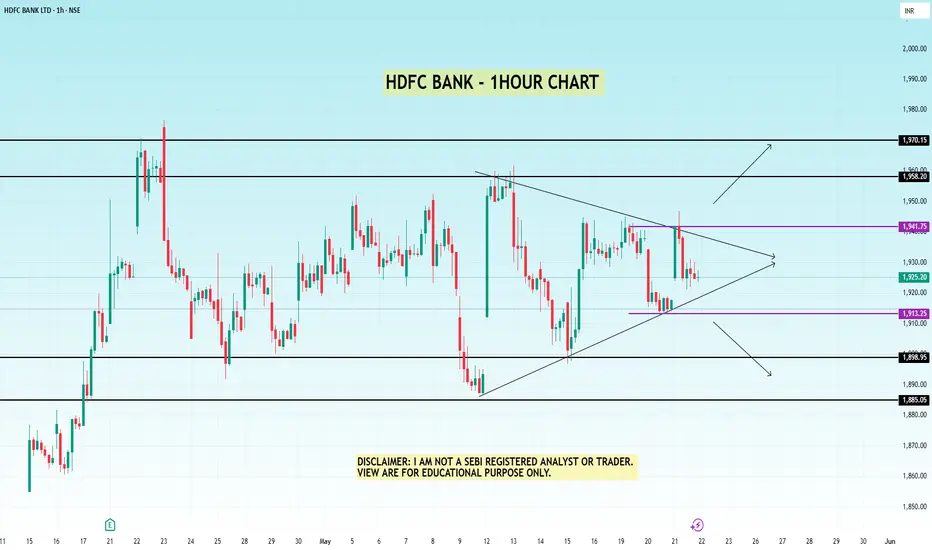
HDFC BANK ANALYSIS – 1H TIMEFRAMENSE:HDFCBANK
Symmetrical Triangle Pattern Forming
A breakout or breakdown is likely soon. Price is consolidating within the triangle range.
HDFC BANK ANALYSIS ON 1 HOUR TIME FRAME
IMPORTANT LEVELS TO WATCH:
Resistance: 1941 – 1958 – 1970
Support: 1913 – 1898 – 1885
📌 Chart Pattern: Price is forming a symmetrical triangle which indicates a potential breakout or breakdown.
A breakout above 1941.75 (purple line) can trigger a bullish move.
A breakdown below 1913.25 (purple line) can attract sellers.
📌 Wait for a breakout confirmation before entering a trade.
👉🏻 @thetradeforecast
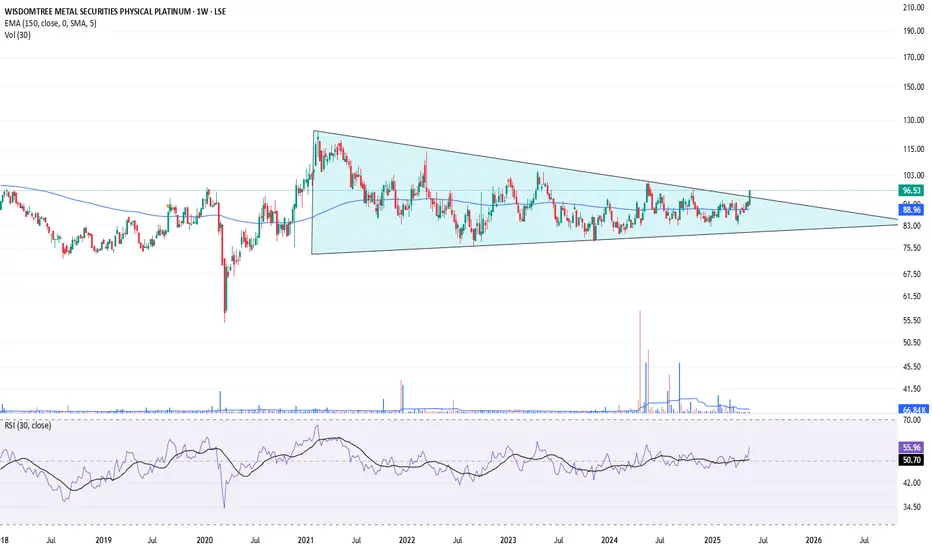
Is this a platinum breakout?Using a weekly chart of a platinum ETF.
Breaking out above it's triangle pattern. Needs confirmation though or retrace in the next coming months
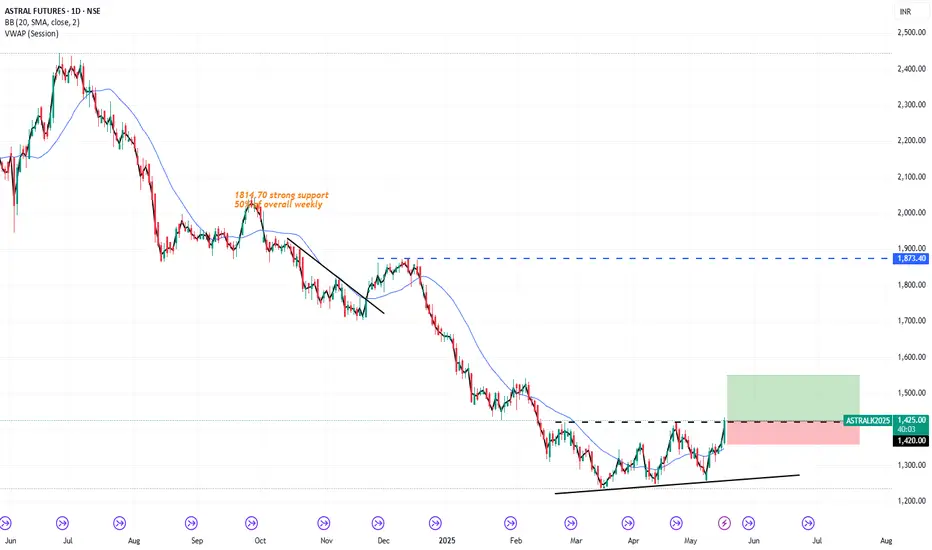
ASTRALAstral Fut broke above multiple resistance as well classic triangle break on daily charts with increase in OI & positive RSI & MACD.
Risk:Reward = 1:2
Could b bought with mentioned stoploss & target.
BTC Bull Flag Failure or UTAD? Apex Retest UnderwayBitcoin’s breakout from the bull flag was swiftly rejected after a wick above 105.8K, suggesting absorption and supply at the highs. Price has now fallen back into the flag apex — a red flag for continuation bulls.
Key Observations:
• Breakout was absorbed and rejected with no follow-through.
• Current price action is compressing inside the apex again.
• RSI dropped to 60.22 with weakening volume momentum.
• Support from mid-Bollinger Band (100.7K) and 55 SMA (100.5K) is now critical.
If price closes below this 100.5K–100.7K cluster with rising volume, the bull flag will be invalidated. This could evolve into a UTAD (Upthrust After Distribution) if the rejection confirms as a trap above resistance.
Watching for:
• Breakdown from structure (close below 100.5K)
• Rising sell volume
• RSI trending below 50
A close below these levels may mark the transition from re-accumulation to distribution.
⸻

Triangle Pattern BreakoutThe stock has broken Triangle Pattern and cup and cup and handle resistances with massive volumes. Buy at 227 with accumulation till 206. Target of 291/438. Use a risk reward of 1:4

Tesla - The Next 7 Days Decide Everything!Tesla ( NASDAQ:TSLA ) is sitting at a crucial structure:
Click chart above to see the detailed analysis👆🏻
Despite the -60% correction which we have been seeing over the past couple of months, Tesla still continuously validates its overall uptrend. That's exactly the reason for my strong bullish thesis and the assumption, that after we see bullish confirmation, Tesla will reject the current support area.
Levels to watch: $250, $400
Keep your long term vision,
Philip (BasicTrading)

Solana - Here Comes The Bullish Reversal!Solana ( CRYPTO:SOLUSD ) might head for new all time highs:
Click chart above to see the detailed analysis👆🏻
Just a couple of months ago, Solana perfectly retested the previous all time high and created an expected short term rejection. However, with the current major support area and a potential bullish reversal, Solana remains in a strong market, potentially heading for new all time highs.
Levels to watch: $120, $250
Keep your long term vision,
Philip (BasicTrading)

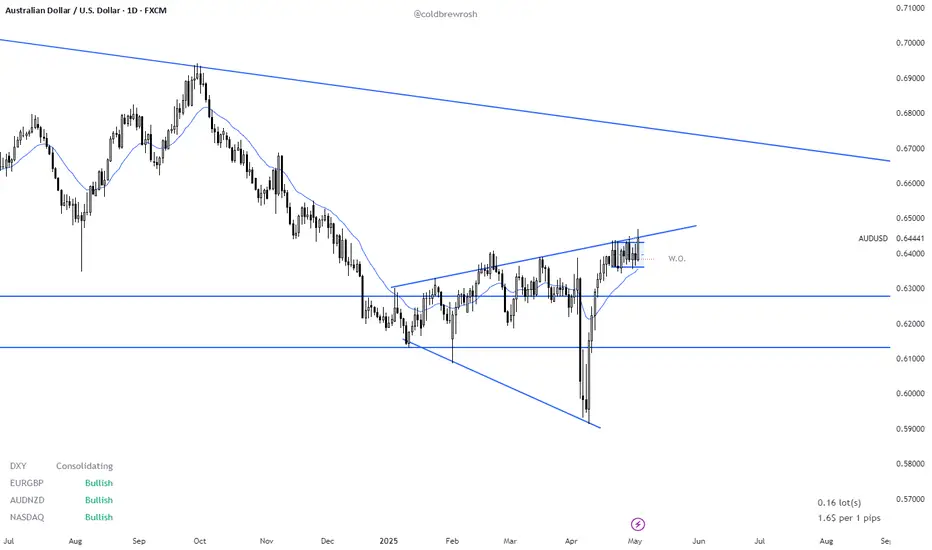
AUD/USD, Are Bull Set for a Breakout ?This analysis dates from the 3rd of May, this is in no way financial advice and should be taken into account in an objective way. Make your own opinion about it, don't take it for granted.
- AUD/USD is trading around the 0.64000 area on the daily chart, it has been consolidating around that area since April 21st following a 7 consecutive bull rally. Where it is heading to next still needs to be determined. Nevertheless, there is a clear Expanding Triangle dating since the start of 2025. (see image attached),(13th January, 03rd of Feb, 09th of April for the lower bar and 27 January, 20th Feb, 17th March, 23rd of April for the upside channel).
- This expanding triangle is similar to the one identified on NZD/USD which had an upside breakout and is now consolidating around the 0.59200.
- Whether there is an upcoming BO on Aussie Dollar is still TBT, but odds slightly favor the bulls following the strong rally in the first half of April. Nevertheless, it has been trading in a trading range since April 21st and there are no confirmed breakout yet. Needs to be closely watched in the coming days!! If bulls manage to get consecutive strong bull bars, this could set the stage for an measured move up for at a minimum a test of the 0.66000 area (downside channel from Feb 2021 to Nov 2024 on the Monthly).
- The Bear reversal case is harder to argue for, as they only managed to get one strong bear bar (04th April), with no follow through selling, The market has been trading for longer on the upper bracket of the extending triangle which means the market participant agree more on higher prices. Stay tuned for further updates !! Peace.
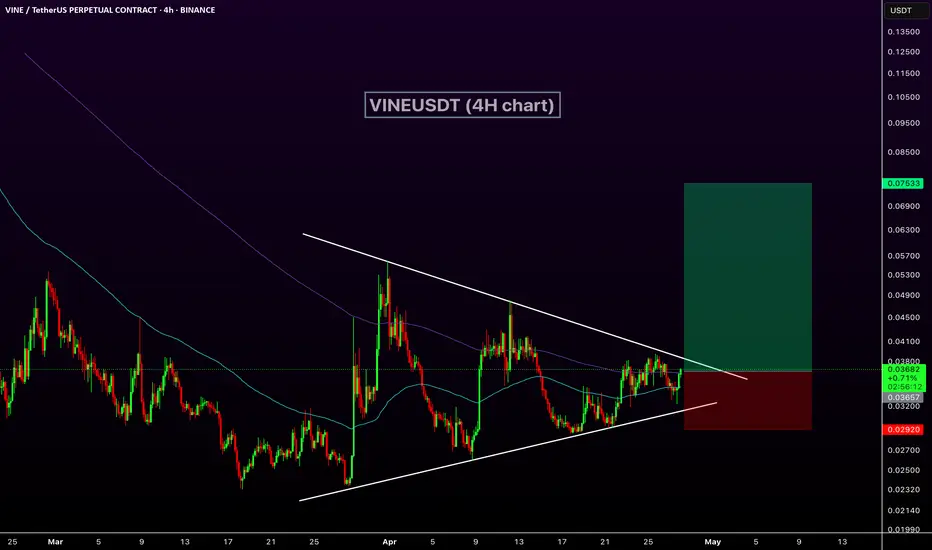
VINEUSDT Approaching Bullish BreakoutVINEUSDT Technical analysis update
VINE has formed a triangle pattern at the bottom, and the price is about to break the triangle resistance. The 100 and 200 EMA are also about to form a bullish crossover. A bullish confirmation will occur once the price breaks out of the triangle formation.
Xrp - Don't Underestimate The Bulls!Xrp ( CRYPTO:XRPUSD ) is bullish despite the recent drop:
Click chart above to see the detailed analysis👆🏻
Yes, we have been seeing a quite strong correction of about -50% on Xrp over the past couple of months. But no, this bullrun doesn't seem to be over yet but instead Xrp is creating a significant bullish break and retest formation. So if we get the bullish confirmation, we might see new highs.
Levels to watch: $1.8, $3.0
Keep your long term vision,
Philip (BasicTrading)
