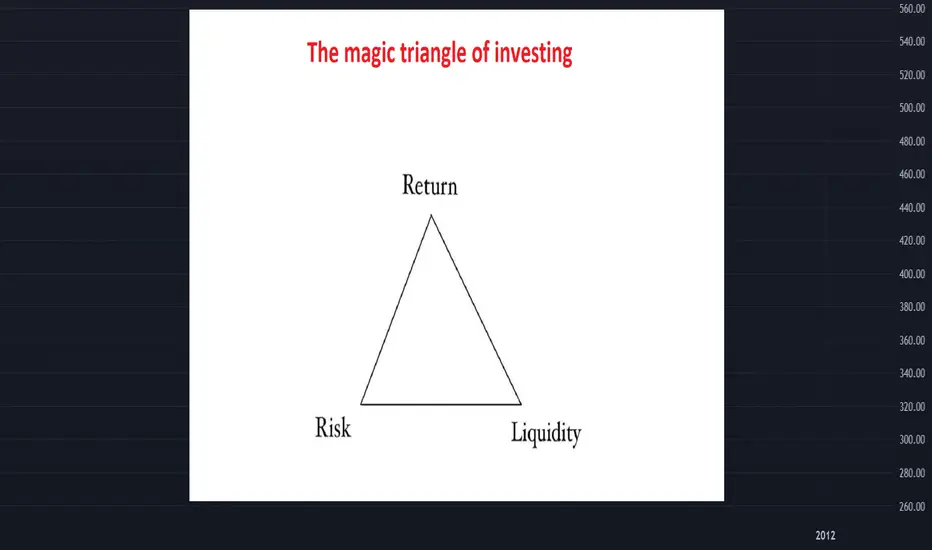
The magic triangle of investingIdeal investment instrument = highest return, lowest risk, highest liquidity.
Risk and uncertainty are an integral part of investment projects and are an important component of investment decision-making. In fact, the connection of return, risk and liquidity represents the magic of the triangle . More precisely, their combination is the result of trying to achieve the best result on one vertex, which results in a loss on another vertex. For example, the best result on all three peaks cannot be achieved simultaneously.
This is the basic principle of how investing works. Also, it is popular as the "alpha and omega" of investing. It consists of return, risk and liquidity - three factors that you should take into account in every investment in the financial market.
Return
The return is one of the three peaks that influence the investor whether to buy the given asset or not. Under income, we include all earnings of an investment from the moment we put funds into it and it lasts until the time of the last possible income from this investment.
Most investors seek to maximize return, given the potential risk and liquidity. However, investment return isn’t guaranteed in most stocks. It is also necessary to distinguish between historical (ex post-was or could have been achieved) and expected return.
Liquidity
The term liquidity refers to the speed with which we are able to exchange our investments back into cash at the lowest possible transaction costs. However, the degree of liquidity depends mainly on the financial instrument itself and the nature of the market. In fact, it is reasonable to know the degree of liquidity, especially when investing. Investors look for goods that are highly liquid, so that in case of a sudden price reduction, they can sell the goods before the prices hit the bottom.
For some types of assets, their liquidity is determined by contractual conditions such as the period of deposit in term deposits. Yet with most financial instruments, the degree of liquidity of the given financial instrument is conditioned by the demand and supply for it.
In addition, there is an opinion that the rate of return corresponds to the risk. Different instruments – different degrees of liquidity – in different markets. Highly liquid are foreign exchange markets, financial derivatives markets, and government bonds. For example, the most liquid assets are shares, where there is no problem of converting them into cash on the stock market without major losses. On the one hand, the least liquid assets appear to be the real estate which, in certain cases can even become non monetizable . This means that they have minimal, close to zero, liquidity. On the other hand, the higher the profitability of the object and location, the higher the demand for them and thus also their liquidity.
Therefore, every investor should consider the composition of assets with different liquidity when compiling an investment portfolio. Also, they should mind the fact that they keep a certain part of the funds as a financial reserve, whether in the form of cash or highly liquid assets.
Risk
Risk is a synonym for a certain degree of uncertainty related to expected returns. In other words, risk appears as the investor's danger that they won’t achieve the expected return. So, the actual return will be different from the expected one in the future and thus there will be a deviation from the expectation. In addition, risk represents a quantity that is difficult to quantify, as it is influenced by several factors, or their combination. Anyone who wants to invest should determine the maximum level of risk that they are willing to bear and forward. If there is no such thing as the ONE perfect investment, then the logical conclusion is: don't put all your available capital into one and the same investment. Therefore, diversification is the magic word. Those who combine several types of investment spread their risk and fulfill each of the criteria of the magic triangle in the addition of all investments.
Trianglebreak
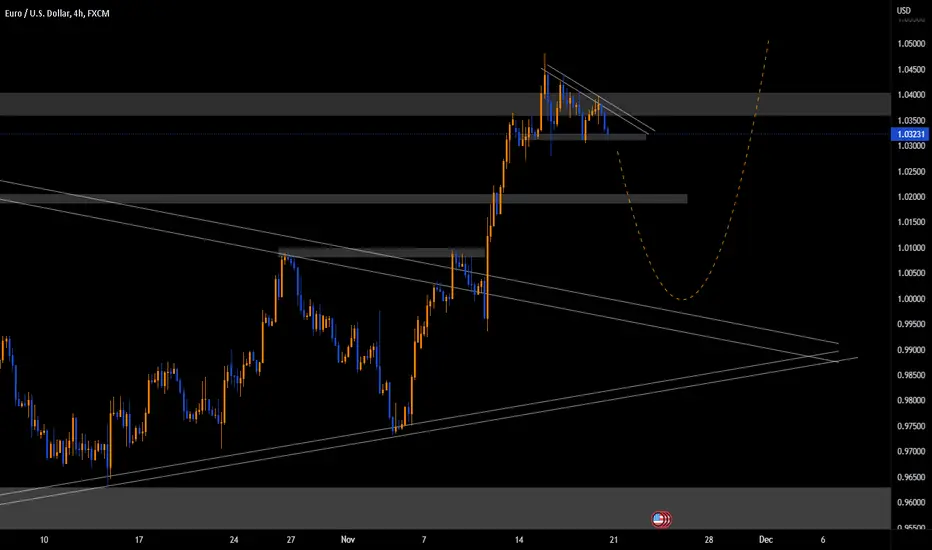
EURUSD SELL - Chart patterns | Technical AnalysisEURUSD has broken its bearish cycle and we are about to head into a strong general Bullish Trend.
As a day trader, The Daily, 4H, and 1H tend to be my go-to timeframes, and on these time frames, the market has broken to the upside, breaking through the trend, so a correction or retracement is imminent with the descending triangle acting as the pattern confirmation on the 4H.
The Formation of the BEARISH Triangle on the 4H timeframe shows the incoming of a Bearish short-time move for next week.
The PINBAR on the weekly time frame acts as a strong indicator for this to happen, I will watch out for the price action of the various support level that price might act on.
I will wait for a break and retest of price on the triangle to the downside to get into my sell come next week.
USDT.D Log ChartI think that the logarithmic channel triangle will be broken by the end of the year and we will probably see the growth of the market

Everything As Expected. Hi dear traders, hope you are surviving the current bloodish wave in the market. Since we have forecasted the movement in almost an accurate rate we did survive the overall negative hype on the week. So What's going on Bitcoin?
I am still bearish till something content-ful market impact took in place. For now, $12,200 area is the next strong resistance line if the current magnetic support lines at around $15,500 and $14,400 areas respectively are going to be breaking out.
This is just to drop my greetings and my current market sentiment perspective. I will be back bringing you a detailed analysis sooner or later on. Stay safe and be strictive on your trades till market gets some space to breath.

CEIX: Triangle breakout!Consol Energy
Intraday - We look to Buy at 68.04 (stop at 64.15)
Broken out of the triangle formation to the upside. This is positive for sentiment and the uptrend has potential to return. The measured move target is 79.00. Dip buying offers good risk/reward.
Our profit targets will be 78.87 and 85.00
Resistance: 79.00 / 85.00 / 90.00
Support: 68.00 / 58.00 / 40.00
Please be advised that the information presented on TradingView is provided to Vantage (‘Vantage Global Limited’, ‘we’) by a third-party provider (‘Signal Centre’) . Please be reminded that you are solely responsible for the trading decisions on your account. There is a very high degree of risk involved in trading. Any information and/or content is intended entirely for research, educational and informational purposes only and does not constitute investment or consultation advice or investment strategy. The information is not tailored to the investment needs of any specific person and therefore does not involve a consideration of any of the investment objectives, financial situation or needs of any viewer that may receive it. Kindly also note that past performance is not a reliable indicator of future results. Actual results may differ materially from those anticipated in forward-looking or past performance statements. We assume no liability as to the accuracy or completeness of any of the information and/or content provided herein and the Company cannot be held responsible for any omission, mistake nor for any loss or damage including without limitation to any loss of profit which may arise from reliance on any information supplied by Signal Centre.

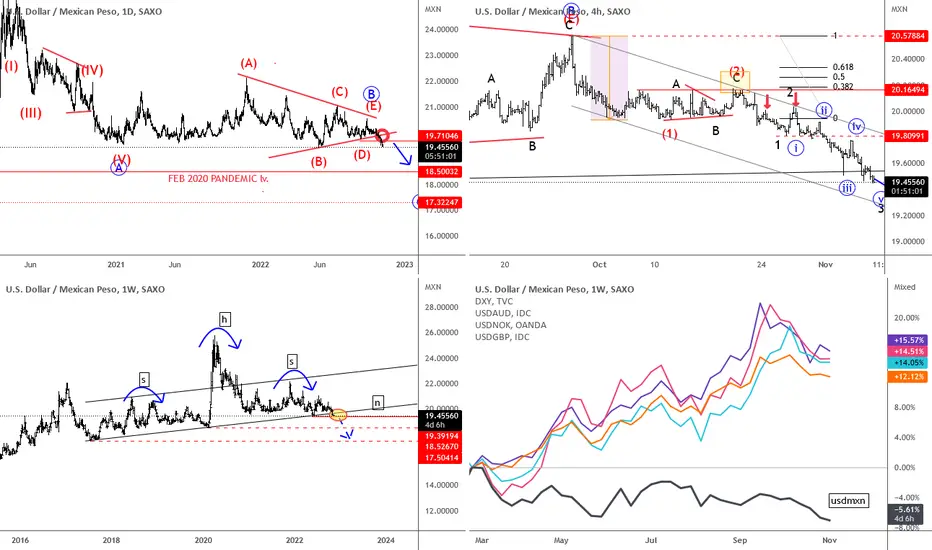
USDMXN is breaking the supportsUSDMXN remains bearish and it’s now in a sharp intraday decline aboutwe have been warning about in the past. We see pair now breaking the trendline support and its falling below the important 19.70 level. This may cause more more weakness as a higher degree bearish triangle can come to an end. In fact, MXN has been one of the strongest even when USD was up vs GBP, AUD and NOK. So if these are ready to gain, or at least make a pullback, then we think that USDMXN can easily come much lower. Check where USDMXN is despite DXY bull run in the last 12 months.
A bearish HS pattern also signals for more weakness on USDMXN.
Grega

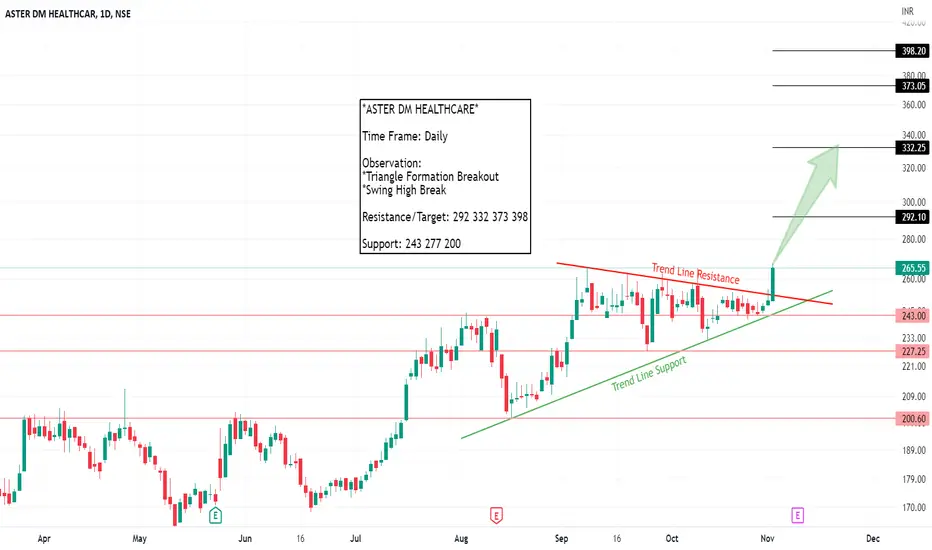
ASTER DM HEALTHCARE Triangle Formation Breakout*ASTER DM HEALTHCARE*
Time Frame: Daily
Observation:
*Triangle Formation Breakout
*Swing High Break
Resistance/Target: 292 332 373 398
Support: 243 277 200
Triangle BullishBest guess. My theory is, since its in a sideways trend, it will follow a triangle and soon bounce and break. Just a guess though.

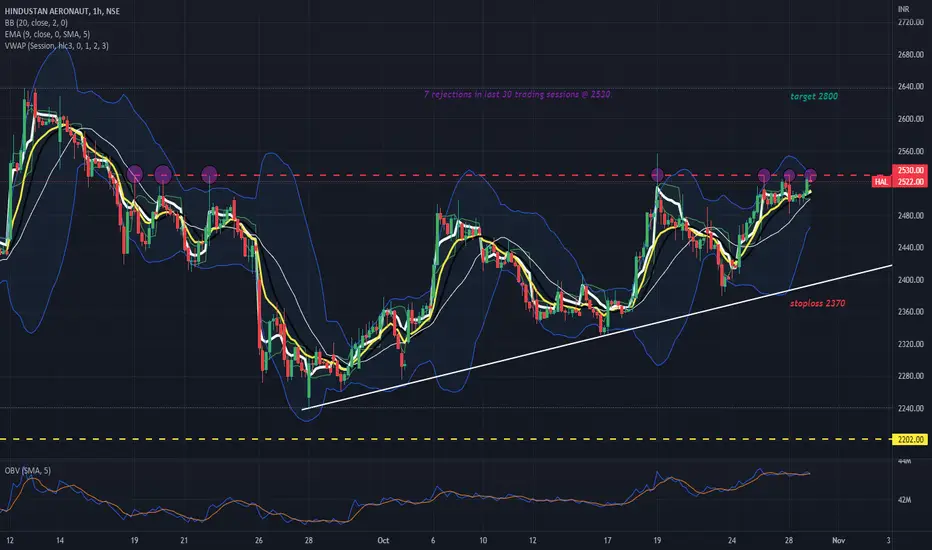
HAL - MoneyMakerHAL is on the verge of breaking out of ascending triangle, also at an level which got rejected 7 times in last 30 trading sessions, if it breaks above 2530 & sustains even for a minute then it ll skyrocket in no time.
Best thing about this trade is very good Risk:Reward Ratio.
Even if it opens gap up of 10-15 points buy without any hesistation with mentioned stoploss & target.
1321: EAST PIPES (TASI)Updated Values after Split on Oct 20th 2022
Breakout is observed
Series of HH, HL
Formation of HL (Retest)
Entry can be taken at current level (47.7)
Trade with SL,
Target Prices (fib levels) are mentioned, Ride the trend with trailing stop loss

EURUSD - Broken Symmetrical TriangleThe EURUSD price is in Symmetrical Triangle Pattern🧐
the Resistance Line is broken 🔥
so, i predict a bullish move 📈
TARGET: 1.01211🎯
...
if you agreed with this IDEA, please leave a LIKE, FOLLOW or COMMENT!

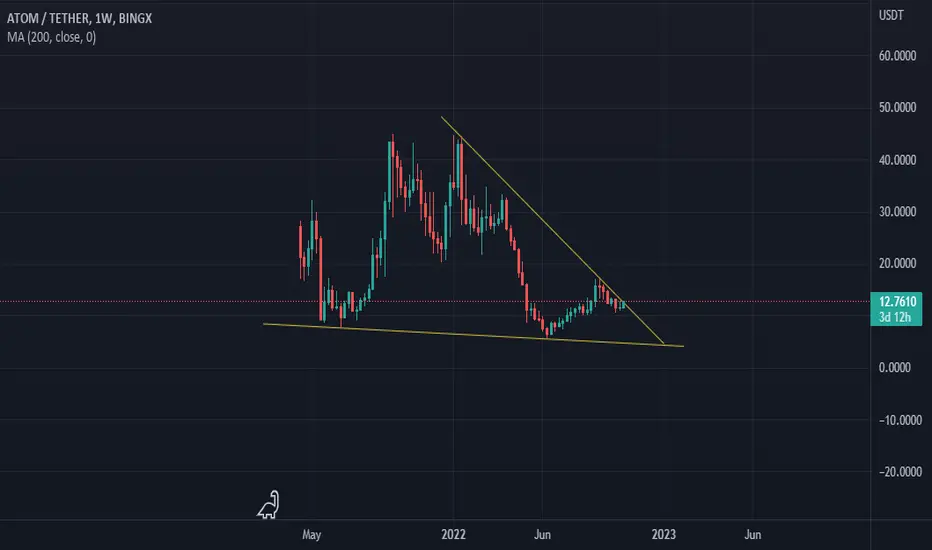
descending trianglea pure chart pattern on ATOMUSDT, its more clear on D1 TF, there you will monitor the breakout, also keep an eye on BTC performance aswell.
SFPUSDT +30% Triangle breakoutAs you can see, the price is already above the resistance. the coin is just waiting the bulls. What u guys think ?

GBPUSD bullish scenario (just an idea)One can count 5 waves in the ascending triangle which shows that we should be breaking out to the top of the ascending triangle. (Breakout to the other side, than the 5th wave has closed). We have already broken out of the triangle and are testing another resistance line at 1.1478 right now. If we can clearly get over that resistance the triangle breakout is probably not a fake out and we can aim for the height of the triangle entry. Still there is another resistance at 1.2285 that we have tested in the past.

BTCUSDT LONG PositionI think btcusdt will see the first and second goal
If it touches my target, I will risk-free the transaction and lighten the volume of the transaction
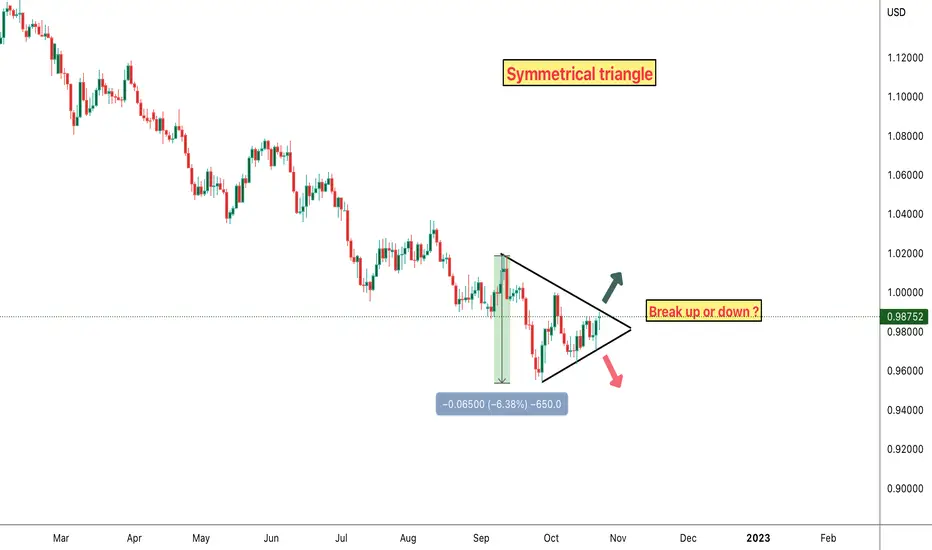
EUR/USD -25/10/2022-• Symmetrical triangle formation
• This pattern is usually a continuation pattern, which means the breakout occurs at the same direction of the preceding move, in this case a break down resulting in lower prices
• Sometimes, triangles can be reversal patterns
• Traders better wait for the breakout to confirm the direction and the validity of the move
• Price target follows the measurement method, which projects the height of the triangle from the breakout point
• The height of the triangle is 600 pips
• If the breakout occurs to the downside, target would be around 0.90
APT 20% CRASH , TRIANGLE PATTERNAfter apt pumping, will it reach the support and pump again? This is my thoughts for APTUSDT, what do you guys think?

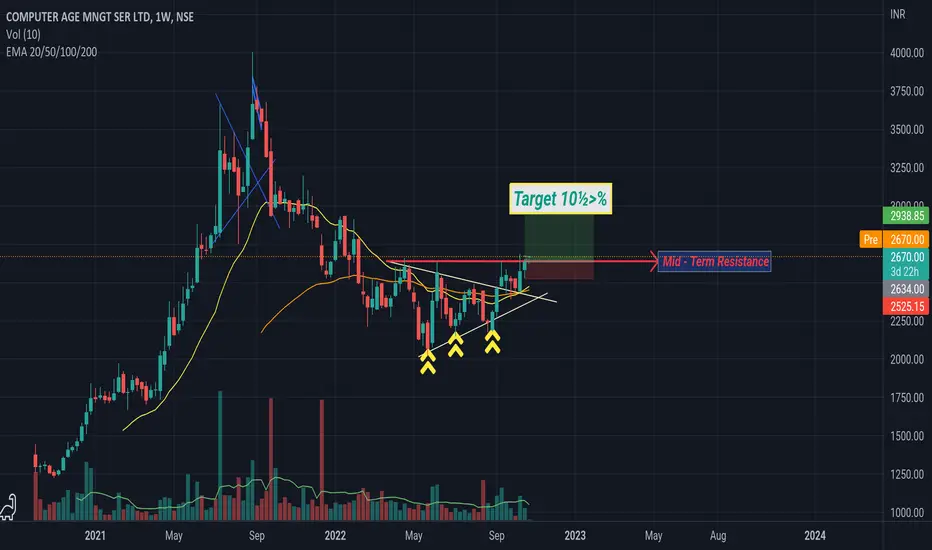
Triangle Pattern Breakout in 1 WTF!!!>Good Triangle Break -Out
>Wait for the Break-Out from Mid-Term Resistance
Diwali Pick ... Hold long term followed by the Momentum!!!
XRP analysis... short positionhello guys...
as you can see in my cryptocurrency charts i believe this market is bearish so far and continue downward movement until forming a strong and powerful reversal setup in high time frame like weekly or monthly!
this crypto currency (xrp or ripple) formed a ascending triangle and break bottom line strong and continue downward movement until reach to its target (i showed as green area) this green area is on MPL...
always do your own research.
If you have any questions, you can write it in comments below, and I will answer them.
And please don't forget to support this idea with your like and comment.

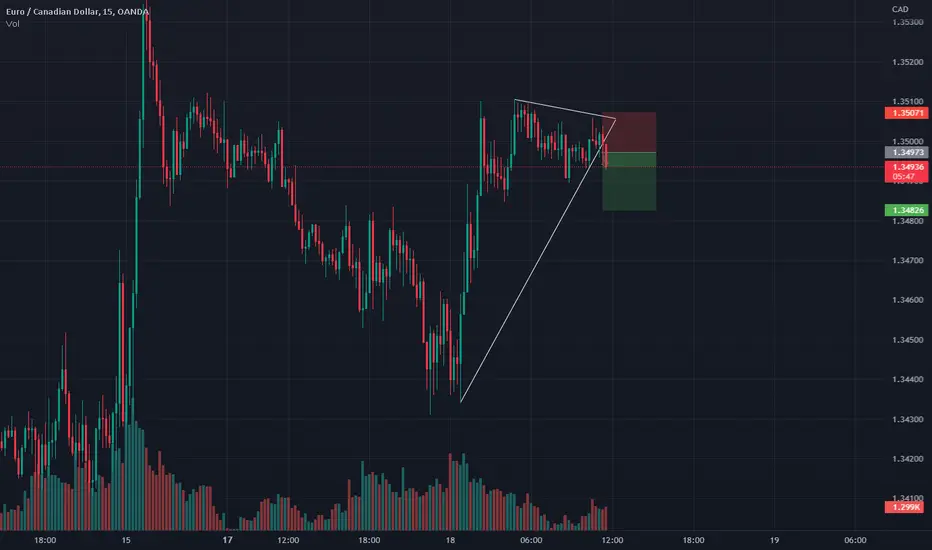
EURCAD Oct 18 - Triangle Support/Resistance Break - SELL Market trading inside triangle, broke and waited for a retest of structure then took a sell position on 5 minute chart for 1:5 RR
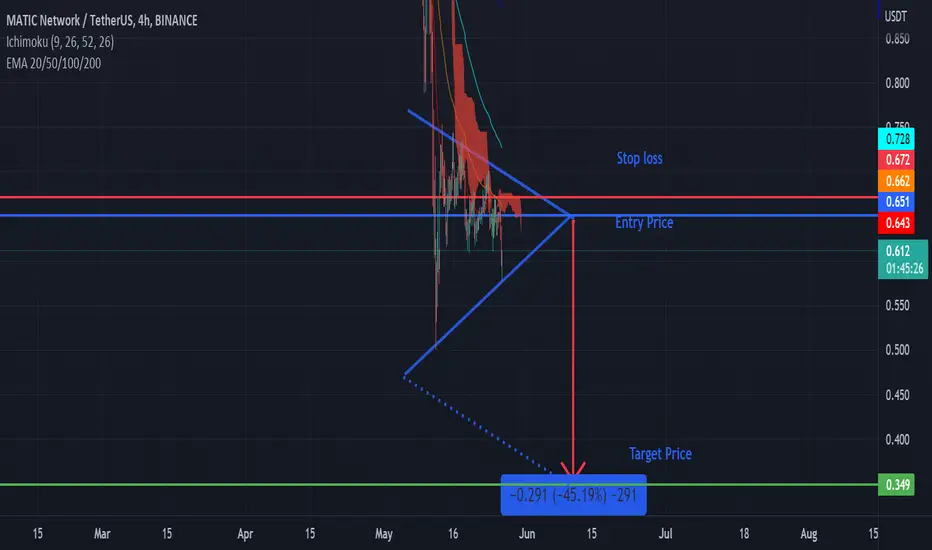
Symmetrical triangle on Matic/Polygon On Matic has there been a symmetrical pattern formed which shows a 50/50 of the price breaking to the upside of the downside. This said does the price trend show that the price is more likely to break to the downside as the market trend is bearish.
Entry price: In the apex at 0.65.
Stop loss: At 0.67, which is inside the triangle so when the triangle breaks to the downside but after the break to the downside starts trending upwards and is stopped by the stop loss.
Target price: Is extrapolated from the triangle height/the upper trend line and this target price set at 0.349.
This is also 45% gain if the prediction is successful.
ETHUSD - Triangle target front ran?Update on Ethereum from my last post.
ETH, along with the market is showing bullish strength after yesterday's dump. My target below was lower than what we got, swiftly reclaiming the range eq of the descending channel.
I'm fine getting front ran or my target not reaching - the idea was that we dump from the triangle, which we got.
I was however looking for a long entry on this dump and might have got front ran here, time will tell unless this level doesn't hold. Putting in potentially a nice retest of the market structure break almost across the board (BTC,ETH,Alts).
I need to see follow through soon on this move up if it's going to convince me of a rally, not yet 'bullified' personally.
Stay frosty!
V
