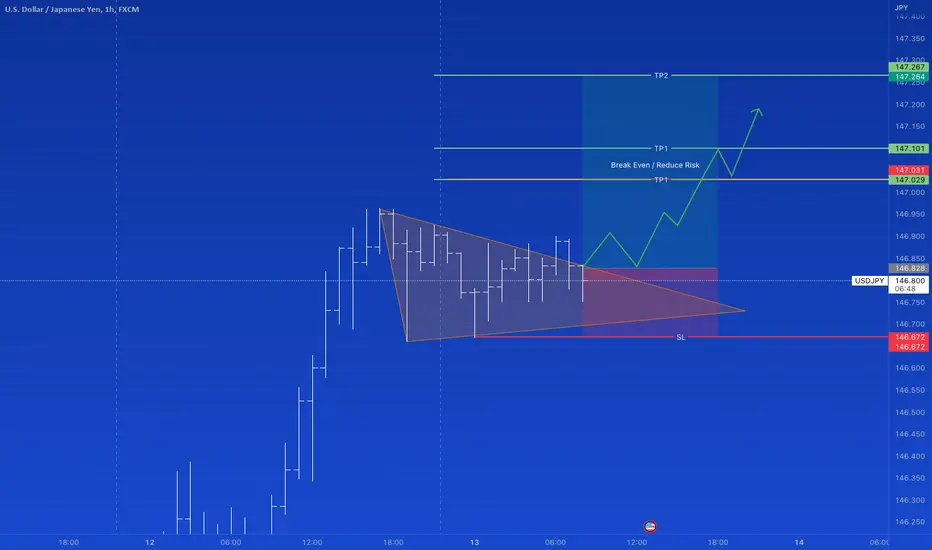
USDJPY H1 Triangle Continuation TradeLooking for the USDJPY to trade higher, but waiting for a breakout of the recent APAC session.
Price action is forming a triangle that is encouraging based on other higher time frame continuation patterns.
Depending on which time frame analysis you generate a trading idea, I am a firm believer that you should manage the trade in the same time frame.
Though if there is a chance of a higher time frame target being reached, after de-risking on the lower time frame, you could leave a runner.
Trianglebreak
XRP Potential bullish patternSome strong resistance showing inside the 4hr chart, with initial impulse to the top of the upper edge triangle, then into a consolidation phase, with hope for another impulse in the market.
Use the resistance lines as guidance on SL and TP.
Not financial advice, nor a concrete analysis. Merely a possible scenario following previous trends!

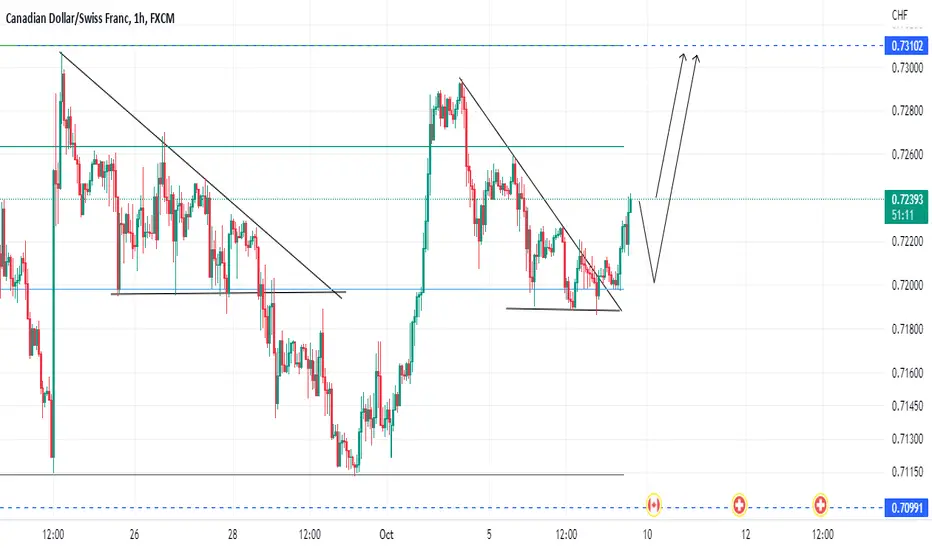
CAD/CHF (Buying Opportunity)Long Call on FX:CADCHF
Triangle break-out to the upside!
It might retest the fib. level and go for a bull move or can directly shoot at the targets.
You can open a half lot and if it retests you can open the other half at that time.
Trade your levels accordingly!
Best of Luck!
Your feedback would be appreciated!
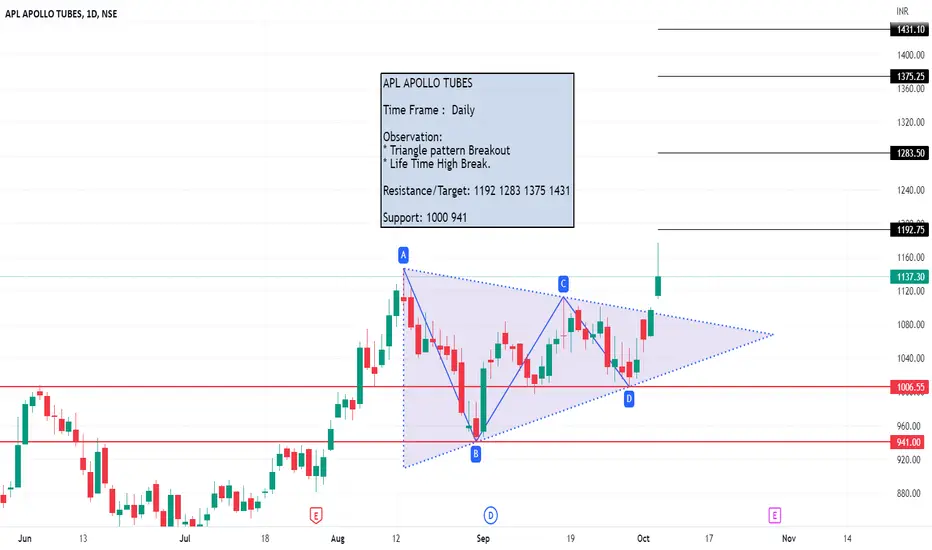
APL APOLLO TUBES Triangle pattern Breakout Life Time High Break.APL APOLLO TUBES
Time Frame : Daily
Observation:
* Triangle pattern Breakout
* Life Time High Break.
Resistance/Target: 1192 1283 1375 1431
Support: 1000 941
📈✌Cardano Daily Long Position: Spot✌📉BINANCE:ADAUSDT
COINBASE:ADAUSD
💥Triangle pattern💥
First, please take a look at my previous analysis and positions.
between now and the red area, you can open a long position in two steps.
If the price rises and reaches the risk-free level, you can risk-free the position.
TP1-2-3 are on the chart.
The optimum stop-loss is below the determined area.
Please share ideas and leave a comment,
let me know what's your idea.
CrazyS✌

DOGEUSDTSTOPLOSS IS MUST
HOPE YOU LIKE MY SIGNALS SHARE WITH FRIENDS WITH STOPLOSS
PAIR DOGE
LETS HIT THE TARGET
Control your emotion if you are trader

TWTR: Most important key points to keep in mind!• It seems TWTR is inside an Ascending Triangle chart pattern, between the purple trend line which connects the previous bottoms since July 12, and the black line at $44.57 which worked as support/resistance multiple times in the past;
• To whatever side TWTR breaks, it’ll probably do a strong movement in sequence;
• By doing an upwards breakout, the target would be the next resistance at $51.19. By losing the trend line, the next support at $38.07 would be the next stop;
• What could frustrate this pattern? Usually, triangles are frustrated when we see sideways breakout, as this ruins any future momentum. Therefore, it is important to see a reaction on TWTR as soon as possible.
I’ll keep you guys updated on this. Remember to follow me for more analysis like this! Keep in touch.

XLMUSD forming triangle pattern, growth after bullish breakoutXLMUSD
price is forming a triangle like structure, if price manages to break above the triangle and if price holds above the structure, I expect the price to move higher towards next resistance. if price breaks below the support area the the setup will be invalidated
Trade Wisely
*The content on this analysis is subject to change at any time without notice, and is provided for the sole purpose of assisting traders to make independent investment decisions.

symmetrical trianglesymmetrical triangle is formed . breakout of this triangle can trigger bulls or bear . trade according to ur risk levels
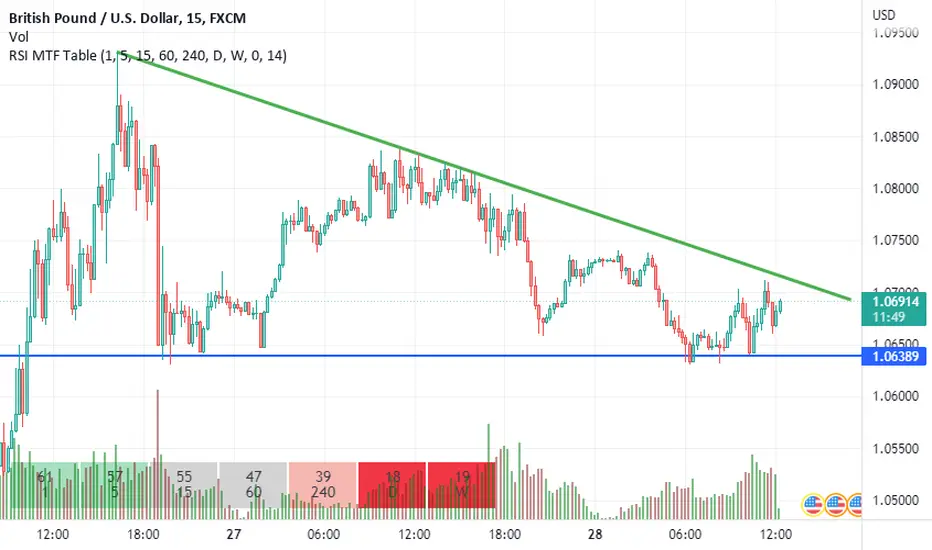
GBPUSD Today Support & Resistance Analysis...watch outtoday analysis for GBPUSD can help a lot...be careful of your positions and setups...if this triangle breaks up, u can go long and set your stop loss a few under the support line and take your profit as soon as possible...
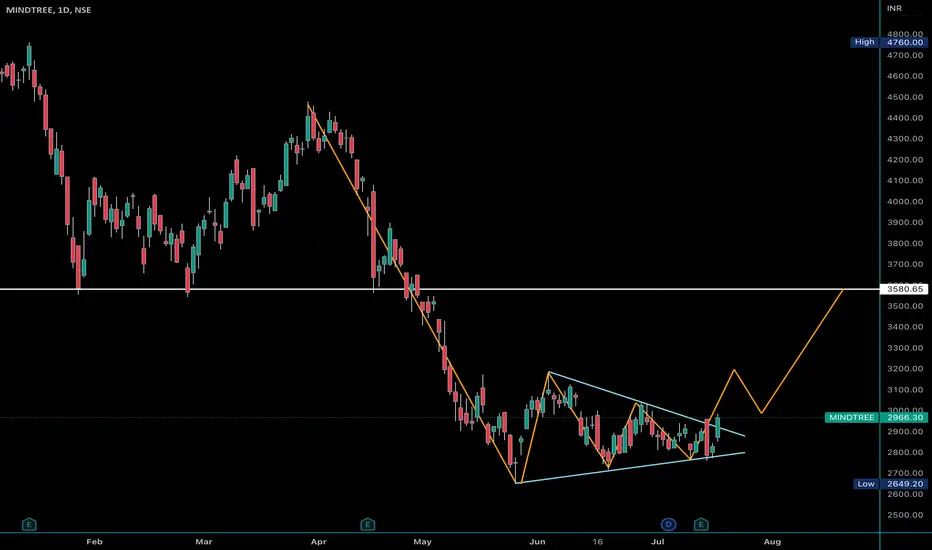
Mindtree short-term uptrendMindtree is in short-term uptrend, now it has broken the triangle pattern, for correction and triangle target it has to go up more
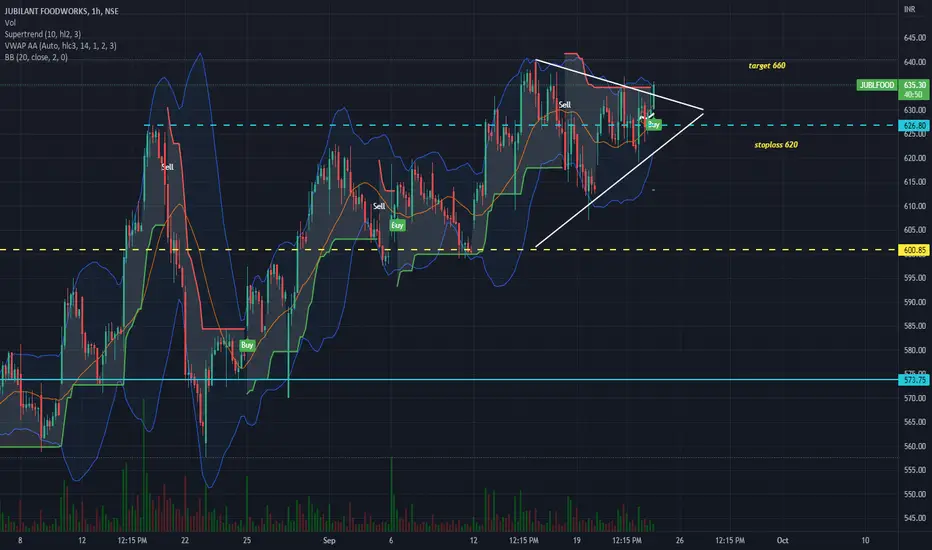
jubfoodJubilant Food broke out of triangle pattern with good volumes.
Could be bought with mentioned stoploss & targets.
Triangle Formation on EtheriumA distribution zone (triangle formation) appeared on Ethereum. It has a higher chance break down.
Important Fibonacci Levels:
-1000
-1220
-1400
-1520
-1640
-1780

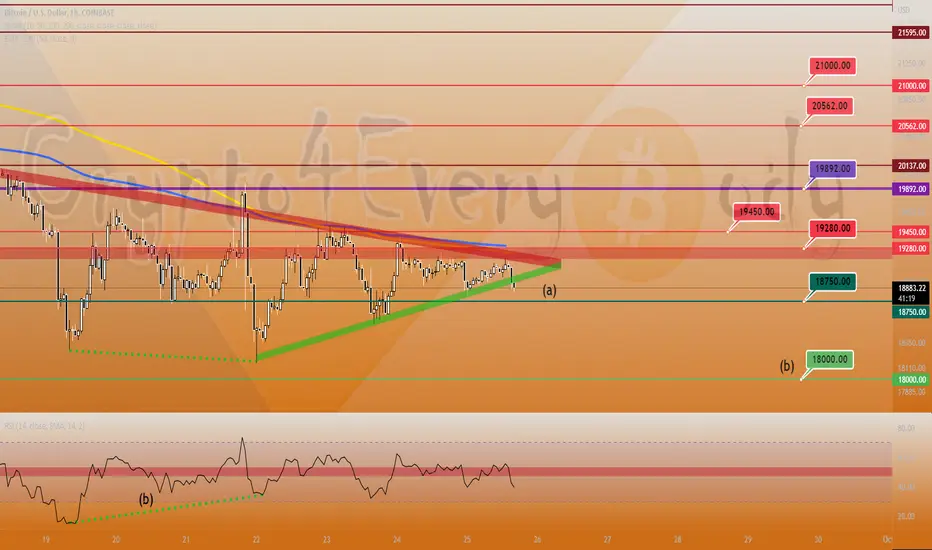
Bitcoin short-term view - possible triangle breakout 🚨Bitcoin short-term view
(a) BTC with a possible triangle breakout 🚨
(b) if $18,750 breaks next support at $18,000
Chance for fakeout given dear Crypto Nation
*not financial advice
do your own research before investing
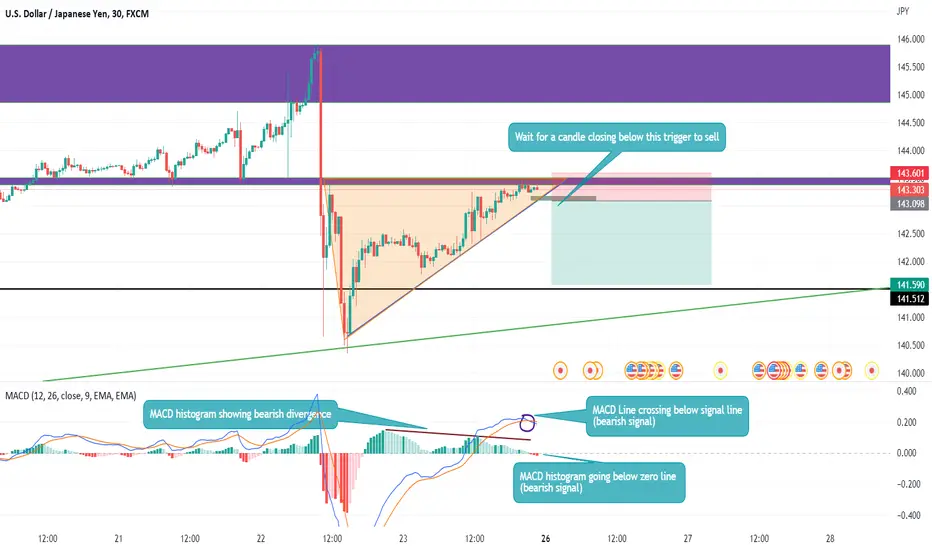
USDJPY short termAfter the big fall of USDJPY last week, we can predict a shift in momentum and search for sell opportunities.
On short term, MACD is showing bearish signals,
Good luck everyone,
Joe.
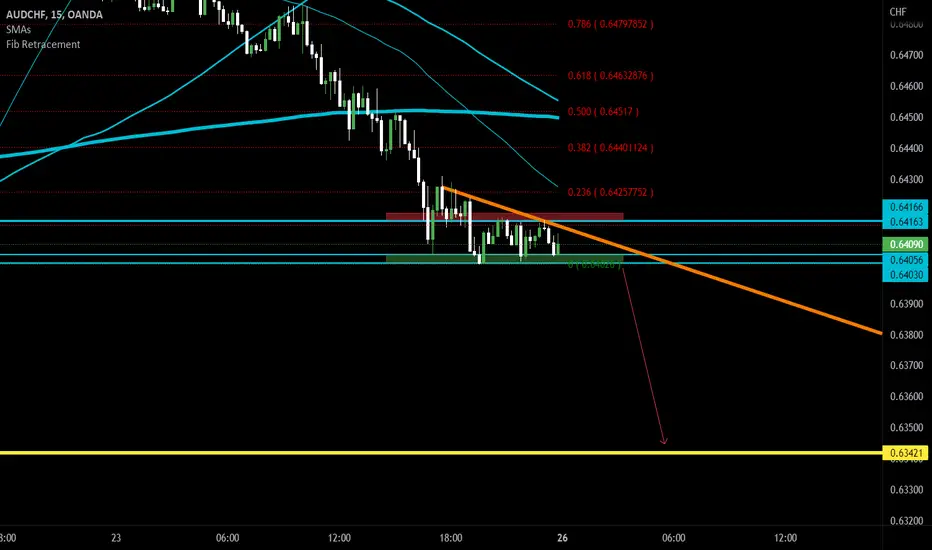
AUDCHF bearish 15m view..AUDCHF is runing in overall down trend ... nice triangle formation below fibo 0.23 and MA 200/100/50 with respection of the trend line ...go with short trade with breaking the pattern (0.64030 level) up to 0.63421 level....be safe...
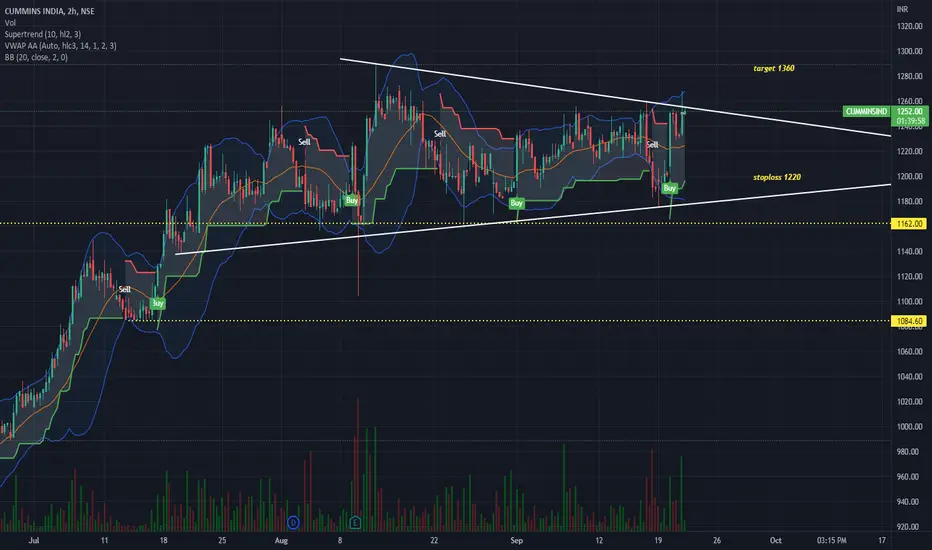
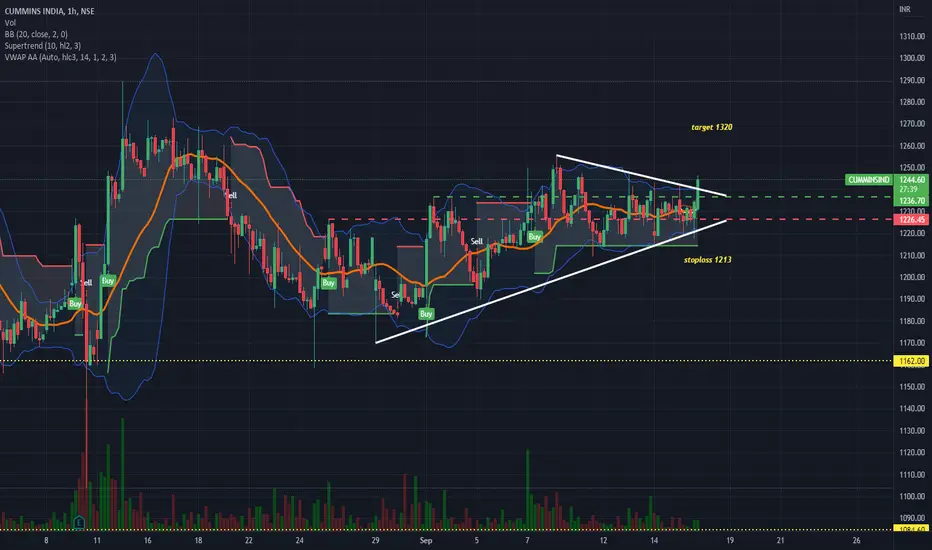
Cummins IndiaCummins India about break triangle pattern on hourly charts with very good volumes.
Could be bought with mentioned stoploss & target.
ADA Getting Squeezed. ADA is in an accumulation zone(triangle formation) it will pump soon. Based on the momentum, it will go down, but the market is bearish, so we are going to see.
Important Fibonacci Levels:
-0,400
-0,600
-0,720
-0,820
-0,920
-1,050
-1,230

STAR HEALTH giving BULLISH signshey guys
STAR HEALTH stock was moving in a pattern called
TRIANGLE PATTERN
this stock has tried to cross this pattern
but it has failed everytime ,
But now I think that this stock will break this pattern
BECAUSE
1. A TWEEZERS FORMATION
2. 20 DAY EMA IS ABOVE THE 50 DAY EMA
3. A BIG GREEN CANDLE IS MADE
due to these reasons ,
this stock is good for trade
and can give you high rewards
😀

ACCACC is set for something big, made triangle on weekly chart & trading above breakout & trading above all multiple resistance zones.
Could be bought with mentioned stoploss & targets.

Cummins IndiaCummins broke out of triangle pattern with good volumes on an hourly charts.
Could be bought wih mentioned stoploss & targets.
$QQQ - uh oh, Price fell out of triangle. Avoid price battle.If you watch price on QQQ or SPY, you will see a strong price battle going on between buyers and sellers. Daily timeframe, the question of course is whether PPI tomorrow causes another gap down or a reversal back up towards upper resistance line.
RSI and stochastic do not provide a reliable directional signal right now; all the more reason for caution in your trades.