jubfoodJubfood made triangle on hourly charts with above average volumes.
Could be bought with mentioned stoploss & target.
Trianglepattren

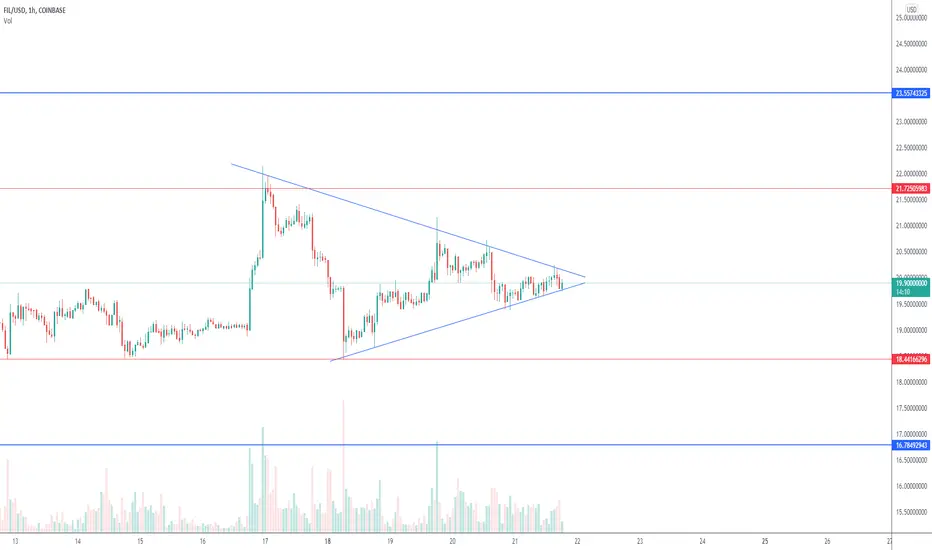
FIL/USDT symmetrical triangleFIL/USDT pair is forming lower highs and higher lows following two sloping trend lines that eventually intersect. We expect that breakout can be in any direction.
To determine take profit(TP) zones we can apply the measurement rule for symmetrical triangles: compute the formation height from highest high to lowest low and add to or subtract the difference from breakout price depending on the breakout direction.
This time we have support zones near expected price goals (in an upward direction 21,7/23,5 and in a downward direction - 16.8/18,45) so we can set up our TP zones in that support/resistance zones.
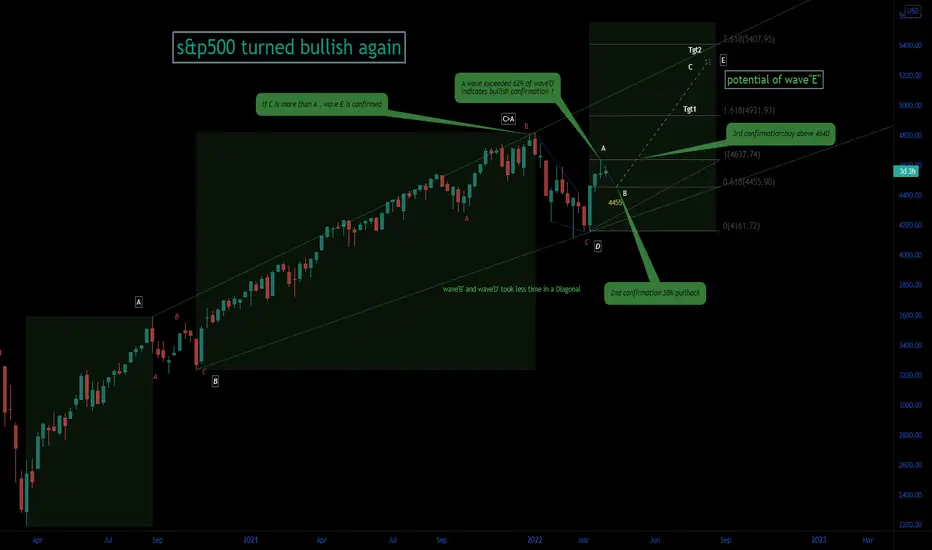
S&P500 turned bullish A good trader has to adopt for the change in trading environment.
the so long correction in s&p500 index is in a wedge shaped and now broke-out with 5 waves.
the 1st confirmation for bullishness (formation of wave''E'') is set as this BO (5waves)exceeded 62% of wave 'D'.
wait for 2nd confirmation ,a pullback up to 38% of new wave 'A '(4455)this week (FED int rate will be a surprise),buy above 4640 (3rd confirmation)
IF all set, the S&P500 rocket will climb to reach its targets (4930,5400)during this earning season
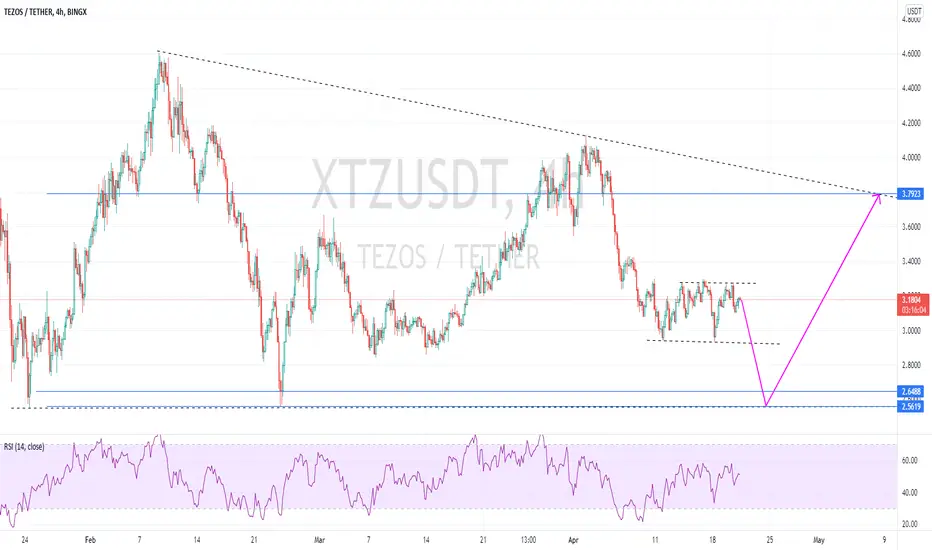
$XTZUSD - Following this scenarioHello everyone!
Tezos is inside this triangle pattern, There is a high chance that XTZUSD will drop to 2.65 - 2.56 areas and bounce back to 3.79.
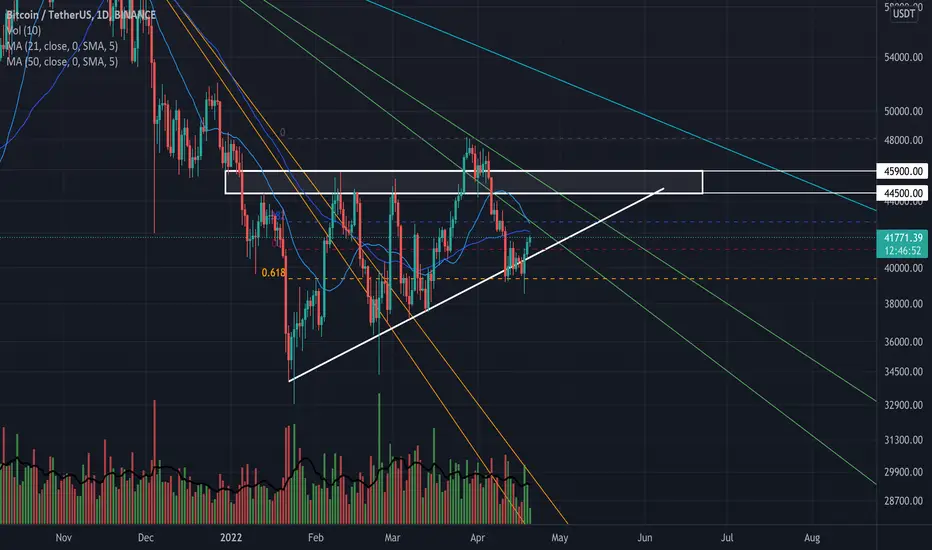
BTC/USDTFirst went long at $39.600, then bought some more at $41.180 (kinda nailed the retracement). Current average price is §40.390, so were in small profit at this point, around 3.3%. As long as we can stay above the diagonal support trendline oft he ascending triangle I am bullish on BTC. It looks to me as if we have gained supprt at the trendline together with the fibonacci golden pocket. As long as we can stay above the trendline I will continue to DCA into bitcoin and possibly some Altcoins.
If we brake the triangle to the upside I expect price targets at around $52.000 up to $56.000, that is also the prince range where I would start to sell my positions. This would also be de 0.618 retracement of the 1D downtrend from $69.000 to $32.000 and the 0.782 fibonacci speed fan. Remember though, I am a beginning analyst and I am never a 100% sure, but the way I understood the concept of Speed Fans according to John J. Murphy, the break of the second Speed Line ( 0,618 - 0,666 in my case ) would be a massive bullish sign since it indicates a confirmation of a trend reversal.
I wil keep this one updated since it it leading to me. I will use the data of this chart to determine whether it is a good time to buy some altcoins.
Feel free to give feedback!
Feel free to shill the next 100x to me!
PS: I still have room for 1 or 2 altcoins during booming season, so feel free to share some good projects. I will share 10% profit with you if it plays out.
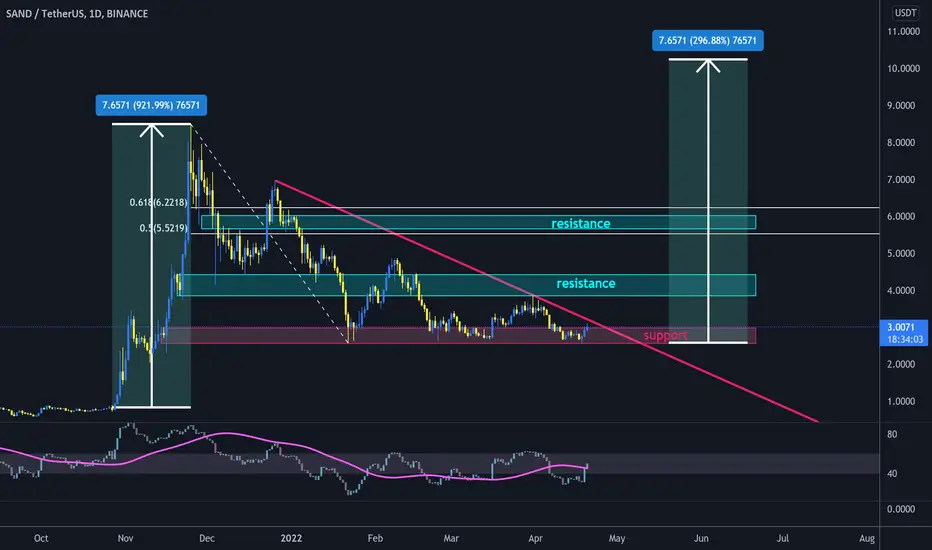
SAND near to break out triangle#SAND/USDT
$SAND hold the lower line of triangle, and price is below upper line of this pattern.
🐮 break out from upper line of triangle will head up price to resistance zone between 0.5 and 0.618 fib levels and potential to reach $10 in mid term.
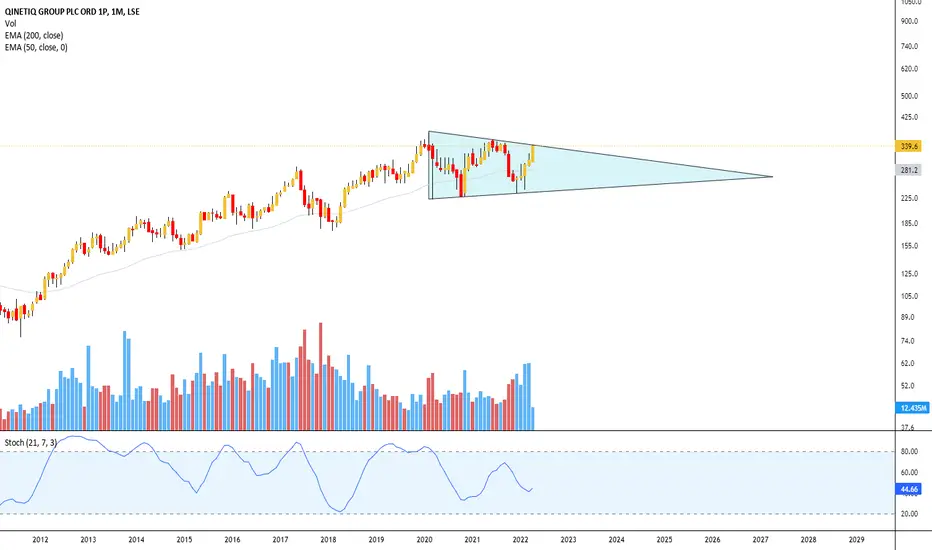
Quinetiq - Will it break out?Forming a bullish pennant/triangle, and looking as it it will break to the upside early on in its formation. Wait and see.
NOTE: This is not a recommendation to buy, sell or hold
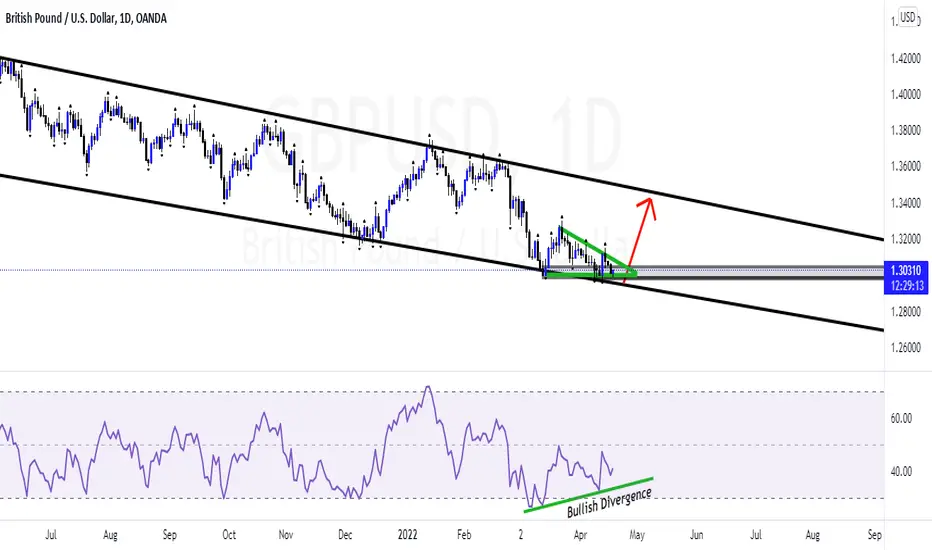
GBPUSD Daily AnalysisPrice creating double bottom at bottom of the channel.
Bullish Divergence.
Small triangle pattern within channel. Expecting breakout to top of channel next few weeks (long term).
XTZ (TEZOS) ANALYSIS UPDATEGood analysis is not the one that is perfect but the one that has numerous backup plans to reduce probability to the minimal.
Following XTZ for the past few days we have 4 different pattern in place the up trendline which failed along the line, the Wolfe pattern which was truncated, the ascending triangle which as well failed (got me remembering the old time rule which says never risk more that 2% of your portfolio on triangles), and finally, the rectangle pattern!.
Now its heading towards resistance of the rectangle. if price closes above the rectangle with volume then go long else, watchout it could still go back to it origin.

BTCUSD: Next step after breakoutHello traders!
Today BTC showed a move that we were expecting from it. The market dipped and broke the pattern and touched true reversal point, I was expecting a pinpoint accurate reversal from 38786 but it dipped lower than that and that's not a good sign.
Now we have to take action according to reaction, it's only because it was not a pinpoint reversal. There is a strategy that we will use to tackle this situation.
BTC is gonna play with many traders and my methods know exactly how it will play.
I have drawn two scenarios on the chart and we will take action according to that.
The first scenario is when BTC retests the breakout perfectly and moves down then we will buy, it is the time when everyone will sell and we will buy.
The second scenario is if BTC continues its move towards the upside without retracement at the broken trendline. This is a scenario that I don't want because if BTC continues its movement towards the upside then it will fall and the next dip can touch 35K.
Let's wait and react.
Also, I thank the Almighty for the Perfect strategies which show me the correct way.
Don't forget to hit the like and follow to stay connected

Pure technical analysis quick and simple 📈Looks like we can open the bullish case.
Triangle formation has broken to the upper side
Re-Test of the triangle on the upside on Friday
Price above still above the 50 SMA
Short-term MAs are bullish aligned (17 EMA > 30 SMA > 50 SMA)
Could be a nice long setup. Valid on the daily and weekly timeframe. If the price drifts further down, I would see this setup invalidated.

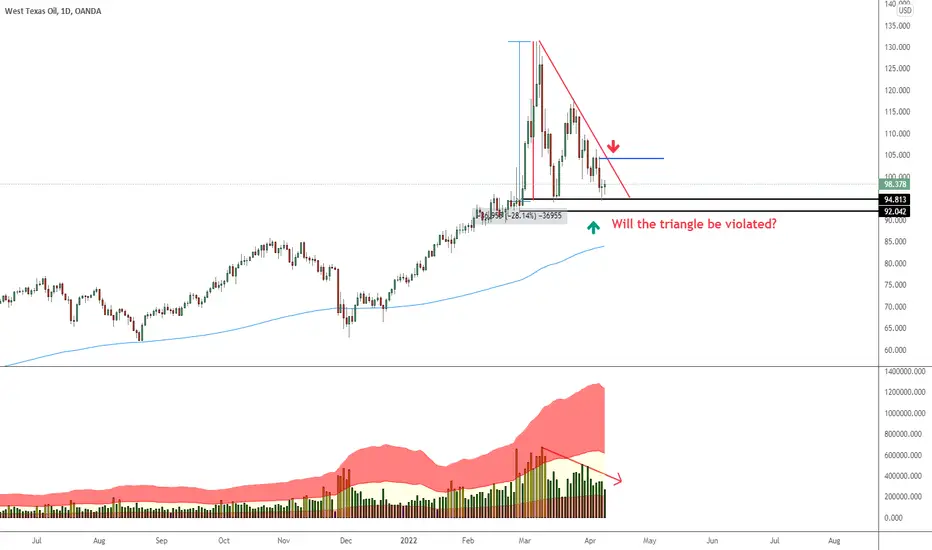
JICPT| Crude oil at the crossroad with decreasing volumeHello everyone. Crude oil has been really volatile since Feb mainly due to the supply issues.
Price has been retreated from the high created on March 7th by almost 30%. It formed a triangle shape with solid demand zone(92-94.81) being tested twice.
From the daily chart, we can see crude oil is at the crossroad. One possible scenario is the sideway move between the range of $92-$105.
What do you think? Feel free to share your thoughts below.
NZDUSD - Descending TriangleAlthough I'm waiting for my Bearish Shark Pattern on both 4-hourly and Daily Chart. I am more interested to wait for a shorting opportunity in this descending triangle setup.
Either a retest of the descending trendline or a break and close below the support line could be a sign for me to get involved in this shorting opportunity.
With that said, rules of filter and candle formation is just as important.

BTC exploding soonEMA 25 has been strongly considered as support and resistance in bitcoin(4 hour chart) and currently it is acting as a support for bitcoin in 4 hour chart .
after correction i btc is going to be above 45000$ soon .. Don't take too much leverage as whlaes will try to liquidate your trade ..
Take a proper leverage upto 10x ..Thankyou

expect a Breakouts at this point!!hello everyone
We can see the accumulation in this market for almost all of the cryptocurrencies, and for most of the day trading strategies. this accumulation tightened the market spring and a breakout is Inevitable.
We have symmetrical triangle form as the two trend lines touching,and we have the same pattern in our RSI too.
Due to the spikes in volume and the amount of BITCOINS leaving the brokers, i expect most of the cryptocurrencies with the same pattern to break the upper trend lines.

LTC triangle and double bottom#LTC/USDT
$LTC weekly chart shows price is at bottom and above lower line of triangle.
🐮 holding the lower line of triangle as support can increase price toward upper line around $150.
break out from upper line of triangle will confirm double bottom pattern and will head up price toward $400 and $700.
🐻 break down from lower line will drop price to supports shown in chart.

BTC (1H) - Another Triangle above support ? You should be scaredHi Traders,
As you can see, BTC is forming some overlaping structure above strong support, so my expectation is: Somebody is buildng a BIG short position to break it DOWN.
BUT, Be prepared for both directions and wait which trendline will be broken ;)
Take care and trade safe.

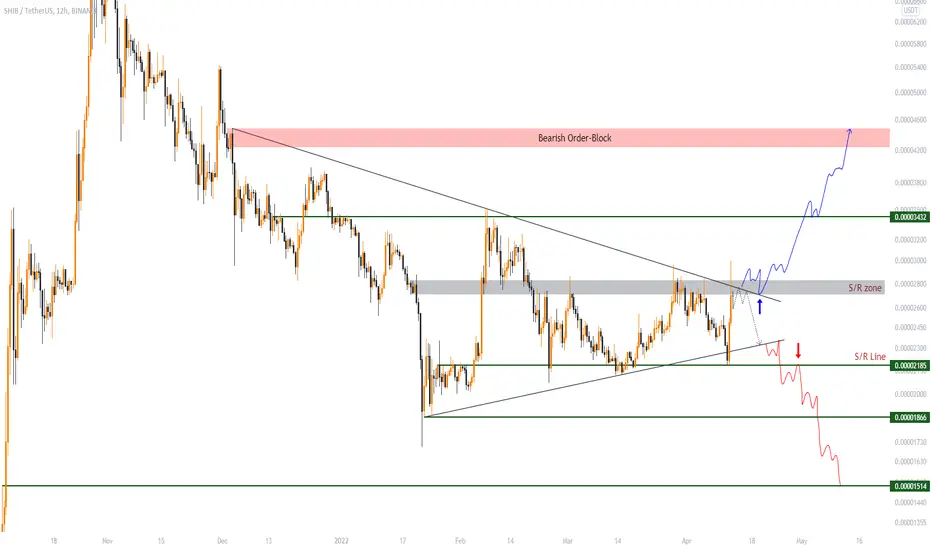
SHIB/USDT : Moving into a triangle !BINANCE:SHIBUSDT
Hello everyone 😃
Before we start to discuss, I'll be so glad if you share your opinion on this post's comment section and hit the like button if you enjoyed it !
SHIB has formed a symmetrical triangle and now it's moving near to the higher trendline.
Despite of that it's reaching near to the apex of the pattern; There're few possibilities to look for !
- Bullish case; If we get the breakout above the pattern and hold above S/R zone ( mentioned Grey zone ), Then we can aim for $0.00003432 and $0.00004230.
- Bearish case; If we get the rejection below the pattern and hold below S/R line ( mentioned Green line ), Then we can aim for $0.00001866 and $0.00001514.
Hope you enjoyed the content I created, You can support us with your likes and comments !
Attention: this isn't financial advice we are just trying to help people on their own vision.
Have a good day!
@Helical_Trades
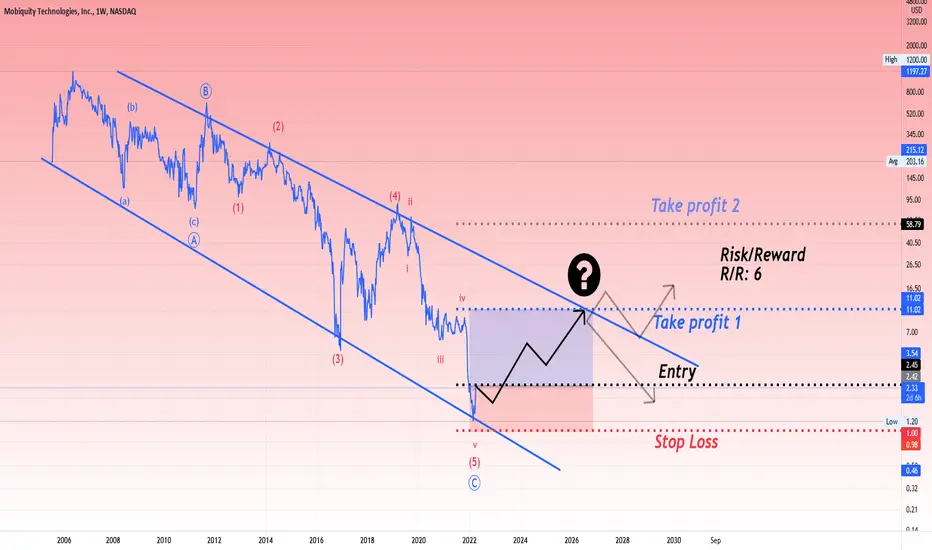
MOBQ Wave Analysis AND PATTERN It has a structure similar to abc and the minimum thrust up to the specified range can be observed
Be sure to stick to Stop Lost and TAkE Profit. This is an idea and not a bargain offer
MphasisHello and welcome to this analysis on Mphasis.
In the daily time frame its been in a sideways trend now for quite some time forming an Ichimoku P Wave.
We can see each swing zone has a 3 leg structure testing the 2 trendlines.
Currently it appears to be ending the 1st leg of the the last wave down (likely), a small bounce back from the current level and then the final leg of Wave E near to the lower trend line should complete this P wave triangle
Results are scheduled to be due end of the month. By then it is likely to complete what would be the end of a Price and Time correction in it.
Until then stock will continue to remain in a narrow range.
View would be wrong if the swing low at Wave C is broken. Alternatively if a turn from here breaks the upper trendline then will consider this low as end of Wave E.

⭕️SELL NZDJPY ❗️🔰You see the analysis of the New Zealand Dollar against the Japanese Yen in 30 minutes ( NZDJPY , m30)🔎
🔰SELL Limit NZDJPY at 85.950
✅TP ; 85.350
❌SL ; 86.100
🔰As it is clear from the image, the price is moving in a triangle pattern, due to the presence of the price in the triangle resistance line (the bearish white line) the sale in this range seems to be low risk. The target is placed at the triangle support line (white ascending line) 👌
⚠️⚠️Please observe capital management and open a low volume transaction❗️❗️
I hope this analysis is useful for you🙏🏻🌹
📌Please introduce the "TRADER STREET" to your friends 🙏🏻
_______________________📈TRADER STREET📉________________________

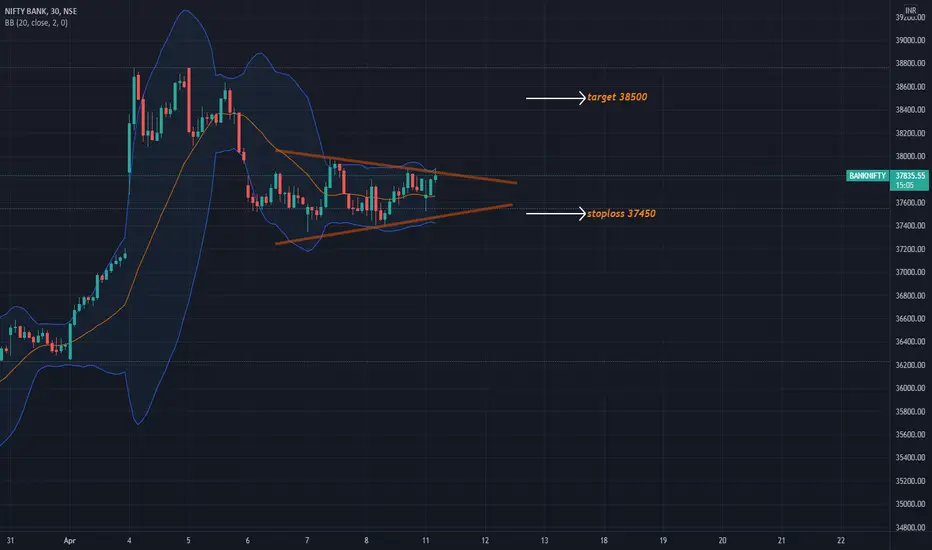
BANKNIFTYBanknifty broke out of triangle pattern on smaller time frame charts.
Could be bought with mentioned stoploss & target.