PLTR PALANTIR - Triangle in progressThe course of Palantir NYSE:PLTR appears to be in a compression triangle.
In the short term, it is heading towards the support of $ 17 (end of wave C). Then it will probably retest the $ 21 (wave D) before returning to its old support (wave E and end of the triangle).
After that, it either breaks the green downtrend line and we are off to pick up his old ATH or back to $ 10.
Trianglepattren

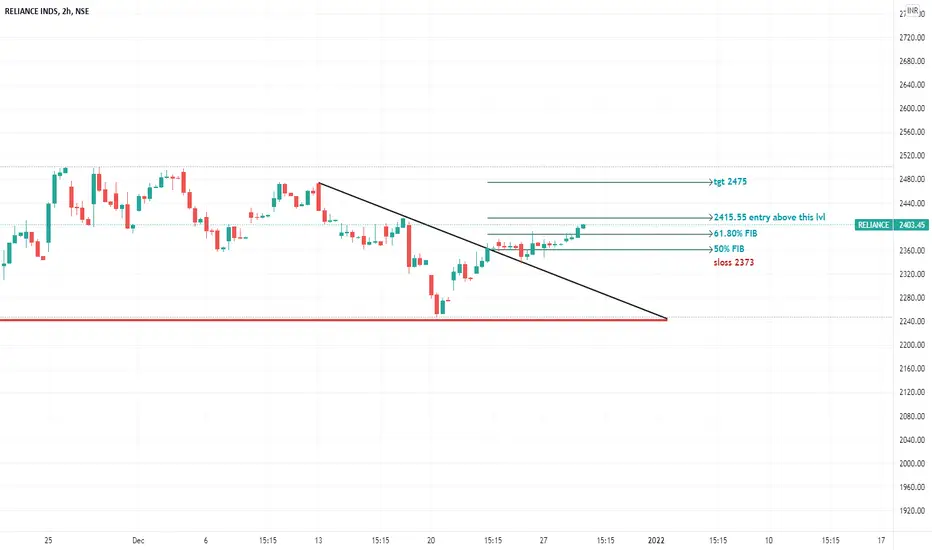
RelianceReliance broke out of traingle pattern with decent volumes & currently trading above 50% & 61.8% FIB Retracement Levels.
Could b bought above 2515.55 with mentioned sloss & tgts.
Bank Nifty Elliot wave analysis Hello Traders ,
As we know there was a correct ion going on in market form 22 Oct and still it is forming and making new low at very next time .
We can see a zigzag pattern is in making which is subdivided into 5,3,5 as ABC wave pattern .
Now BNF is making 4rth sub wave of wave 5th and it's making a triangle pattern where wave E is in making process . Once wave E will complete we will be vitness of long down move .

COCOS/USDT, MOONING?Things are getting exciting with COCOS, forming a symmetrical triangle while breaking a huge triangle on the 4H frame.
As I mentioned before, the confirmation is closing above 2.7

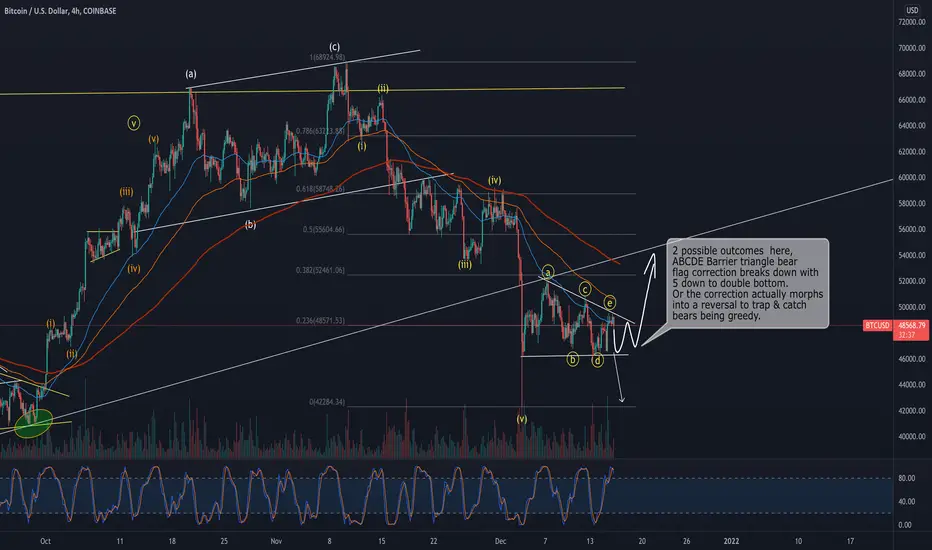
Short-term Bitcoin Price Update. New Trend Lines Emerge on 4H.Looking at the 4-hour chart of Bitcoin. I had a descending triangle that has recently broken downwards. However, what I thought was a descending triangle appears to be rising wedge. This does not change the sentiment that we are bullish Bitcoin. It only changes the price targets. $40200 remains valid, not as the target of the descending triangle but as historical support. However, I see $44536 as a strong support line based on the big drop on 4 December. If that line breaks, then I will be setting up buy orders at lower levels. If we break the top of the falling wedge before we break $44536, then we look for entry points above both. I will update this as things unravel.
You can view this chart with live price and my updates here .

$ADAUSD - Hope this support withholdsHello everyone!
Cardano touched an important support area.
Must rebound from this point and should go upwards.
If you see the RSI on a daily chart, ADAUSD was drifting in the lowest oversold zone for too long, this might be the right time for reversal.
The best would be to wait for it to close above 1.30

GOLD. Maybe the "sky clear" ONLY for rocket after May. 2022. GOLD. Back to "Bullish Triangle" Idea. GOLD's price may still "containing" within a big range :- <1900-1700 > ..before a "clear date for actual rate hiking counts plan" announcement from FED right before/after May 2022?...

Rising triangle 7% ROIMacd Bullish Divergence
Hit Support
Makes higher low
Rising RSI
Break of resistance suggests 7% to next resistance.

EOS, going up? EOS looks like it could gain some momentum to the upside.
EOS may have found a bottom in the past 10 days and has formed a nice a triangle pattern.
Could break out over next 1-7 days to reach some previous supports roughly marked in purple.

BTCThe chart still looks bearish to me and I have been expecting a double bottom. But few things or let's say catalysts have already occurred , The fed meeting has already happened & markets look to be digesting the Powell speech. Also the fear trade was set up prior to the meeting, meaning BTC crashed to $42k was last week. So would make sense to buy the news here since we sold the rumor.
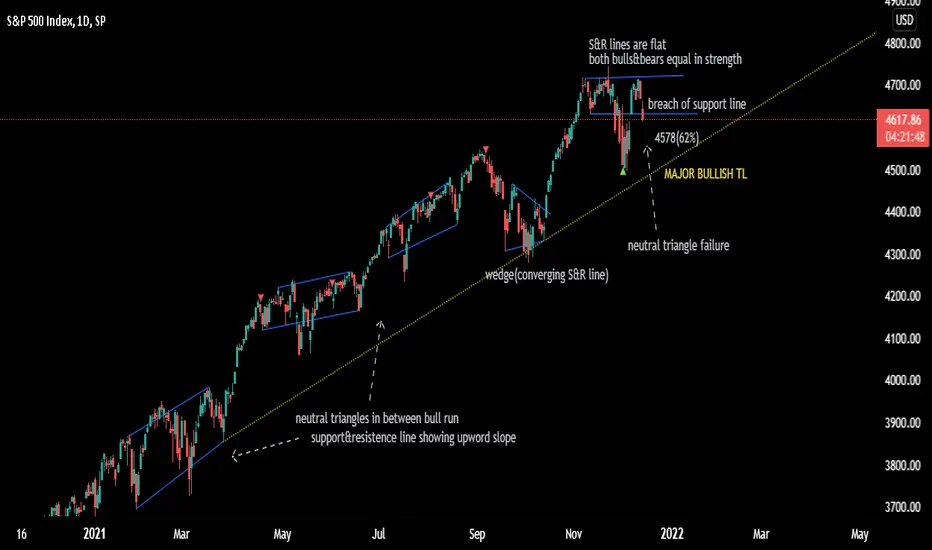
NEO WAVE NEUTRAL TRIANGLES IN S&P 500
NEO wave NEUTRAL TRIANGLES are corrective patterns inbetween a bull run. the slope of support and resistence lines are significant(up).
BUT we have one pattern completed today which is deviating the rules of uptrend. A FLAT HORIZONTAL S&R LINES with lower one breached is a confirmation of strength of bears or weak bulls.
second confirmation(pullback below 62%) is required to initiate positional shorts.
wait for updates
MATIC longThe price range is going to tighten here; also, it is ranging beneath the top of the triangle. On the other hand, 2.69$ is ATH and strong resistance for the bullish movement. In my opinion, there will be a breakout to the new ATH, but we must be alerted about BTC.
!!!DISCLAIMER!!!
THIS IS NOT FINANCIAL ADVICE TO TAKE A LONG POSITION AND WOULD BE GLAD TO BE CORRECTED IF I'M WRONG
I wish you the best🤘

what is the path of usdchf ? I think usdchf will arrive at the bottom of the triangle and after we can see a dump!

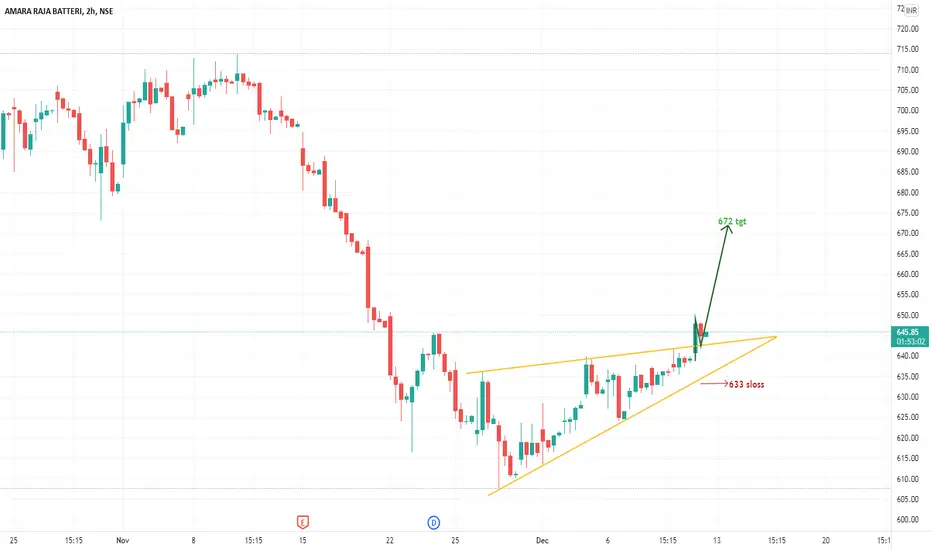
AmarajaBatAmarajaBat broke out of triangle pattern on hourly charts.
Could b bought b mentioned sloss & tgt in chart above.
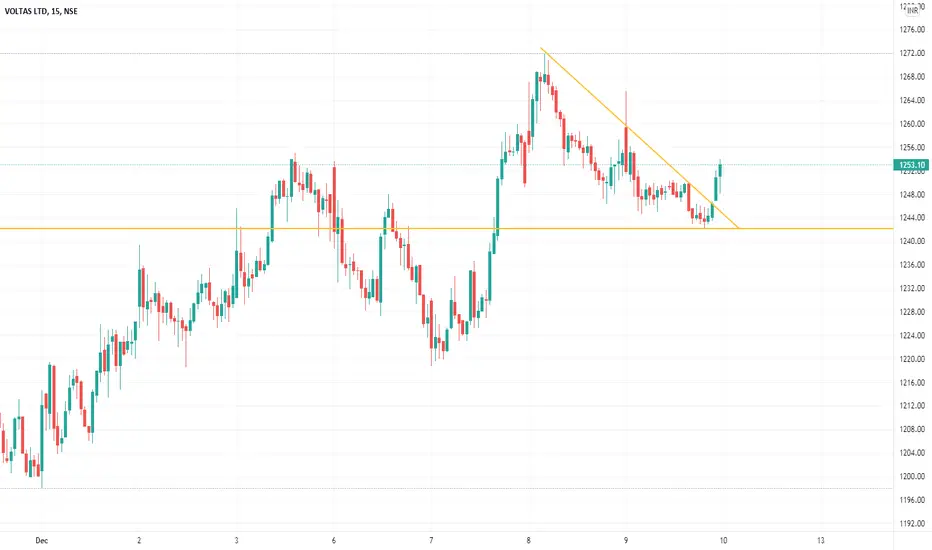
VoltasVoltas broken out of triangle pattern on 15 mins. chart..
Buy with sloss of 15 mins candle closing below 1240. Tgts 1276
$MKRUSD - Symmetrical triangleHello everyone!
There is a symmetrical triangle on MKRUSD.
After a slight correction followed by a retest of a resistance, MakerDAO most likely will go upwards to test the upper edge of the triangle.

BTC Down from Upward Pennant TriangleHi traders.
An Upward Pennant occurs in a downtrend as a triangle inclined upward, wich Is a BEARISH pattern.
On this price action, the price goes retest the major resistance above 49300.
The short position Is still validated.
Thanks for yours attention.

DAR is still strong, This support line must be kept!DAR Short term Analysis
DAR is one of the best METAVERSE projects, You can search about it on the web.
I personally bought this token around 1.88$, If you lose the chance of buying this token don't worry because 1.88$ can be touched several times again.
I expect to see slow movements for this token during 1 or 2 weeks. As you can see this slow movements range is between two Major S/R.

REC - positional pick TGT of 170/228/265/320/334/370Triangle pattern breakout and now it's retesting the trendline ,
buy around 94-98
TGT - 170/228/265/320/334/370+
SL - 74
Holding time 1-3 years after triggering price 0f 94-98.
This is meant for educational purpose only

#CHR_Hodl_Signal Strong signalCHR /Usdt looks ready for very big move
As we see the similarity in behavior
Once CHR breaks out the triangle pattern , it will move to targets
Stop lose : 1.038 4h cnadle
best wishes for you

DATA/USDT Bullish Weekly Chart !!BINANCE:DATAUSDT
Coin Name - DATA / USDT
Timeframe - Weekly
DATA looking so Bullish on weekly triangle accumulation !! Looking for 2x to 5x gains from here for DATA/USDT !!
