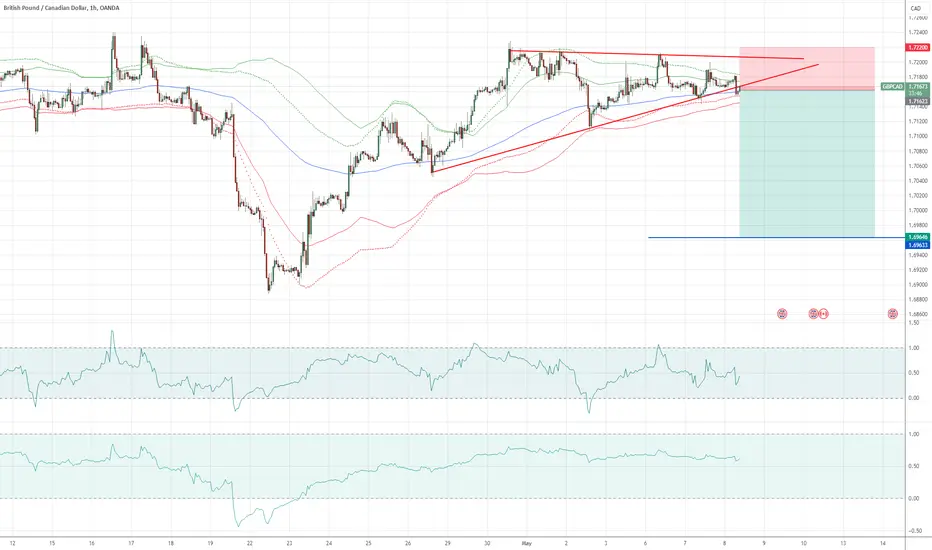
GBPCAD ShortOANDA:GBPCAD
This is to some extent a continuation of my last attempt to short the pair, which unfortunately failed. The pair has been consolidating for a while and has formed a triangle. Now, with a valid triangle pattern and bearish divergence, the pair has broken through the support. This presents a great opportunity to short the pair with moderate risk.
Trianglepattren
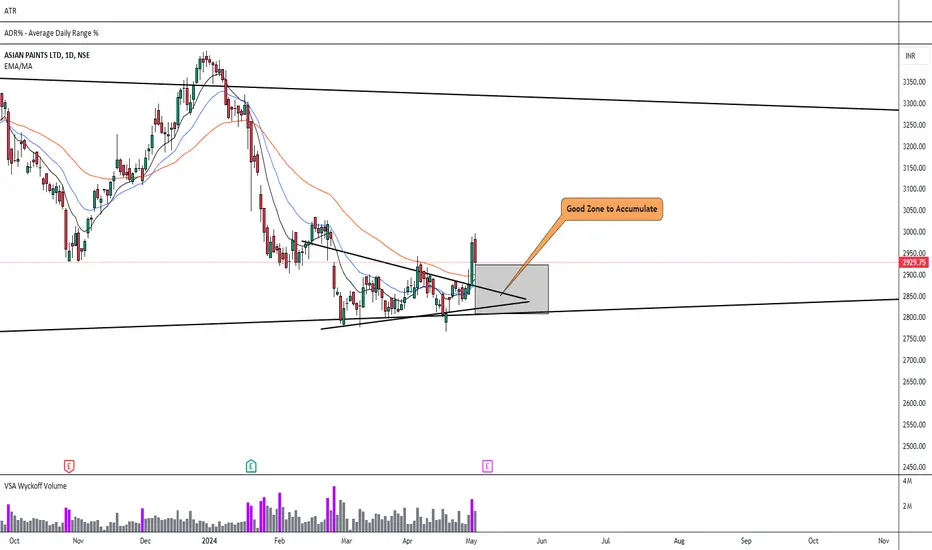
Good time to accumulate Asian Paints
Asian Paints Ltd. manufactures and markets paints and coating products. The company was founded on February 1, 1942, and is headquartered in Mumbai, India.
Good time to accumulate Asian Paints as it is in the bottom Trendline of a monthly pattern
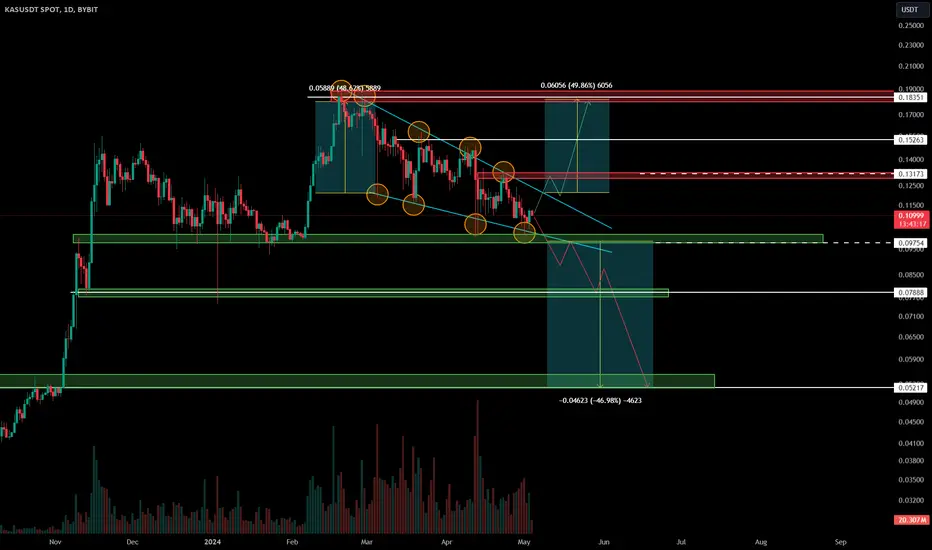
KASPA THE END OF A TRIANGLE !After numerous encounters with both the rising and falling trendlines, we find ourselves in a tight consolidation phase, poised for a breakout in either direction. The potential range for this breakout could be as significant as 48%.
Scenario 1: Bearish Breakout
If the price breaks below the descending trendline and subsequently breaches the 0.1317 support level, we could witness a Increase towards the subsequent targets of 0.1526 and 0.1835, respectively.
Scenario 2: Bullish Breakout
Conversely, if the price manages to break above the ascending trendline and then surpasses the 0.0975 resistance level, we could anticipate a Decrease towards the targets of 0.078 and 0.052.
Confirmation of Breakout
It is crucial to note that a breakout is considered confirmed only when the price closes a candle above or below the respective trendline or support/resistance level on the 4-hour timeframe.
Additional Considerations
While the above scenarios outline potential price movements, it is essential to acknowledge that market behavior is inherently unpredictable and can deviate from these projections. Therefore, it is advisable to incorporate additional technical indicators and fundamental analysis into your trading decisions to enhance risk management and make informed judgments.
And these are just my analysis and not economic advice, you should enter into trades based on your own knowledge and analysis.
4031: Ascending Triangle PatternPrice is nicely moving within Ascending Triangle
Entry can be taken now (until triangle top for short gains
Trail SL once the price touch the resistance (triangle top)
Proper Entry will be taken once the triangle breakout is observed
Trail SL below Triangle Top and ride the trend

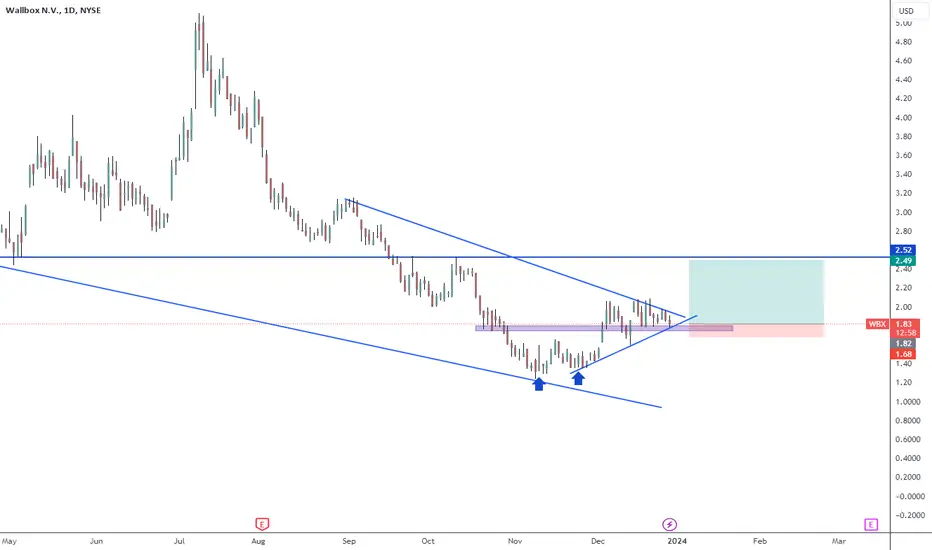
Low risk entryAfter this sell off a bunch of great entry points came up. I found this one, risk reward is very low, and is about to break out. I don't think is goin to take much longer. The price just landed on a strong support zone, it will bounce any time soon.
Consolidation in COAL INDIA - Expect a 15% upmove post breakout COAL INDIA - is nearing its 52 week high with decreasing supply on a daily time frame with a consolidation from the past 100 days.
The company has seen an influx of institutional investing. Coal has also been a silent performer and will only increase with the dependency on the product.
Good for swing traders to be kept on watchlist. Look for volume gain above the 30w moving average on weekly time frame.
Can expect an upward momentum of a min of 25%.
Entry - On breakout - INR 455 and above.
SL - swing low of 3%
TSL - According to your risk profile.
Disclaimer: Please be advised that the information provided is not intended as financial advice. It is imperative to conduct thorough research before making any investment or trading decisions.

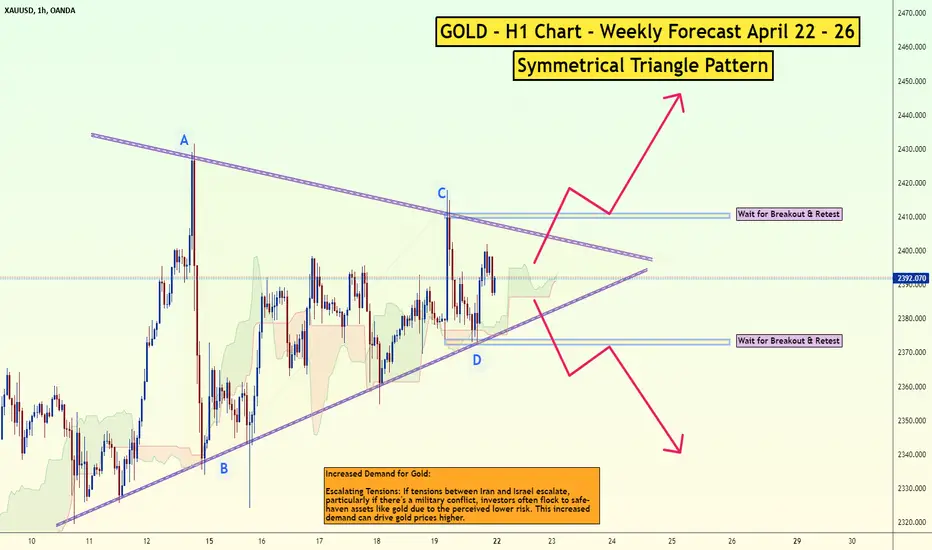
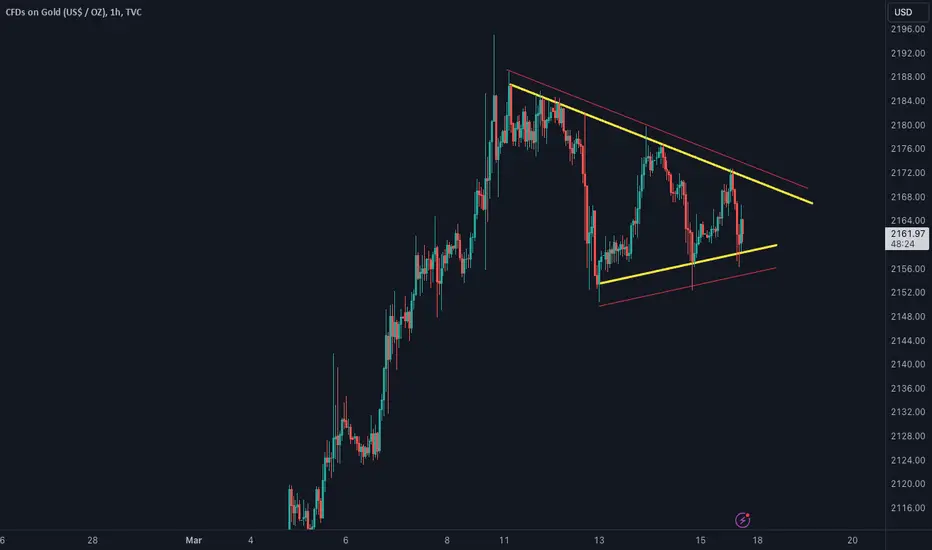
Gold (Xau/Usd) Symmetrical TriangleSymmetrical Triangle Pattern on Gold (XAU/USD) H1 Chart
A symmetrical triangle pattern has been identified on the H1 chart for Gold (XAU/USD). Here's a breakdown of its characteristics:
Description:
This pattern is formed by two converging trendlines, one drawn above the highs and another below the lows, with price action oscillating between them and creating a triangular shape.
The trendlines ideally have a similar slope, making the triangle symmetrical.
Potential Interpretations:
Continuation Pattern: Often, symmetrical triangles act as continuation patterns. If the price breaks above the resistance trendline (upper trendline), it suggests a potential continuation of the previous uptrend. Conversely, a break below the support trendline (lower trendline) might indicate a continuation of the downtrend.
Reversal Pattern: In some cases, symmetrical triangles can precede reversals. A breakout above resistance could signal a bullish reversal, while a breakdown below support might indicate a bearish reversal.
Additional Considerations:
Volume: Ideally, there should be a decrease in volume as the triangle progresses, suggesting dwindling momentum before the breakout.
Volatility: A breakout is often accompanied by a surge in volatility.
Trading the Pattern:
Breakout Confirmation: Wait for a confirmed breakout above resistance or below support before entering a trade in the direction of the breakout.
Stop-Loss: Place a stop-loss order below the support trendline for long positions and above the resistance trendline for short positions.
Profit Target: Potential profit targets can be based on the height of the triangle or technical indicators.
Thank you.
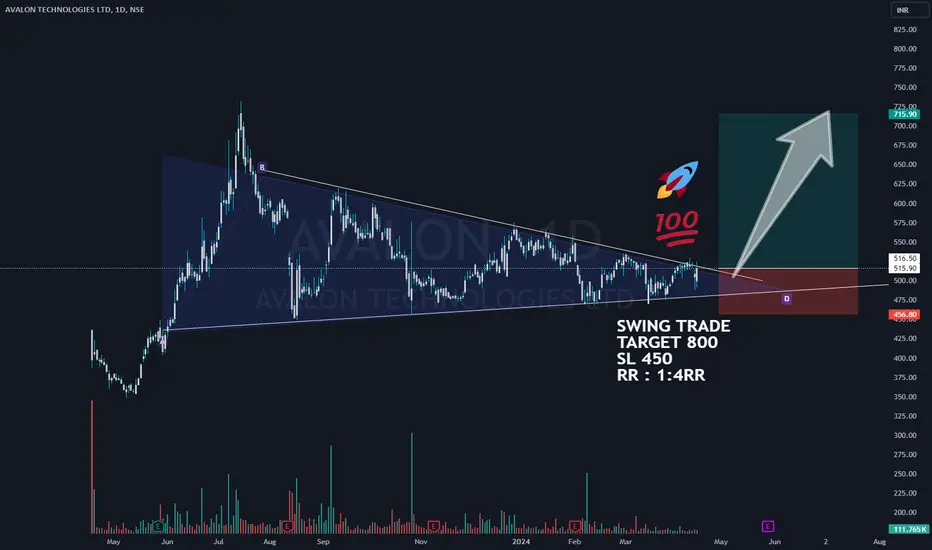
AVALON SWING TRADE 40% RETUN💯🚀swing trade perfect symmetrical triangle long term opportunity take trade according to own risk this is not call just a analysis.
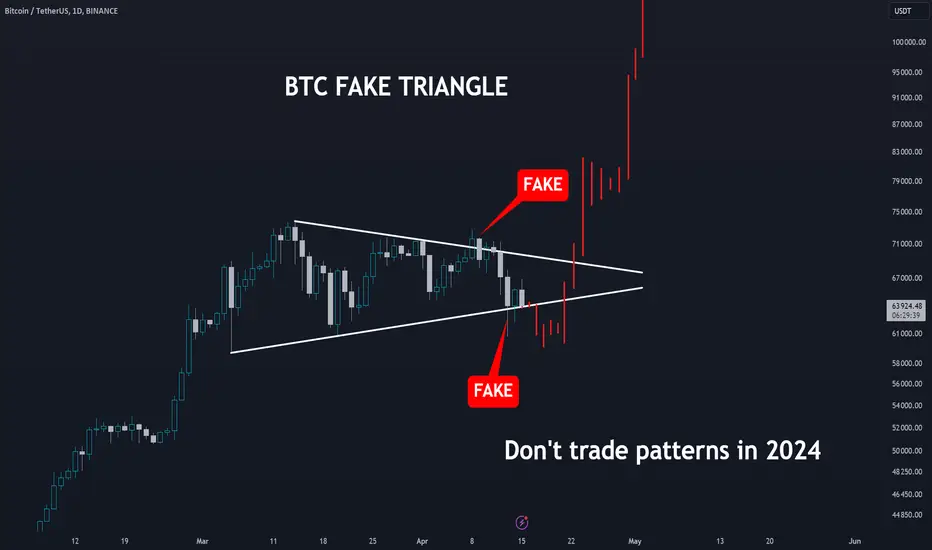
Don't Trade Patterns in 2024 - They are mostly FAKE BTC has been trading in a triangle pattern on the daily timeframe. Many traders are trading pattern breakouts, for example, if the price breaks above the upper trendline of the triangle, they open a long position. However, in reality, all that happens is that liquidity is collected and the price moves lower. Then the same thing happens under the lower trendline support, and the price moves higher.
The dangers of pattern trading:
Pattern trading is a popular trading strategy, but it can be risky. Patterns can be deceptive, and they can often break in unexpected ways. This can lead to significant losses for traders who are not careful.
The rise of AI indicators:
Artificial intelligence (AI) is increasingly being used in trading. AI indicators can analyze vast amounts of data and identify patterns that are invisible to the human eye. This can help traders to make more informed decisions.
The benefits of AI trading:
AI trading can offer several benefits over traditional pattern trading. AI indicators can:
Identify patterns more accurately
React to market changes faster
Remove emotions from the trading process
The future of trading:
AI is likely to play an increasingly important role in trading in the future. AI indicators can help traders to make more informed decisions and reduce their risk. As AI technology continues to develop, we can expect to see even more sophisticated AI indicators that can help traders to profit from the markets.
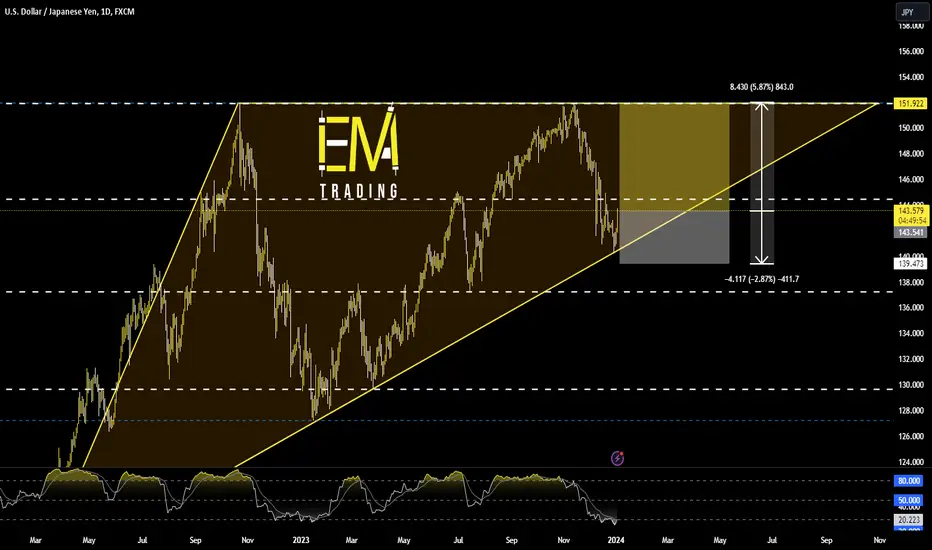
USD/JPY ⬆️ Long Trade Setup ⬆️Hello Everyone 🙋🏽♂️
Triangle pattern + RSI Signal
💲 Entry Point : 143.571
🟢 TP 151.922 🔴 SL 139.473
We are not responsible of any losses for anyone, our trades are profitable more for long terms and we take losses as everyone,
manage your lot size as well and your SL and TP and my opinion is 0.01 lot for each 500 $.
Don't forget to hit the like bottom and write a comment to support us.
Follow us for more 🙋🏻♂️
Best Regard / EMA Trading .
Disclaimer:
----------------
It's not a financial advise, As everyone we take losses sometime but for long term trading we are profitable traders, so manage your account well with SL and TP and your lot size to keep your account safe and stay in the market
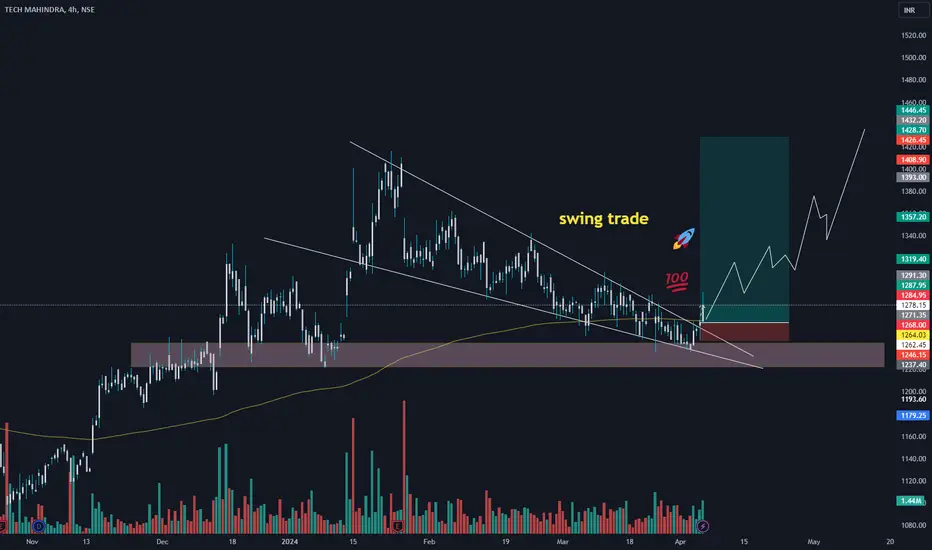
TECH MAHINDRA SWING TRADE march 4/ 4/2024
swing trade perfect symmetrical triangle long term opportunity take trade according to own risk this is not call just a analysis.
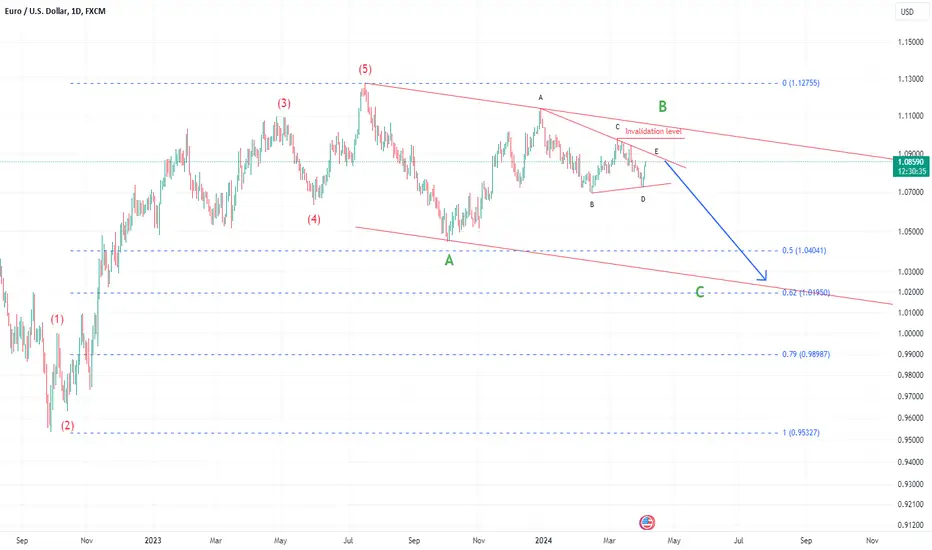
EURUSD Daily Elliot Wave AnalysisAfter completing the first upward Impulse wave, we've seen a downward correction in the form of Wave A, followed by a complex correction Wave B forming an ABCDE triangle pattern. Now, as the triangle appears to be completed, we anticipate the breakout of Wave C to the downside, with expectations of it continuing towards the Fibonacci 61.8% retracement level.
is this feakout or breakout but sentiment are so highwhite line broken
we have possible triangle pattern in blue lines
silver made bottom ahead of gold for fed pivot
you can say silver is light year head of fed decision
for next fed fomc watch if breakout sustain or fakeout

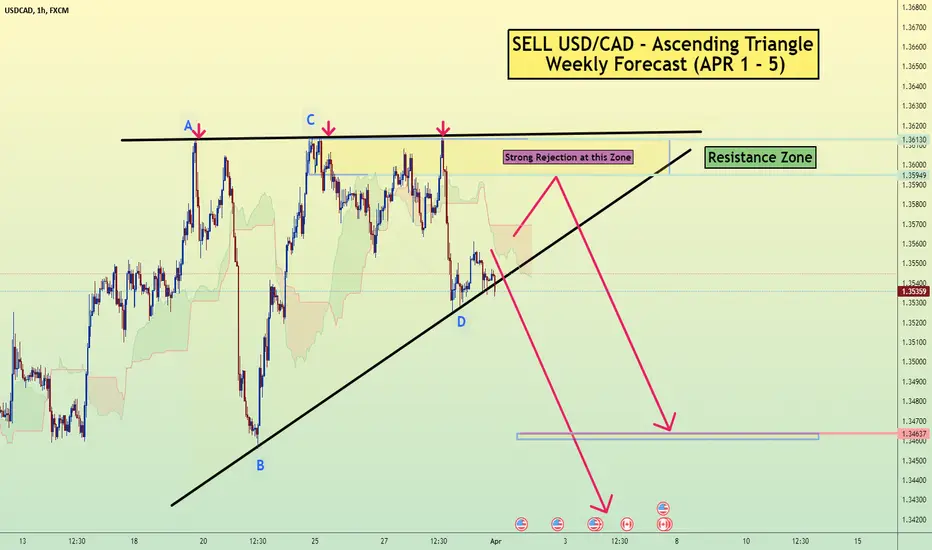
Sell USDCAD - H1 Ascending TriangleUSD/CAD H1: Ascending Triangle Hints at Potential Downturn, Shorting Opportunity Emerges!
The USD/CAD pair on the H1 timeframe presents a potential selling opportunity due to the presence of a well-defined ascending triangle pattern. While ascending triangles can be continuation patterns, a breakdown from this pattern, especially on higher timeframes like H1, suggests a higher likelihood of a trend reversal towards the downside.
Key Points:
Sell Entry: Consider entering a short position below (ideally around 1.3600). This offers an entry point close to the perceived shift in momentum.
Target Levels: The initial bearish target lies at 1.3460.
Stop-Loss: To manage risk, place a stop-loss order above the broken resistance line (rising trendline) of the triangle, ideally around 1.3630.
Thank you.
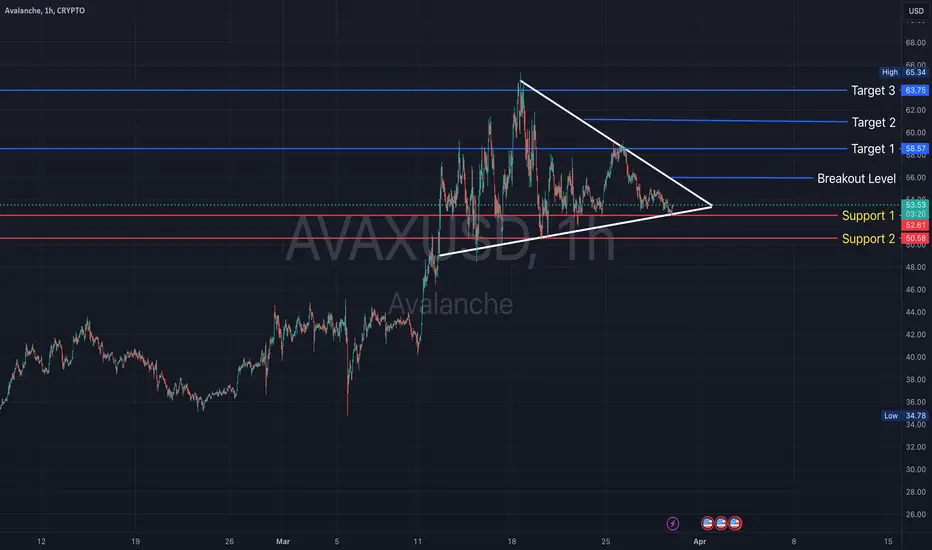
How I would trade AVAXUSD on the 1h timeframeTriangle forming on the AVAX/USD 1H timeframe.
I would wait for confirmation that the breakout has occurred, then enter the trade and exit at one of the targets.
If the price touches the support line 2, my trading setup would have been invalidated and I would not enter the trade.
Trade safely and remember to set your stop losses!
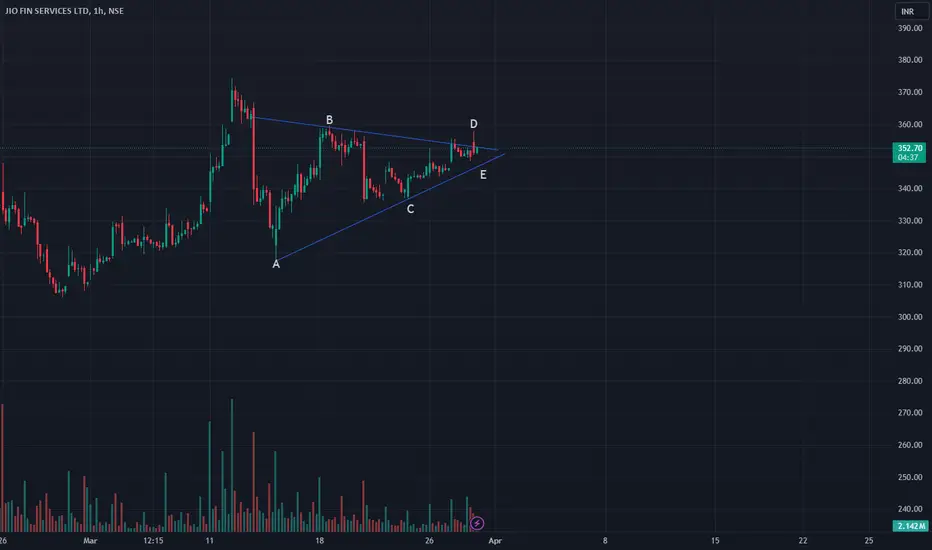
Lets see what it does...This is just a view about jio financial services.
I have seen this triangle from my perception.
what you think tell me in comment section....join me join trading view to access full set of tools available with TradingView.
Regards
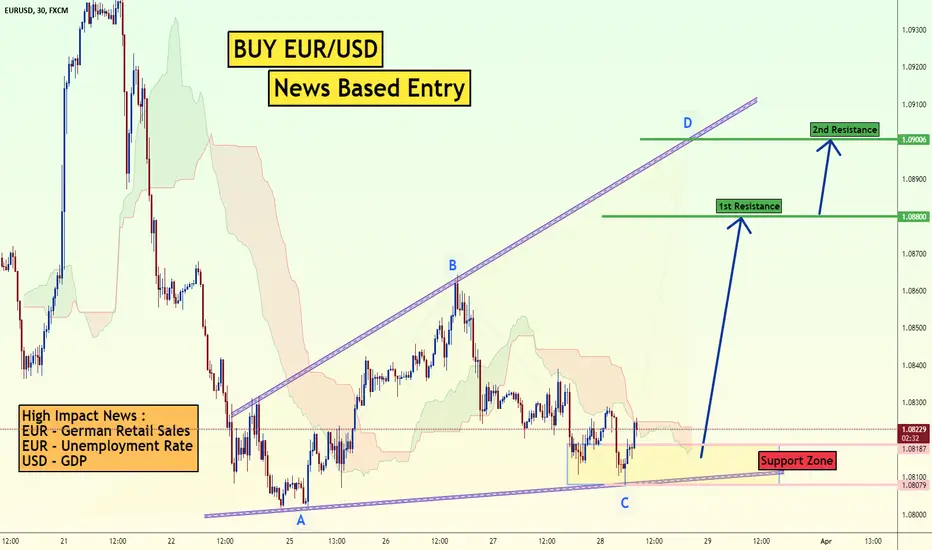
Buy EURUSD News BasedThe EUR/USD pair on the M30 timeframe presents a potentially ambiguous situation with an expanding triangle pattern. While this pattern can signal a breakout in either direction, some caution is advised before entering a long (buy) position.
Potential Long Trade :
Entry around: 1.0823 (current price)
Target Levels:
1.0880: This represents the upper trendline of the triangle, which could act as the initial upside target upon a confirmed breakout.
1.0900: This is a further extension of the upside target, based on the recent price movement.
Stop-Loss: Place a stop-loss order below the lower trendline of the triangle, ideally around 1.0807. This helps limit potential losses if the price breaks down from the triangle pattern.
Thank you.
SAPPHIRE FOODS 40 % RETURN feb 19/ 3/2024
swing trade perfect symmetrical triangle long term opportunity take trade according to own risk this is not call just a analysis.

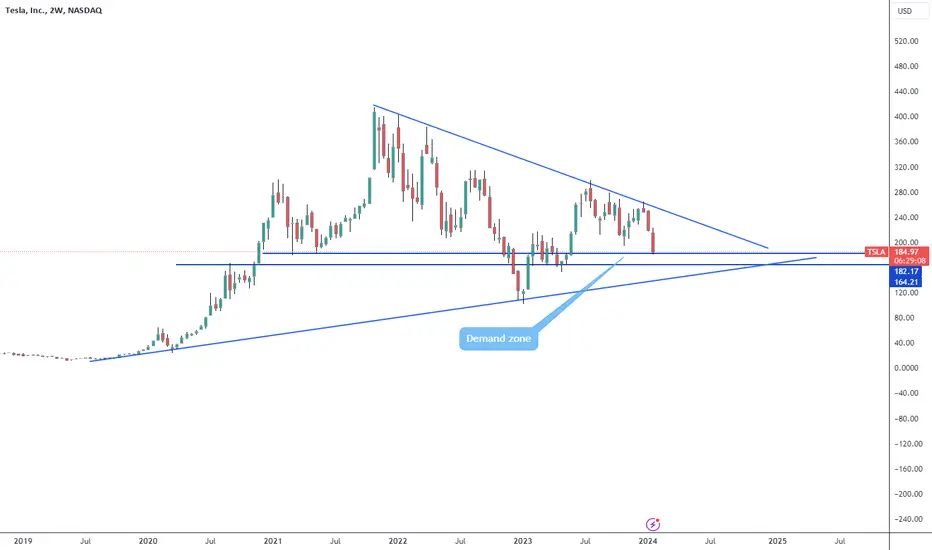
Is this the end?The support at 200 has been broken and confirmed in the monthly timeframe. Now bears are going after the 165 support (neck) level. We will see a lot of bouncing and pull backs. If it loses the 165 the only thing that can prevent a total collapse is the uptrend line. Also the 100 level is very strong. But doesn't look good in long term. I might take advantage at the support levels selling CSP but I definitely wouldn't be a holder.

Silver Testing 4H Channel Resistance; Bullish If BrokenSilver is trading sideways since 2021, a move that can be a corrective because of choppy and overlapping price action. Ideally, its a very big triangle in progress, with final wave E in play, which can be in late stages now, so ideally prices will stabilize in weeks ahead.
We can already see that the price on 4h time frame is turning up from projected 21.50-22.00 area, which is the first potential but strong support area for wave E. So if we are correct then metal can turn higher, but for confirmed bullish reversal we need an impulse out of a downward channel and through 23.50 lv.

Monthly chart of Aviva - triangle still formingTriangle forming since the year 2000.
Good results today, but it's hitting overhead resistance at 470 established in 2002 and 2019.
No clear breakout yet and needs to add another 100p before it can start to consider a breakout.

Oh TeslaThe market really wants this stock cheaper. Price is landing on a demand zone. If you like Tesla and think in long term you start accumulating from here. It needs more work to break out the triangle, maybe next year but when it does is going to be massive. Price can also be pushed down to lower vertex of the triangle. That would be ideal but I see a lot of buyers out there. I'm not trading or holding this stock but is very interesting how the price moves.