ACE | Elliott Wave Analysis | Triple Bullish DivergencePrice action and chart pattern trading
> Elliott Wave downtrend channel with triple bottom breakout
> Indicator: MACD triple bullish divergence
> Entry @ breakout & pullback support EMA50 zone
> Medium Target @ EMA200 - SMA200 zone 0.382 Fibonacci retracement +17%
> Stoploss @ triple bottom position - 7%
> Risk reward ratio: 2.5:1
Triplebullishdivergence

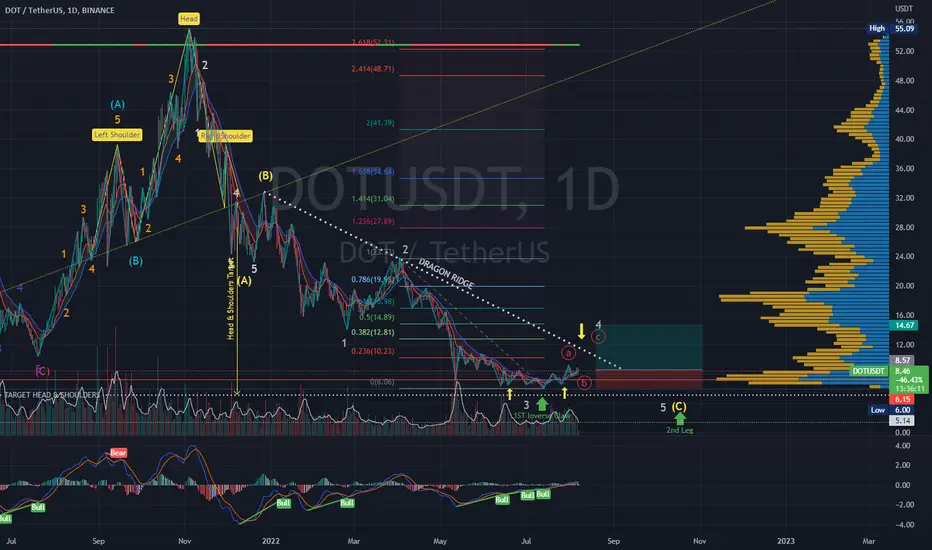
DOTUSDT | Wave Projection | Triple Bullish Divergence DragonPrice action and chart pattern trading
> Anticipating a breakout of dragon ridge or descending triangle breakout downtrend DRAGON ABC wave pattern with current Intermediate C-wave in zigzag formation
> Target @ possible making a minor 4-wave uptrend correction retracing 0.0382-0.5 previous 3-wave +50% - +70%
> Stoploss @ the lowest position of the -25 - 30% to the bottom forming the 1st claw of the dragon, relatively closed to the target of dragon main head & shoulders.
> Entry @ 1st Inverse Claw breakout
> RRR: 2.5:1
Indicator: MACD triple bullish divergence & RSI double divergence
Always trade with affordable risk and respect your stoploss