Solfun. Troll's growth: fundamentals versus technical analysis500% in one day — and not a single clue on the chart
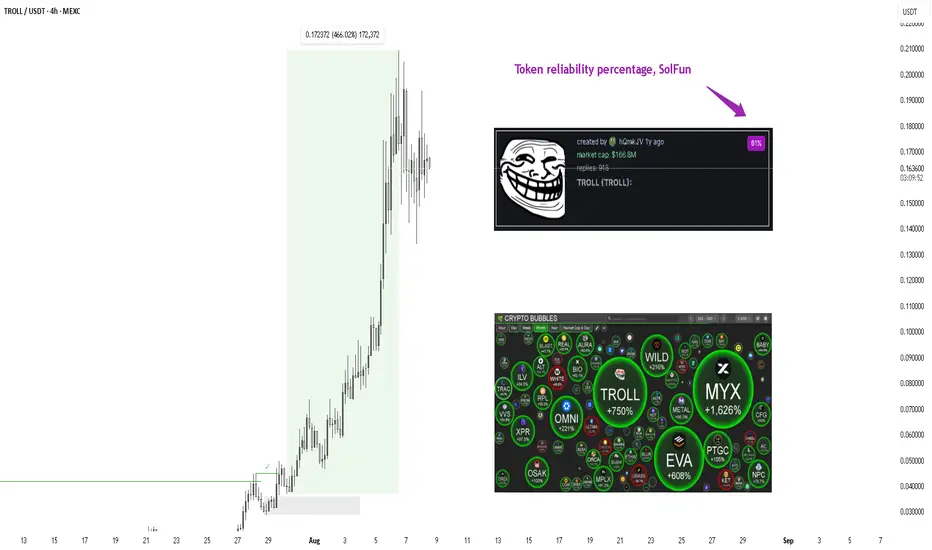
The Troll token gained more than 500% in one day. Such movements are not uncommon for the Solana memetoken market, but this case is indicative. If someone had tried to predict the growth using technical analysis, they would have been left with nothing:
there were no patterns on the chart;
there was no break in the structure;
the indicators were silent
The reason is simple — most new tokens on Solana don't even have a trading history to build technical analysis on. In addition, the average meme token rarely lasts more than a week, and a significant portion of projects turn out to be scams.
In the case of Troll, the impetus was not the chart at all, but a Twitter post from the Pump.fun account mentioning the token. It was this factor that triggered a wave of purchases, which led to a 750% increase at its peak.
When the chart is silent, fundamentals speak
In the world of memecoins, fundamental analysis is a quick snapshot of key metrics that can be checked in the first minutes of a token's existence:
supply distribution;
the share of bots among holders;
activity on social networks;
the presence of suspicious large addresses.
If you answer each of these metrics for yourself, you can already form a basic understanding: is the token worth paying attention to, or is it better to pass it by?
You can either collect all the necessary data yourself or switch to automation by using a cumulative integral indicator that combines all of this into a single number — the token's reliability percentage.
This percentage is a key metric that many traders rely on when making decisions. It is formed from a whole set of factors:
uniformity of token distribution;
degree of decentralization;
real audience activity;
abnormal transactions;
dynamics of interest on social networks.
This is the percentage that many traders look at first: if it is below 20% , the project is immediately rejected.
Automation instead of manual analysis
Collecting such data manually takes too long. By the time a trader checks the distribution of supply, holders, and activity on social media, the desired deal may already be gone. Therefore, the market has gradually shifted to automation.
There are now many browser extensions that analyze tokens and indicate the final reliability percentage instead of the trader.
In my case, SolFun is just one such tool, a standard within the Solana ecosystem. The extension is built directly into the Pump.fun interface, works in real time, and aggregates key metrics into one convenient indicator.
In the case of Troll, SolFun showed 61% reliability — a high level for a new token amid a flood of daily scam projects.
Conclusion
The story with Troll is just an illustration of a general pattern in the Solana memetoken market: technical analysis is often useless. What matters here is the speed of obtaining information and the ability to quickly filter the flow of projects. Either manual work or connecting automation in the form of SolFun and other extensions.
The speed of analysis is especially important in an environment where every extra hour can cost you a missed deal.
Troll
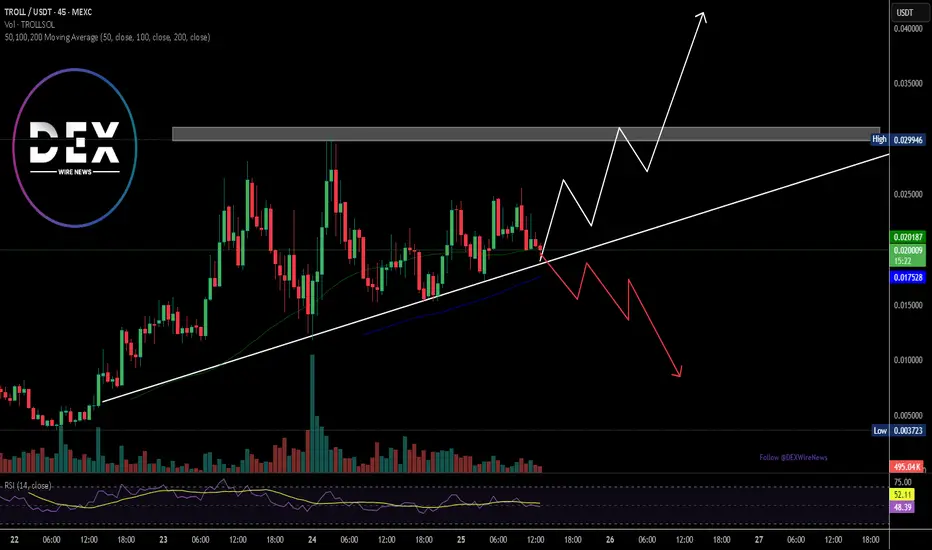
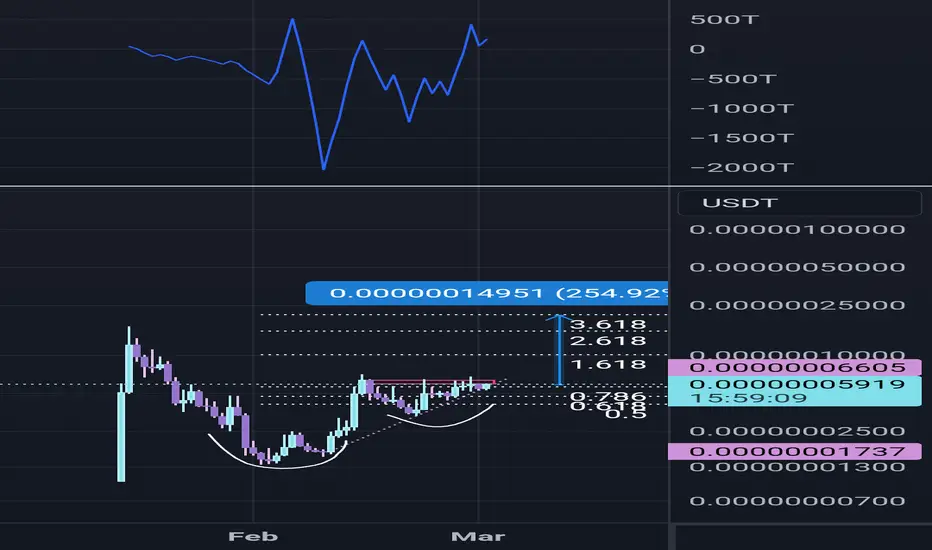
$TROLL Set to Breakout Amidst Symmetrical Triangle Pattern$TROLL, a memecoin built on the Solana Ecosystem through Pump.fun passed bonding curve and got listed on Raydium and CEX like MEXC, Lbank, and Meteora is set for a breakout amidst a symmetrical triangle pattern.
The memecoin is showing signs of a bullish rally and also a bearish rally. The symmetrical triangle has been carved out already, the only confirmation needed is a breakout above the ceiling of the symmetrical triangle- that will be the only catalyst $TROLL needs for a breakout coupled with the RSI at 47, $TROLL is poised to capitalize on this metrics to deliver a stunning bullish campaign.
However, on a bearish tone, failure to break above the symmetrical triangle will be difficult for $TROLL to hold the bears in that region, hence, it will resort to a correction to the $0.008 support point.
About TROLL (SOL)
The TROLL token on the Solana network is a meme coin inspired by internet trolling culture, designed for entertainment and community engagement with no intrinsic value. Built on Solana’s blockchain, it leverages the network’s fast transactions and low fees to appeal to meme enthusiasts.
TROLL (SOL) Price Data
The TROLL (SOL) price today is $0.020531 USD with a 24-hour trading volume of $30,882,484 USD. TROLL (SOL) is up 11.71% in the last 24 hours. The current CoinMarketCap ranking is #801, with a market cap of $20,510,507 USD. It has a circulating supply of 999,005,592 TROLL coins and a max. supply of 1,000,000,000 TROLL coins.
$TROLL on the Rise: Why This Could Be the Bullish Play of 2024In an era where cryptocurrency innovation meets community-driven culture, $TROLL emerges as a new sensation, bringing nostalgic meme vibes, security, and the spirit of decentralization to the market. $TROLL revives the beloved TrollFace, sparking a “meme revolution” that is setting out to make memecoins fun and approachable once again. With a renounced contract and burned liquidity pool (LP), $TROLL boasts a transparent and community-focused ecosystem, capturing both the light-hearted essence of memes and the safety-driven principles that investors seek.
Why $TROLL is Different
Unlike many memecoins that launch with presales, tax structures, and other barriers to entry, $TROLL took a unique path by launching stealthily, with zero taxes, a renounced contract, and a burned LP. This approach not only underscores the project’s commitment to decentralization but also positions $TROLL as a “coin for the people,” ensuring that the token remains accessible, community-driven, and safe.
$TROLL tokens can be traded on notable exchanges like HTX, DigiFinex, and Gate.io, with HTX currently leading in trading volume for the TROLL/USDT pair, amassing $3.5 million in the last 24 hours. This accessibility on centralized exchanges allows a wide range of crypto enthusiasts to join the $TROLL movement, contributing to its liquidity and appeal in the market.
Daily Market Activity & Rising Volume
The recent market activity surrounding $TROLL suggests increasing interest, as its 24-hour trading volume has surged by 14.9% to $5.4 million. This heightened activity signals fresh attention to the coin and its bullish potential, with active trading showcasing the rising market sentiment toward this community-led project.
All-Time Highs and Lows: A Historic Snapshot
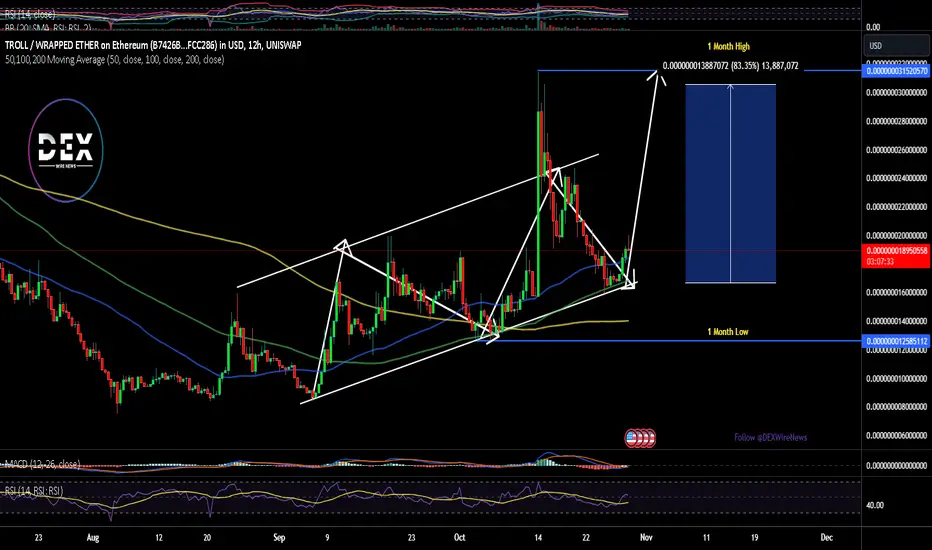
Since its inception, $TROLL has demonstrated significant price movement. Its all-time high of $0.000006134, recorded in Mar 02, 2024 (8 months ago), sits 85.57% above the current price. However, the coin’s lowest price was recorded in Aug 05, 2024 (3 months ago) at $0.000000010888.
Market Cap and Fully Diluted Valuation
With a current market cap of $18.5 million and a fully diluted valuation (FDV) closely matching at $18.54 million, $TROLL ranks at #1136 on CoinGecko and #841 on CoinmarketCap. These valuations reflect $TROLL’s ambitious goal of reaching a maximum market cap in alignment with its circulating supply of 960 trillion tokens. This FDV metric shows the scope of $TROLL’s potential growth as it gains traction among decentralized finance (DeFi) and meme-loving communities.
Technical Outlook
From a technical perspective, $TROLL exhibits signs of an upward trend, with its current price up by 4.75% at $0.000000193. The Relative Strength Index (RSI) sits at 52, indicating a bullish shift in sentiment. As $TROLL transitions from a falling wedge to a rising wedge, it forms a *three white soldiers* pattern on daily candles, a classic indicator of a strong bullish reversal. This pattern, combined with a trough and crest formation within a rectangular trading range, suggests that $TROLL may soon test the upper limit of this range.
Adding to its bullish case, $TROLL is trading above several key moving averages (MAs), solidifying its potential for further upward momentum. The convergence of these MAs provides strong support, acting as a foundation for $TROLL’s continued upward movement.
Market Comparison: Memecoins on the Rise
Despite a price decline of -1.1% in the past week, $TROLL is beginning to outperform other similar memecoins. In comparison, the general cryptocurrency market saw a 2.5% increase, while other Ethereum-based tokens rose by 12.7%. This underperformance presents an entry point for investors seeking exposure to a potential upside as $TROLL continues to build momentum with its unique, community-centered ethos.
Positioned for a Promising Future
With its strategic blend of meme appeal, decentralization, and secure design, $TROLL has set the stage for a promising trajectory. As CRYPTOCAP:BTC currently sits at $71,000, contributing positively to the general market sentiment, $TROLL is well-positioned to benefit from this crypto-wide momentum. The market activity, technical indicators, and fundamental factors all align to create a compelling case for $TROLL as it aims to redefine the role of memecoins in the cryptocurrency landscape. And so it leads us to the question: "Could $TROLL Be the Bullish Play of 2024"
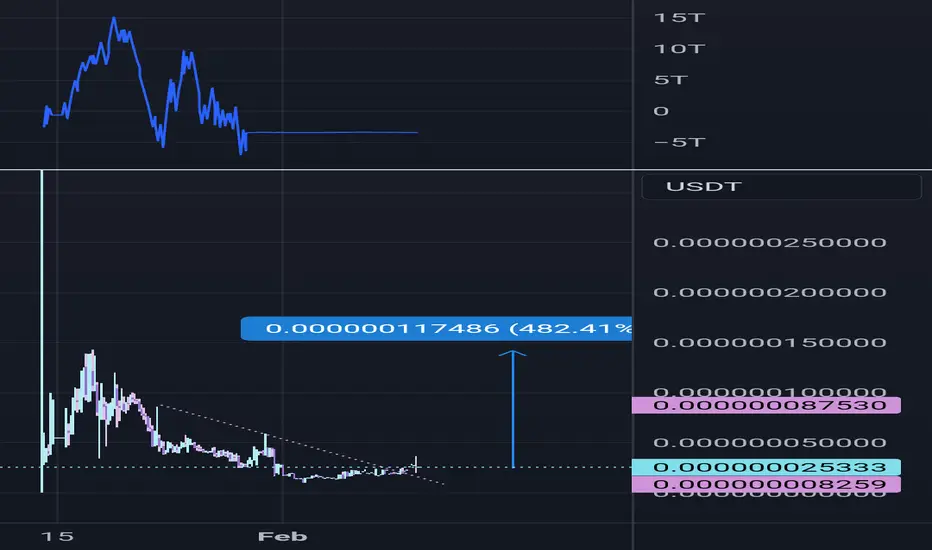
TrollusdtTrollcoin aths on the way??
Compressing into an ascending triangle here
Looks very bullish with pepe and wif leading other memecoins up!
TrollusdStill only 50mil mcap
Downtrend break tick
Cex listing tick
Actual godlvl meme tick
Altseason (??) Soon (tm)
Wif, bonk, sol, eth and everything else leading the way...
So this probably 5xs in the next few months lol

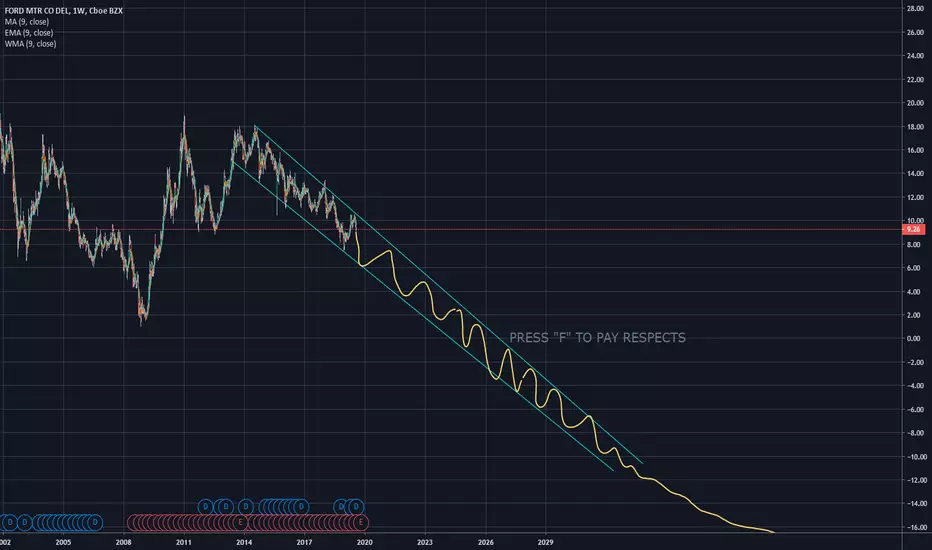
my ford target is -$16BRUH. THIS STONK AIN'T IT CHIEF. BUY TESLA AND BITCOIN IF YOU ACTUALLY WANNA MAKE MONEY. YOU MIGHT ASWEL SHORT THIS CRAP IM SORRY FORD BULLS.
OK DOOD FOLLOW ME FOR MORE GREAT TECHNICAL ANALYSIS. YOU WON'T REGRET IT M9.
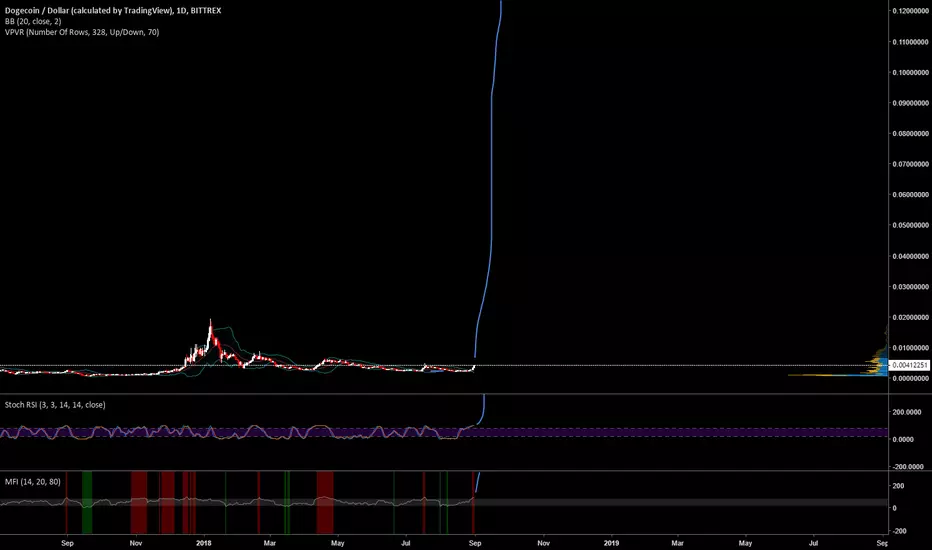
DogehDogecoin is used to facilitate purchases where fiat is not available or accessible. Over time Dogecoin will overtake fiat as it will become the dominant world currency at which point people will use fiat only to load up on more dogecoin.
Bloody Fall of EURCAD is still in session!Looking back at my chart, I should've checked to see more key levels where a reversal would be inevitable this bearish daily shark confirms and lines up with this key level. This leads me to believe that there could be a major reversal around the major psychological level of 1.61. Open multiple positions, first one should be 1.61---Open others later on as they increase until you see consolidation and wick exhaustion. (divide it into 3 positions so you can take take profit in middle, take profit 1 and the last take profit to ensure profitability)

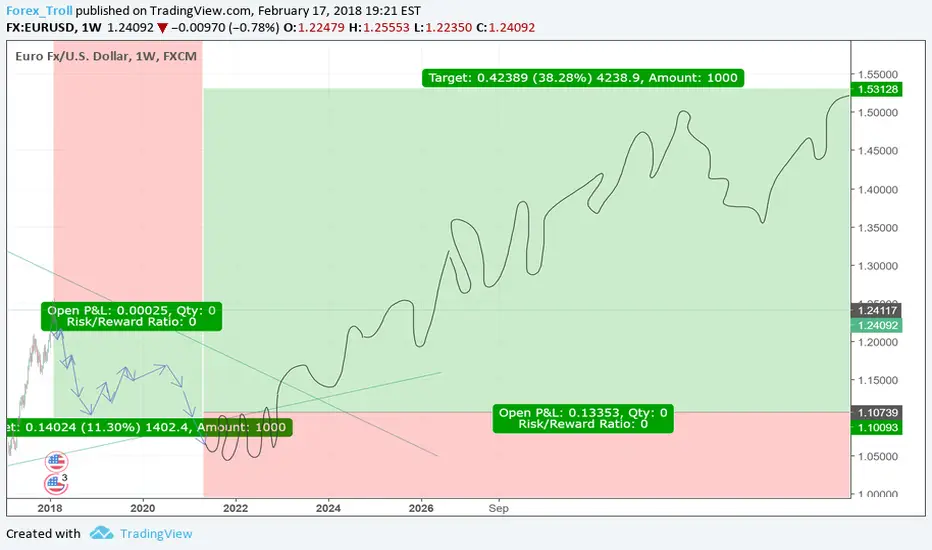
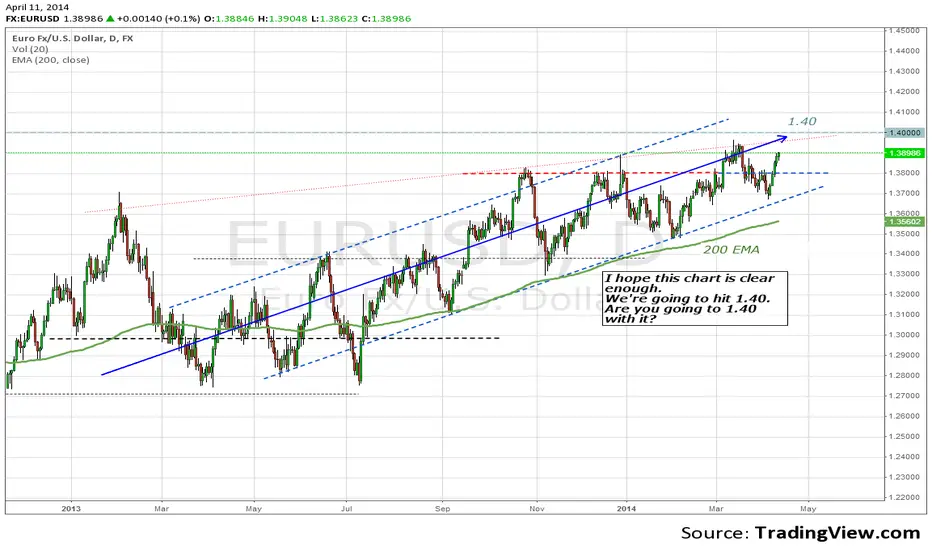
YOU WANTED A MORE SIMPLE EURUSD CHART?HEY WE'RE GOING TO 1.40 LIKE IT OR NOT.
April 14
Sorry about my cluttered charts.
Here is a simple chart for more simple traders.
Really I am a simple trader. Why make it complicated?
I knew what that line was for.
I just use Higher Highs Lower Lows
& trend lines that reveal support and resistance zone.
May 15 breaks low through support trend lines