TRON (2023) v BTC (2016)Tron (TRX) has been a legacy coin that has held its own and carved out a niche
Most legacy coins have faded away into obscurity as they've been unable to find a usecase or adoption. They may still have high market caps and may still turn things around but as of now many older coins are falling down the ranks. New coins are eating up dominance. Not for Tron. Tron has consistently been raking in fees and holding a relatively very low fee to price ratio (according to tokenterminal).
$3m in daily fees v SEED_TVCODER77_ETHBTCDATA:8B FDMC
To put into perspective.. Ethereum has had $3.4m fees in the same 24hr period and has a $200b+ FDMC. This makes Tron look wildly cheap into those isolated terms. According to Tron they'll continue using fees to burn token supply. Essentially share/token buy back program. With SEED_TVCODER77_ETHBTCDATA:1B in yearly fees and SEED_TVCODER77_ETHBTCDATA:8B in FDMC.. in 8yrs time 1 single TRX will be worth SEED_TVCODER77_ETHBTCDATA:8B (all things remaining equal.. they wont).
This creates an interesting opportunity to keep an eye on.
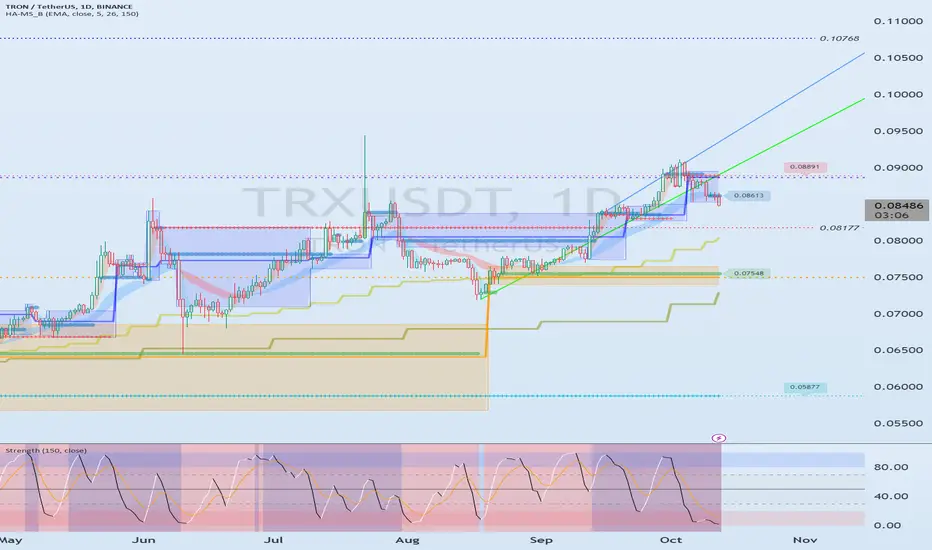
From a TA perspective we have a very bullish structure on TRX
This structure is reminiscent of BTC back in 2015/2016 in the build up to the 2017 bull market. Check video for more details on the technical side of things.
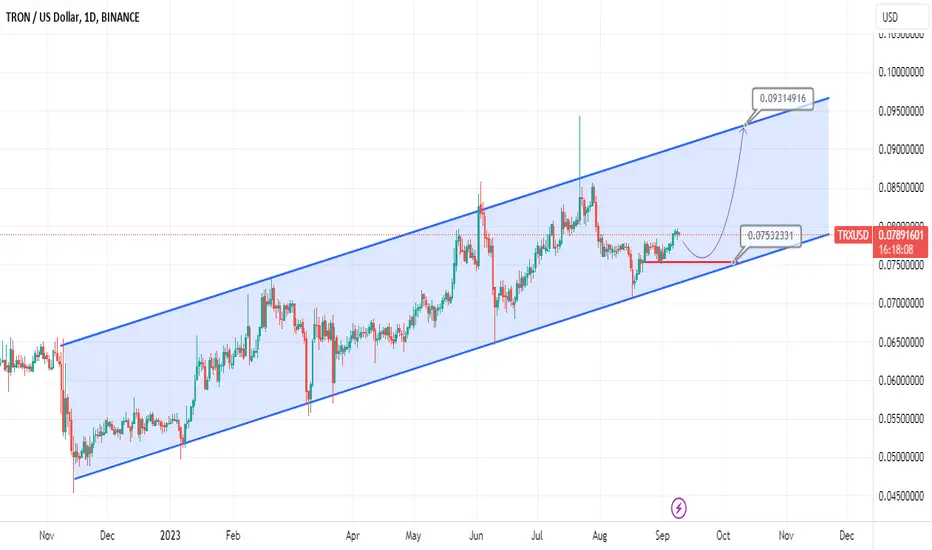
TRON

TRON Bullish ChannelHi, welcome to my analysis.
We know that many crypto perform bearish this year, but not for Tron.
This bullish channel up start from mid Nov 2022 and still perform till now.
If you wanna follow this wave, we have support line at 0.07532 or around channel up support to buy with target at 0.09314 at channel up resistance.
Don't forget to support, if you agree with this analysis.
Happy trading,
May profit be with you.
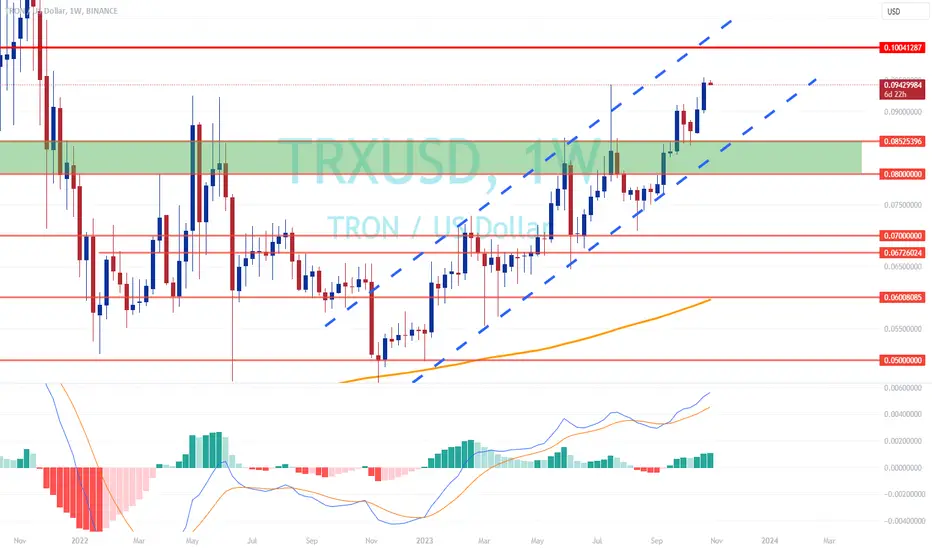
TRX to $0.10?TRX is trading within the uptrend channel.
which u can see its rally throughout the whole 2023.
$0.080 is the key level for TRX .
must hold.
MACD still favor to the bull.
next resistance $0.10
DYODD
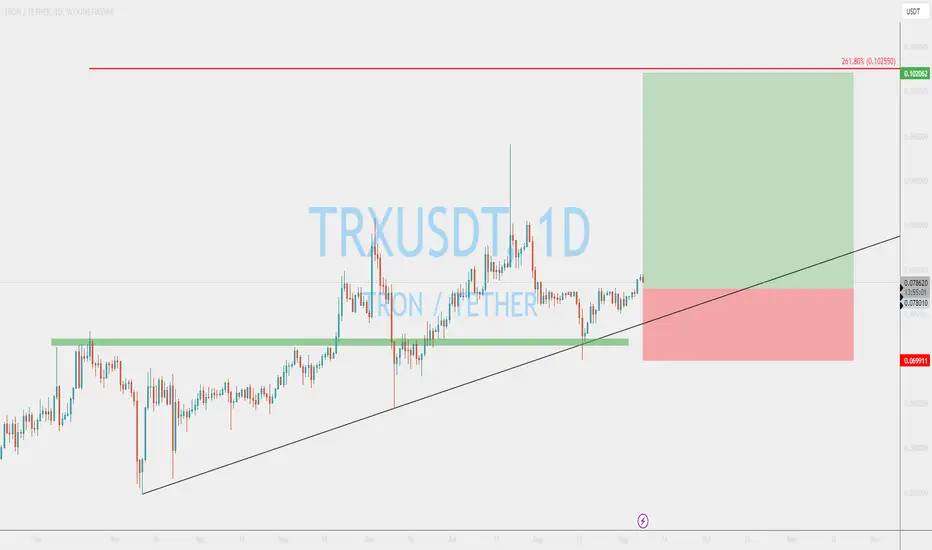
TRON ($TRX) What is Next After The SurgeUnlike the majority of altcoins, TRX began its upward trend even before Bitcoin surpassed its annual high. Currently, TRX is trading at around $0.094, marking the asset's highest price point in the last two years.
Given the ongoing positive dynamics of BTC, a continuation of this growth trend is anticipated. The last time Tron reached these heights was two years ago, rendering the old resistance levels irrelevant. After surpassing the resistance zone of $0.093-$0.094, potential next targets for buyers could be the $0.097 mark and the psychological level of $0.1.
In the event of a correction, the TRX price could fall to $0.091 and enter the buyer's zone between $0.0890-$0.0905. Below that, the support level at $0.0885 could also be tested, without posing a threat to the prevailing uptrend.

TRXUSDT Limit Long is about to TriggerTRXUSDT is clearly one of the strongest coins in the recent months. It has established a clear long-term uptrend, where the resistance has flipped into the support.
We have placed a limit order to go long on the Tron, and we expect quite a strong uptrend to start this week.
Tron clear barrel scraping!!Trx has literally been moving up now for a year! We're days away & it's amazing the consistency of the bottom of Tron. We have seen this with other tokens also and for me it's clearly obvious we're at the lowest point in crypto currently.
This is definitely leading up to the bullrun. The buy walls are in place preventing the price from falling, and the potential for upside is extremely lucrative right now!
🚀🚀🚀🚀🚀

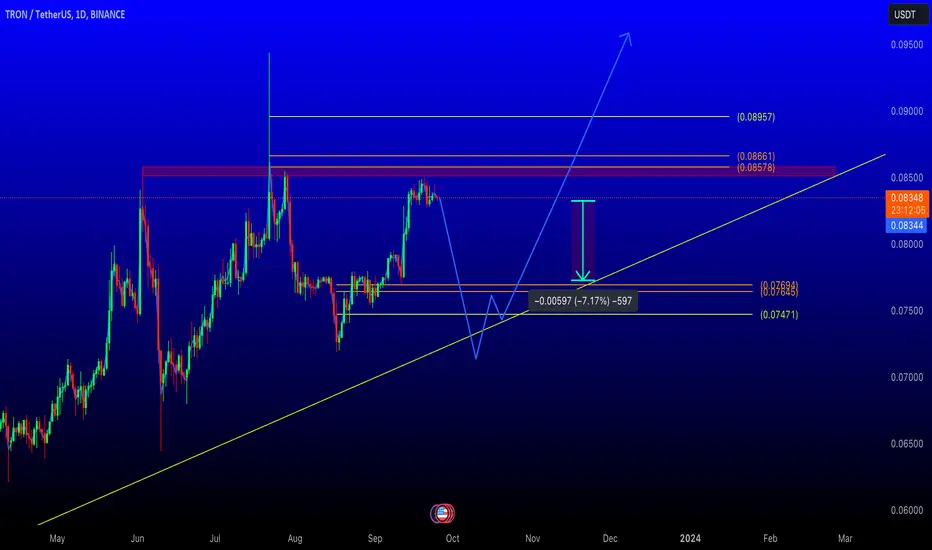
TRX short positionyou can setup short position on TRX/USDT
OPEN: 0.08957
Target: 0.08880
LEV: 15X to 35X
Capital: 30% off all capital
OK?
TRX can have a crash (has an educational point)TRX can have a crash
There is an educational tip here, pay close attention:
Educational tip: When we have long shoadow, the price tends to fill 50-60% of these shodows and then continue in the opposite direction. If a CH is in the opposite direction of the long shadow, we have more confirmation.
If more than 70% of the log is filled, it is possible to pass the log.

Above 0.07679: Expected to create a new upward waveHello?
Hello traders!
If you "Follow" us, you can always get new information quickly.
Please also click “Boost”.
Have a good day.
-------------------------------------
Since we operate a stablecoin based on TRX, a drop in price can be a very dangerous warning.
Accordingly, it is one of the coins (tokens) that must be certain about how profits will be realized during trading.
In that sense, if it falls below 0.05378, it is necessary to check the movement of the stable coin (USDD).
(TRXUSDT chart)
If the price remains above 0.07679, it is expected to create a new wave.
(1W chart)
It is necessary to check whether the price can be maintained above 0.07725 and rise above 0.11964.
(1D chart)
Since it has fallen from a rising channel, I think it is highly likely that the current trend will continue until a new trend is created.
Since the StochRSI indicator is currently in the oversold zone, it is necessary to check at which point or zone it receives support or resistance when it leaves the oversold zone.
Accordingly, it is necessary to check whether it can quickly rise above 0.08867 or be supported around 0.08177.
-------------------------------------------------- -------------------------------------------
** All explanations are for reference only and do not guarantee profit or loss in investment.
** Trading volume is displayed as a candle body based on 10EMA.
How to display (in order from darkest to darkest)
More than 3 times the trading volume of 10EMA > 2.5 times > 2.0 times > 1.25 times > Trading volume below 10EMA
** Even if you know other people’s know-how, it takes a considerable amount of time to make it your own.
** This chart was created using my know-how.
---------------------------------
2$ TRX ?Logarithmic chart shows tron in a massive triangle which is holding for now , if the market doesn’t fall bad and keep how its going and if triangle doesn’t break down then i think 2$ for trx is an appropriate target at the end of 2024 and peak cycle , it showed a good strength and also having a greatest daily usage by user , china entering and legalisation the crypto market will also be a good point for tron .

TRX/USDT bullish momentum?? 👀 🚀 Tron Today Analysis💎Paradisers, gear up for a fantastic opportunity with TRXUSDT! We're currently observing it testing resistance levels and setting the stage for a bullish ascent👀
💎Right now, we're looking at two potential scenarios. First, if the price of TRX successfully breaches the resistance at $0.08459, expect a bullish surge. On the other hand, if selling pressure remains strong and the price fails to break through the resistance, we anticipate a retest of the support level at $0.08111, where a bullish continuation could occur.
💎Additionally, if the support level at $0.08111 is broken, consider planning a short entry in #Tron. In this case, your take-profit should be set at the next support level.
Keep your charts updated and Stay one step ahead of the market 🌴

TRX CAN FALL VERY SOON (1D)The structure of TRX in the daily and weekly time frame is the same as the previous analysis. The correction has started from the place where I have marked the red arrow. It means a big diametric!
But the trx went above the red box of the previous analysis and made a stop hunt.
I think we are at the end of wave F and we will have a fall for wave G.
In the red box, we are looking for a downward trigger to enter the sell/short position.
The green area is relatively strong support.
I specified the invalidation level, closing a daily candle above this level will violate the analysis
For risk management, please don't forget stop loss and capital management
When we reach the first target, save some profit and then change the stop to entry
Comment if you have any questions
Thank You

TRXUSD - Similar Gaussian Breaks Price has broken above the Gaussian Chanel on the Weekly timeframe
This is similar to a previous event which led to a large bull run
Will it repeat?

TRX 8% Drop Likely!When taking a look at the legendary TRX, we can see that it is showing signs of weakness after failing to trade above the recent high 3 times in a rom. If price continues down, I would expect a 8% drop to the golden pocket which lines up with the horizontal support .
Every day the charts provide new information. You have to adjust or get REKT.
Love it or hate it, hit that thumbs up and share your thoughts below!
Don't trade with what you're not willing to lose. Calculate Your Risk/Reward!
This is not financial advice. This is for educational purposes only.
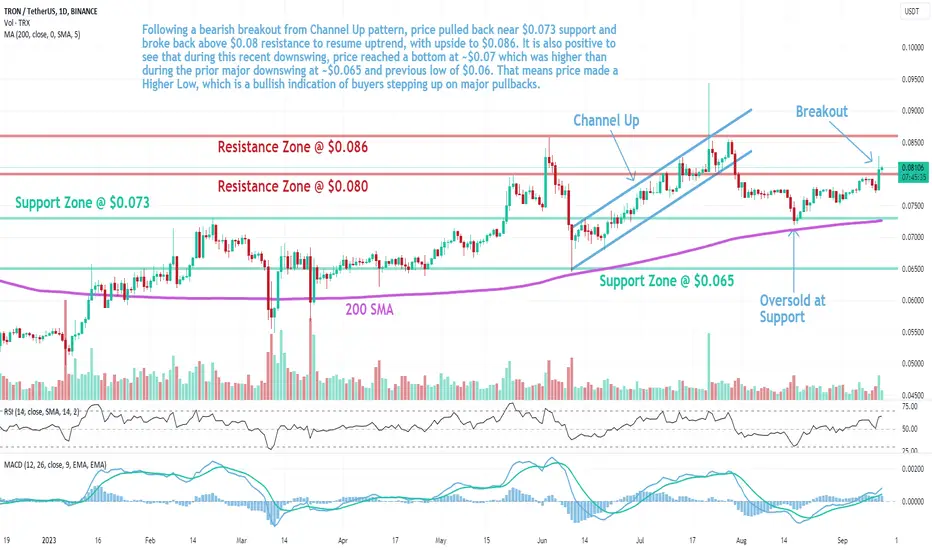
TRX: Resistance BreakoutTRON (TRX) technical analysis:
Trade setup : Following a bearish breakout from Channel Up pattern, price pulled back near $0.073 support and broke back above $0.08 resistance to resume uptrend, with upside to $0.086. It is also positive to see that during this recent downswing, price reached a bottom at ~$0.07 which was higher than during the prior major downswing at ~$0.065 and previous low of $0.06. That means price made a Higher Low , which is a bullish indication of buyers stepping up on major pullbacks.
Trend : Uptrend across all time horizons (Short- Medium- and Long-Term).
Momentum is Bullish (MACD Line is above MACD Signal Line and RSI is above 55).
Support and Resistance : Nearest Support Zone is $0.073, then $0.065. The nearest Resistance Zone is $0.080, which it broke, then $0.086.
Keep uptrend even red marketWeekly Chart
Tron BINANCE:TRXUSDT has touched 4 times and bounced back from support by ascending trend line.
Chart 4H TF
Tron is in consolidation phase in range 778 - 795. It needs to confirm the support before go up on.
Wait for next move

TRX → a head and shoulders patternhello everyone...
as you can see trxusdt made a H&S pattern but we have not any confirmation that is a reversal pattern or a continuous one, however, the daily time frame shows us a bullish trend:
but it is great if we get a position after the breakout, so if the neckline breakout you can get a long position!
_______________________________
always do your research.
If you have any questions, you can write them in the comments below, and I will answer them.
And please don't forget to support this idea with your likes and comment

What to Expect NextOn the daily chart, there's an upward trend pattern. Right now, the price is testing a barrier at $0.078. If it manages to break through this level, we can expect the price to continue rising, possibly reaching $0.085. However, if the price can't surpass this resistance, we might see it drop down to around $0.072.
Additionally, the Relative Strength Index (RSI) currently stands at 54. This level indicates a moderately strong momentum in the market. It suggests that there is some bullish sentiment, but it's not too extreme. Traders are neither overwhelmingly buying nor selling at this point.

Despite Macro Bearish Conditions TRX Remains Set for New HighsThis is a follow-up to this trade below:
TRX has been holding up here in this zone despite the bearish price action on the macro, has recently started to press up against the resistance zone above, and has also once again defended its bullish trend line. If this price action continues, we could very soon see TRX jump up to the upper end of the range at around 18 cents before pausing for a bit. The overall target for the wave structure, as can be seen in the original post, is 42 cents at a 1.618 extension, but this lower 18 cent target is for more midterm trades entering off the bullish trend line right now.

If you are interested in the TRX coin, then this is for you.Tron blockchain is necessary and I don't see much decline in it. It has performed well compared to others during the crypto crash.
The price pattern is rather good. Waiting for point c would be ideal, but I don't think that point c would be a heavy drop considering the specifics of the trx movement. Point b is also currently in progress, which already indicates a small increase.
I'm not going to analyze it further on the smaller chart because I'm not going to buy it, I just can't afford to buy everything. This analysis may help someone.
PS if you don't understand that point c doesn't have to exceed point a (abc strategy) then you have a lot to learn to understand that. it all depends on the specific location of the trend and its volume, etc.
Don't forget to follow me, I will give analysis constantly😎

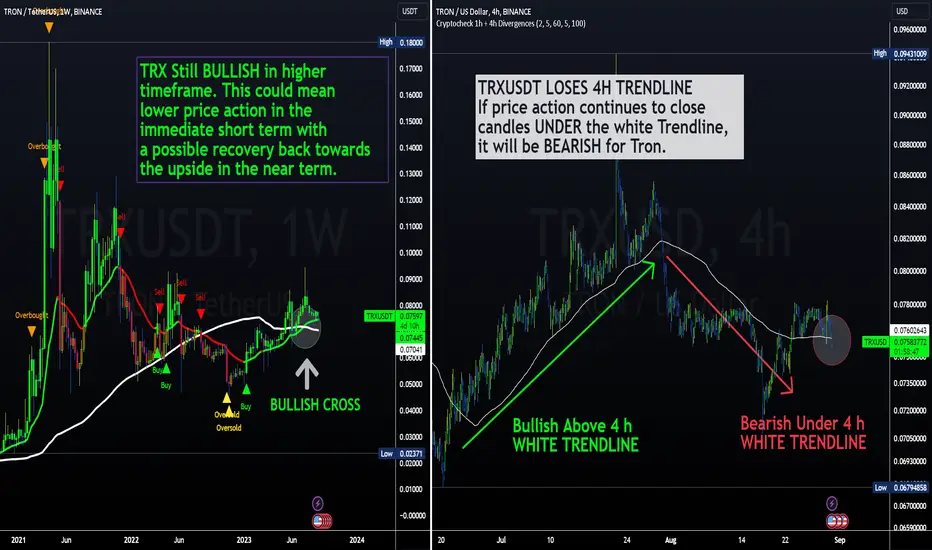
TRX Tron SELLERS Dominate Short TermHi Traders, Investors and Speculators of Charts📈📉
TRXUSDT has turned bearish in the short term Timeframe.
From a technical indicator perspective we see clearly that the trendline has been broken and now the price is closing candles UNDER the trendline. This is bearish for the short term.
However, from a weekly outlook, Tron is still bullish. This could mean that the current pullback is only a temporary correction. The price could continue lower for the short term, but bounce back up in the near term and continue the upwards trend.
For now, the best course of action seems to be observing from the sideline and look for other trading opportunities with better risk/reward setups across the altcoin market.
_______________________
📢Follow us here on TradingView for daily updates and trade ideas on crypto , stocks and commodities 💎Hit like & Follow 👍
We thank you for your support !
CryptoCheck
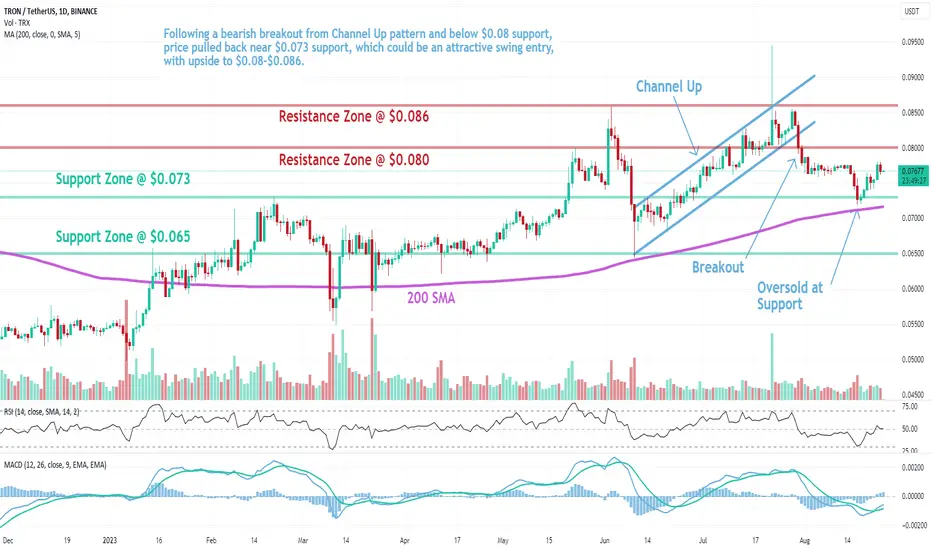
TRX: Pullback in UptrendTRON (TRX) technical analysis:
Trade setup : Following a bearish breakout from Channel Up pattern and below $0.08 support, price pulled back near $0.073 support, which could be an attractive swing entry, with upside to $0.08-$0.086.
Trend : Downtrend on Medium-Term basis and Uptrend on Short- and Long-Term basis.
Momentum is Mixed as MACD Line is above MACD Signal Line (Bullish) but RSI ~ 50 (Neutral).
Support and Resistance : Nearest Support Zone is $0.073, then $0.065. The nearest Resistance Zone is $0.080 (previous support), then $0.086.
TRX(based on NEo wave)Tron needs more time to show the structure,I think after wave g it will start a big ascending wave and its easier for analysis.
