Need to check if it can be supported around 0.07679-0.07760Hello?
Traders, welcome.
If you "Follow", you can always get new information quickly.
Please also click "Boost".
Have a good day.
-------------------------------------
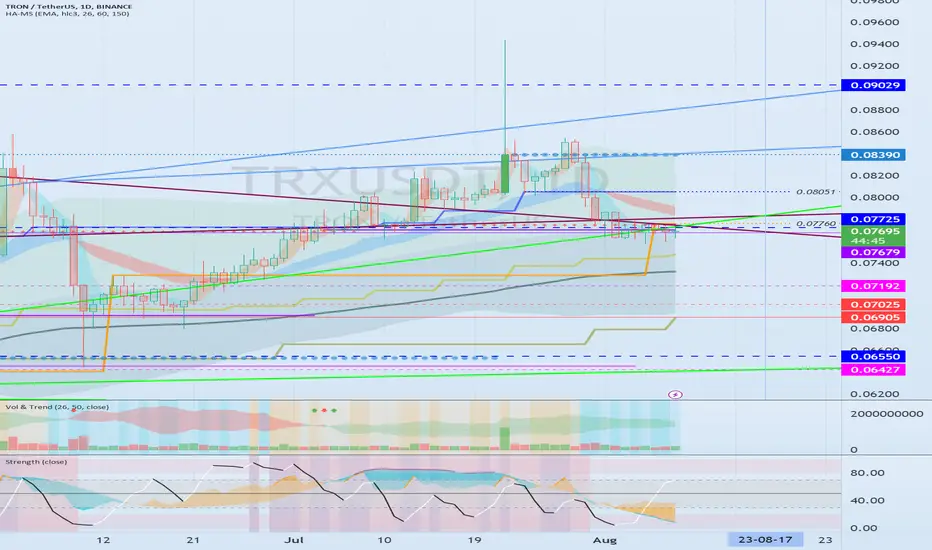
(TRXUSDT chart)
The key is whether it can get support around 0.07679-0.07760 and rise above 0.08051.
If not, and it goes down,
1st: 0.07288-0.07192
2nd: 0.06427-0.07025
You need to make sure that it is supported in the vicinity of the 1st and 2nd above.
-------------------------------------------------- -------------------------------------------
** All descriptions are for reference only and do not guarantee profit or loss in investment.
** Even if you know other people's know-how, it takes a considerable period of time to make it your own.
** This is a chart created with my know-how.
---------------------------------
TRON
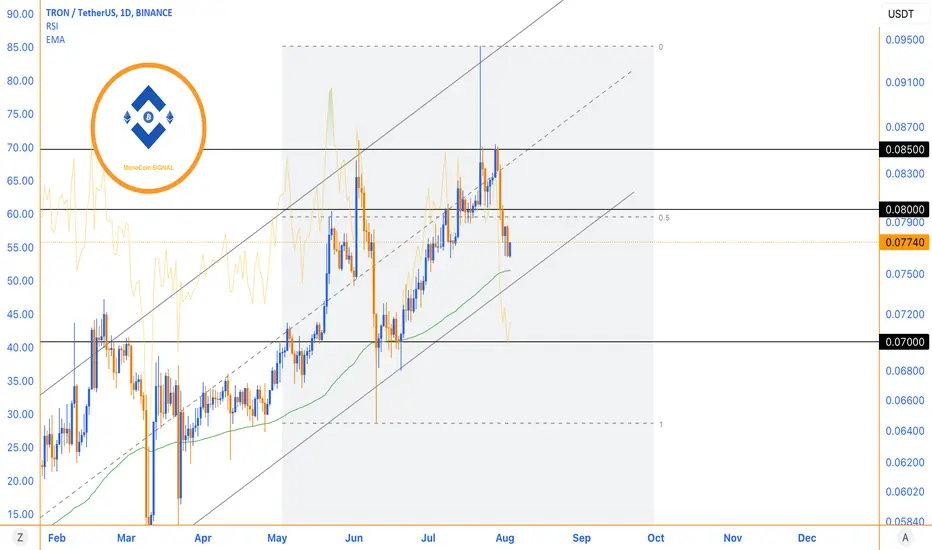
Ascending Channel Growth and Price Range ExpectationsTRX experienced significant growth within its ascending channel, surpassing the resistance of the previous ceiling and reaching a price range of $0.080. If the $0.070 level, which was previously a resistance, can now act as a support level, it is likely to trigger a positive response within this range. However, the price has recently undergone a correction, and a return to the support level may lead to renewed growth and the breaking of the previous ceiling. The primary target for TRON is the resistance range of $0.085. It is important to note that the selling pressure around the $0.080 range has reduced the likelihood of a quick reversal and a breakthrough of this resistance. Consequently, there is a possibility of forming a range zone between the current price levels.
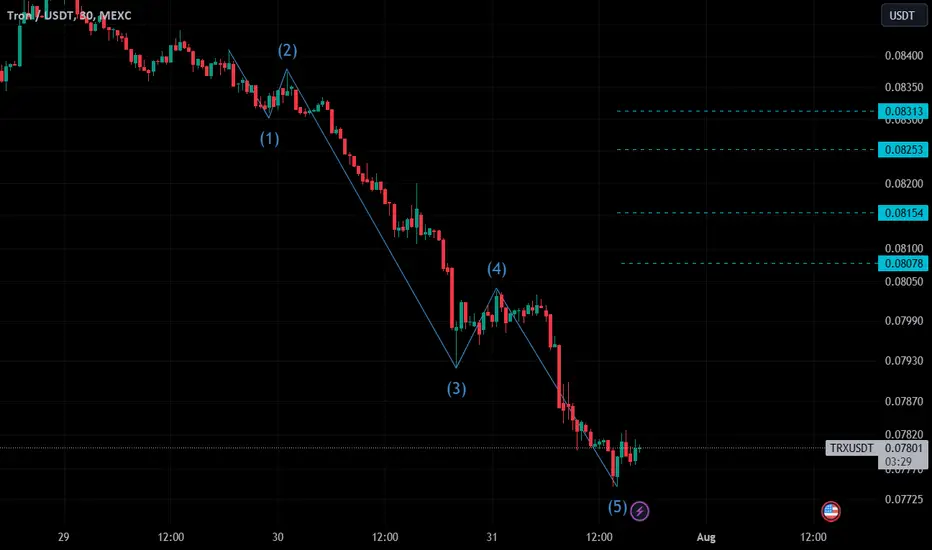
TRX Elliot Wave AnalysisAs indicated on the chart, the elliot wave cycle is completed
This is only a SPOT TRADE.
TAKE PROFIT : Levels mentioned in blue dotted lines.
STOPlOSS : Use accordingly
It can go oppsoite if btc dumps so do proper Risk Management.
NFA, DYOR
TRX: Channel Up BreakoutTRON (TRX) technical analysis:
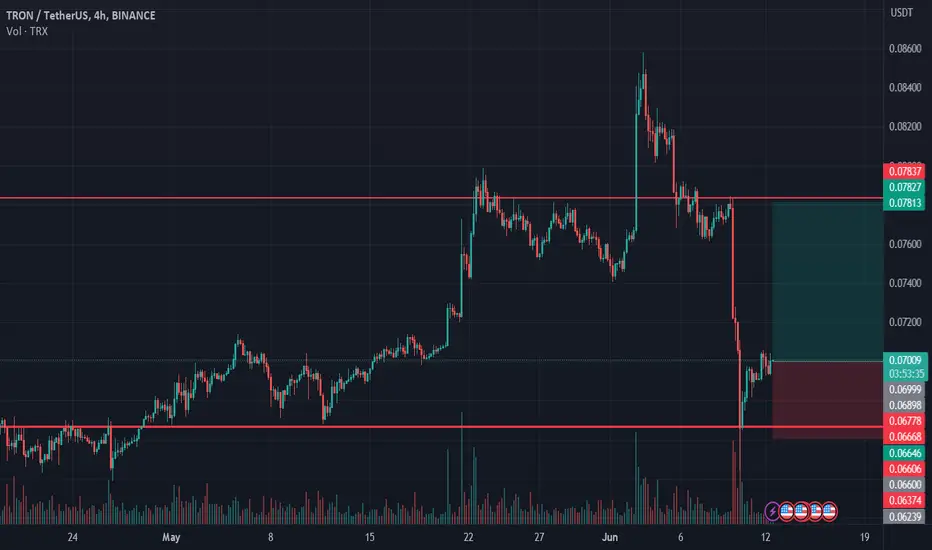
Trade setup : Price was trading in Channel Up pattern but got rejected at $0.086 resistance again, just as it did in June. Now it had a bearish breakout from Channel Up pattern and below $0.08 support. Price could pull back near $0.073 support, which could be an attractive swing entry in Uptrend.
Pattern : Price was trading in a Channel Up pattern. With complete patterns (i.e. a breakout) – initiate a trade when the price breaks through the channel’s trendlines, either on the upper or lower side. When this happens, the price can move rapidly in the direction of that breakout.
Trend : Uptrend across all time horizons (Short- Medium- and Long-Term).
Momentum is Bearish (MACD Line is below MACD Signal Line, and RSI is below 45).
Support and Resistance : Nearest Support Zone is $0.080, which it broke, then $0.073. The nearest Resistance Zone is $0.086, then $0.100.

TRX 4H ForecastTRX had a downward spike in previous market movement, and we can look at this upward price movement as a correction (CP).
Price got close to the gray order block but didn’t get a chance to enter, but if you look closer, you can see it did a Double-top with the Pin-bar shown with the red line .. and made an excellent downfall after that .. now the price is near the dynamic trend line, and was looking for good spots to enter, Here are the instructions :
1 - Price goes up to the resistance shown with line 1, which is also near the neckline in lower timeframes.
2 - After that price moves back down to Line 3, which is a Support zone in his time frame and higher time frames.
3 - next, t price moves back up to line 2, which is a golden pocket
4 - and then goes to line 4, which is the last support zone in this time frame (support zone near the price ), and that’s where the whales are waiting for you
Please leave your comments, and let's talk and share some insights.

Tron [TRX] to rebound from this ascending trendline support?Price action faced rejection at the bearish order block (OB) on H12, which aligns with the June high. Price edged lower towards a key ascending trendline support and could for new buying opportunities if the support holds.
Entry - $0.07899
Target - $0.08259
Exit - $0.07800
RR - 3.46

TRX (TRON) Coin Analysis 08/05/2021Fundamentals:
TRON is a blockchain-based operating system that aims to ensure this technology is suitable for daily use. Whereas Bitcoin can handle up to six transactions per second, and Ethereum up to 25, TRON claims that its network has capacity for 2,000 TPS.
This project is best described as a decentralized platform focused on content sharing and entertainment — and to this end, one of its biggest acquisitions was the file sharing service BitTorrent back in 2018.
Overall, TRON has divided its goals into six phases. These include delivering simple distributed file sharing, driving content creation through financial rewards, allowing content creators to launch their own personal tokens and decentralizing the gaming industry.
TRON is also one of the most popular blockchains for building DApps.
Using the blockchain and its decentralized smart contract capability, the idea of Tron is that users will experience a decentralized internet where “middlemen” such as Google and Facebook are not needed for users to access content.
To draw an example, currently the most ubiquitous video sharing platform is Youtube, which is a privately owned company with privately owned servers that stores and serves video to its viewers. However, using Youtube’s services means that creators and users have to comply with Youtube's terms of service and may have to pay for its content in one way or another. Creators on the Youtube platform may earn a share of Youtube’s revenue, but the pay structure is entirely up to Youtube’s discretion.
The TRON protocol runs on a Delegated Proof of Stake (DPoS) Governance Model. This allows users to perform transactions with close to zero-fee whilst still being resistant towards transaction spam.
Transactions on the Tron Blockchain are maintained by a consortium of Super Representatives (SR) that are voted in by TRX holders who have locked their stake in the form of Tron Power. There are 27 top-voted Super Representatives and 100 Super Representative Candidates. The hierarchy of SR and SR Candidates are readjusted every 6 hours based on the number of votes they receive from Tron Power holders.
Tron aims to replace services such as Youtube and others by becoming the decentralized infrastructure in which users can connect directly with creators and pay the creators directly for the content they wish to consume.
TRON has positioned itself as an environment where content creators can connect with their audiences directly. By eliminating centralized platforms — whether they are streaming services, app stores or music sites — it is hoped that creators won’t end up losing as much commission to middlemen. In turn, this could also make content less expensive for consumers. Given how the entertainment sector is increasingly becoming digitized, TRON could have a headstart in applying blockchain technology to this industry.
The company also says that it has a talented and experienced developer team, based around the world, that has been drawn from major companies such as Ripple Labs.
Last but not least, whereas some other blockchain projects can be opaque about their plans for development, TRON offers a point of difference by delivering a roadmap that shows its intentions for the coming years.
TRON uses a consensus mechanism that is known as delegated proof-of-stake.
TRX owners can freeze their cryptocurrency in order to get Tron Power, which means that they can vote for “super representatives” who serve as block producers.
These block producers receive TRX rewards in exchange for verifying transactions, and these rewards are then distributed among the people who voted for them.
According to TRON, this approach helps its blockchain to achieve higher levels of throughput.
TRON was founded by Justin Sun, who now serves as CEO. Educated at Peking University and the University of Pennsylvania, he was recognized by Forbes Asia in its 30 Under 30 series for entrepreneurs.
Born in 1990, he was also associated with Ripple in the past — serving as its chief representative in the Greater China area.
TRON has a total supply of just over 100 billion tokens — and at the time of writing, about 71.6 billion of these are in circulation.
When a token sale was held in 2017, 15.75 billion TRX was allocated to private investors, while an additional 40 billion were earmarked for initial coin offering participants. The Tron Foundation was given 34 billion, and a company owned by Justin Sun got 10 billion.
All in all, this meant that 45% of TRX supply went to the founder and the project itself, while 55% was distributed among investors. Critics argue that this is a much higher ratio than what has been seen with other cryptocurrency projects.
TRON price today is $0.152468 with a 24-hour trading volume of $5,391,785,654. TRX price is down -6.9% in the last 24 hours. It has a circulating supply of 72 Billion TRX coins and a max supply of 101 Billion. Binance is the current most active market trading it.
Technical Analysis:
As you can see in the Daily chart , Tron coin Value have increased from the end of April to end of March 2021 and it reached 0.18$ each. The Coin has touched Fibonacci Golden Zone and Bounced from it, What we think is that the price may fluctuate and Reaccumulate between 0.12$ and 0.16$ in order to Get ready and accumulate enough volume to shoot for TP1 ( 0.23$) and ultimately higher targets levels, which are specified by Fibonacci Projection of the Initial Impulsive Cycle.
There are few Support levels specified by Fibonacci Retracements which can stand in case of some More Fall downs.

Trx scraping the bottom of the barrel Tron is still rock bottom and as you can see still moving up dragging itself along the bottom of this channel.
So what to expect is constant gains in large percentages to break free from the uptrend line for Tron to have room for a healthy trade environment.
Therefore Tron is way undervalued. Expect the bullrun to begin, and I believe Xrp has started it.

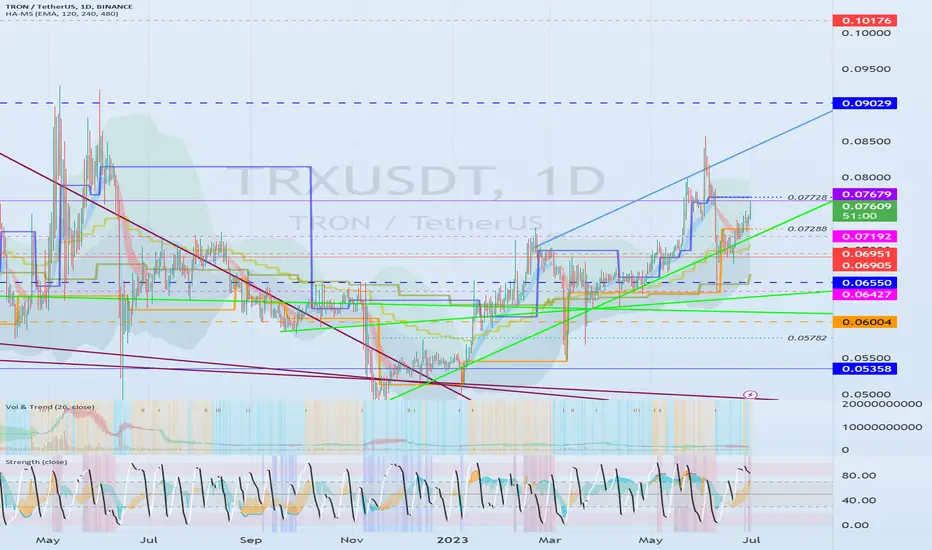
If it rises above 0.07728, a sharp rise is expectedHello?
Traders, welcome.
If you "Follow", you can always get new information quickly.
Please also click "Boost".
Have a good day.
-------------------------------------
(TRXUSDT chart)
Looking at the 1M and 1W charts, it is expected to continue its upward trend as it has risen above the respective HA-High indicators.
(1D chart)
However, since it is located below the HA-High indicator on the 1D chart, the important question is whether it can be supported by rising above 0.07728.
If support is confirmed by rising above the HA-High indicator on the 1D chart, it is expected to rise to around 0.09029.
If it rises above the HA-High indicator, it is likely to break the previous high.
However, since the volatility is highly likely to form, careful trading is required.
The HA-Low indicator on the 1D chart is formed at the 0.07288 point.
So, we need to see if we can get support and rise around 0.07192-0.07288.
-------------------------------------------------- -------------------------------------------
** All descriptions are for reference only and do not guarantee profit or loss in investment.
** Even if you know other people's know-how, it takes a considerable period of time to make it your own.
** This is a chart created with my know-how.
---------------------------------
TRX founder Justin Sun 17 days to respond to US District Court If you haven`t sold TRX here:
Justin Sun, the CEO and founder of Tron, has been served a summons by the U.S. District Court and is required to respond within 17 days to the United States Securities and Exchange Commission's (U.S. SEC) lawsuit against him for alleged fraudulent crypto trading activity.
The Southern District of New York has given Sun a deadline to reply to the complaint, and the SEC has sent the summons to both his residential and office addresses. Failure to respond may result in a judgement against Sun in favor of the plaintiff.
I expect a major selloff before the expiration date.
looking forward to read your opinion about it.

TRON longTRON bounced off the support level. Bullish movement to resistance level at 0.78 is expected to happen.
TRX Potential Death Spiral similar to Terra LUNAHistory repeats itself for those who haven't learned from it.
SEC Charges Crypto Entrepreneur Justin Sun and his Companies for Fraud and Other Securities Law Violations.
Eight celebrities also charged for illegal touting of Sun’s crypto asset securities. But let`s say the market doesn`t care about he Securities and Exchange Commission lawsuit, like we can see reflected in TRX price right now, but...
The reason for the potential collapse of TRX Tron is their stablecoin, USDD.
According to their website, USDD is secured by the over-collateralization of multiple mainstream digital assets (e.g. TRX , BTC , and USDT). The total value of collateralized assets is significantly higher than that of USDD in circulation with the collateral ratio set at 120%.
This is the USDD collateral:
TRX 10,929,535,279
BTC 14,040.6 = about $313Mil
USDT 29,964,253
USDC 39,719,839
so besides TRX , the total amount of other collateral is $383Mil for a stablecoin that has a mk cap of $724Mil.
Now let`s say TRX drops to the Covid level of $0.0072, which is not unrealistic in my opinion.
Then the TRX collateral of 10,929,535,279 coin will be worth $78,692,654.
Assuming that BTC won`t go lower, then still the liquid collateral of USDD will be around $462Mil for a mk cap now of $724Mil, which will result in a huge depegging od the "stablecoin".
Looking forward to read your opinion about it.

Tron back to ATH or Down to Next Support LevelTron flipped old weekly resistance to support and then broke up and out of a wedge. It is now re-testing the wedge.
- Successful re-test / remain above the wedge, and it will revisit just above its ATH candle close, but below its ATH wick, near the top of resistance around ~24.4 cents.
- Failed re-test may lead to wedge loss and loss of support, with a move down to the next level of support in the 1-2 cent area or ~1.2 cents

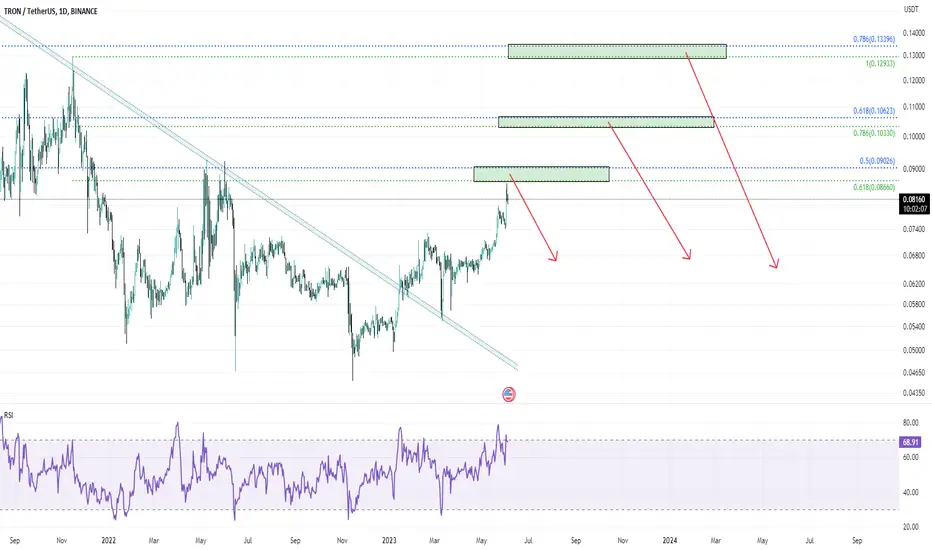
Accumulation Phase: #TRXUSD Buyers Prepare for Potential Rally💎#TRXUSDT has emerged as one of the standout performers this year, displaying remarkable resilience during the recent market downturn. The overwhelming presence of buyers is undeniable, indicating a strong likelihood of continued upward momentum.
💎It's worth noting that the price has reclaimed its position above the long-term uptrend trendline, which now serves as a potential support level. This suggests that buyers are actively accumulating, and could be setting the stage for a rapid rally in the near future.
💎We might witness a substantial 40% surge in #TRX, with a test of the 78.6% Fibonacci resistance or even a push towards the upper boundary of the long-term range. However, it's crucial to keep in mind that this bullish scenario remains valid only as long as #Tron maintains its position above the trendline.
Stay tuned and seize the opportunities, ParadiseClub members! 🌴💎

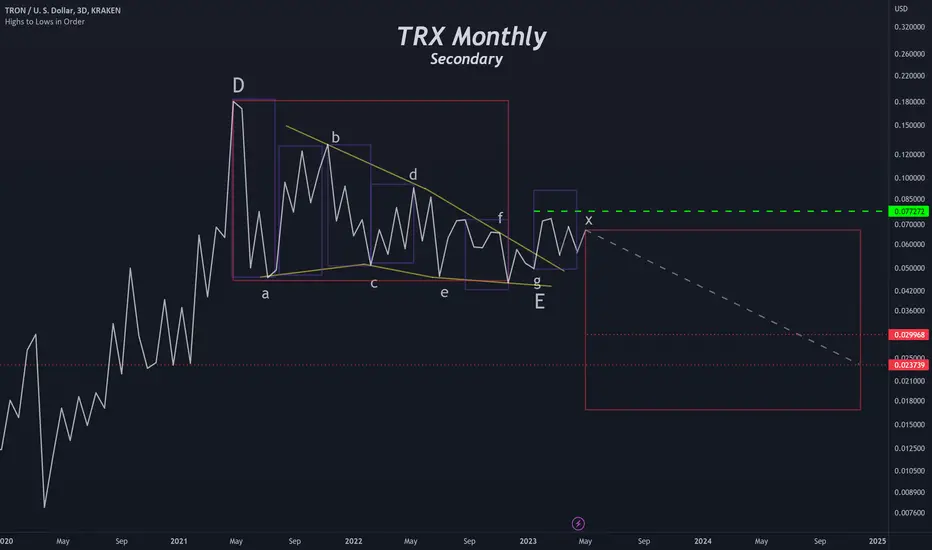
TRX Break Out Failed, Possibly Heading Under 3 cents in 2024One of the most important things in trading is forego your own wants and want what the market wants. When Glenn Neely and I first came up with the x-wave idea for BTC, I did not want to believe it was true and I continued to WANT my diametric pattern to be the end of the bear market, as it had been for the last few months. As time has gone on it gets harder to deny that what we have formed over the last few months is an x-wave, on both BTC and TRX and the vast majority of crypto assets, and that we are only a little past half way finished with this bear market that began in 2021.
The market is probably going to go to max pain from here. That means another 1-2 years of bear market and the global crypto market cap being slashed in half over that time.
This is based almost entirely on the wave forecast, which indicates the bull market over the last few months is an x-wave. The reason why this is now being considered as an x-wave instead of the beginning of a new bull run is because we did not see the required confirmatory price action following the bottom in January. We should have seen moves much bigger and faster than wave-b, what we had, especially on TRX, was a move which is far smaller and far slower than wave-b. This is not what the beginning of a new bull market looks like.
In particular on TRX it looks like it has formed a contracting triangle after wave-g, which is very weak and not at all how a bull market should begin, but it does form into a very nice looking x-wave. This is likely to be followed by another diametric which could take just as long as the previous one, and will probably be slightly shorter, taking TRX to under 3 cents. After this happens probably sometime in 2024 we will begin to see a move bringing TRX above 1 USD and probably much higher than that. Momentum is also bearish on multiple timeframes including the weekly and the monthly. Neely River Theory has also not given any buy signals on TRX yet and remains in bearish territory.
On top of that, the regulatory issues in the US, and the lack of new money coming from other parts of the world like China is a major headwind for the whole market. A Wells Notice received by Coinbase at the same time the SEC sued Justin Sun implies that Coinbase will soon be charged with operating an unlicensed securities exchange, and may have to pause and seriously wind down operations until the court case is finished. The exact timing of when this lawsuit will be filed is not clear, but one thing is almost certain is they will be sued eventually after receiving a well's notice, and the comments made by Brian Armstrong indicate they are coming after their core spot business model. This is being considered as a possible regulatory trigger for this protracted bear market, however there are many other possible events which could cause negative headwinds especially from a regulatory standpoint, like Ripple losing their lawsuit or seeing it drag on for another year or two, and further ugly developments in Justin Sun's suit or other developers being sued. The reason this is significant is because it will seriously hinder new money coming in from the US, and short of mainland China opening retail crypto exchanges it's hard to imagine anyway that new money is going to be coming into the market at the same pace as 2017 or 2013. The lawsuits against Ripple and Justin Sun are also very significant because they hinder big developer's ability to effectively market their cryptos to US-based persons, or even through social media platforms like Twitter which may have US citizens browsing on there, opening developers up to liability if they advertise on these platforms or within the US, again severely reducing the flow of new money into the market, which is required for any real bull market to emerge.
Whatever the eventual trigger is for this bear market, most important to this analysis is the Wave theory which indicates, based on the rule of reverse logic, that we are only near the middle of this bear market and this could drag on until next year. As much as I didn't want to believe this at first and I wanted to assume even if we do get a wave down it will be quick, that is most likely not what the market wants. Based on the best wave analysis possible, all signs point to this going to max pain, which is a very deep, protracted bear market that could drag on well into next year.
The attitudes of many traders I have seen, especially to bearish ideas, are an echo of the peak in November 2021 which I called almost perfectly. The regulatory headwinds are also an echo of the SEC's DeFi crackdown which began in late 2021. And the wave theory and technical indicators here are clear and convincing, just like in 2021. Over leveraged crypto firms like Microstrategy and some BTC miners that are at risk of collapse during a protracted bear market are an echo of Luna, 3AC, and FTX. There may still be some small upside left in wave-x, but short of a massive breakout which would need to go almost completely vertical and send us flying past the velocity of wave-b (which is very unlikely), then we are probably going to form a top here very soon and begin a major decent towards max pain, finally squeezing out these over leveraged crypto firms and creating a temporary fire sale of cryptos.
TRX📊 #TRXUSDT
⏱ TIME: 1D
📝Divergence on RSI in a 4h or daily time frame as well as candlestick patterns or classic patterns can potentially lead the price downward
❌These analyzes are just to give a better perspective for you dear ones
Do not base on buying and selling❌
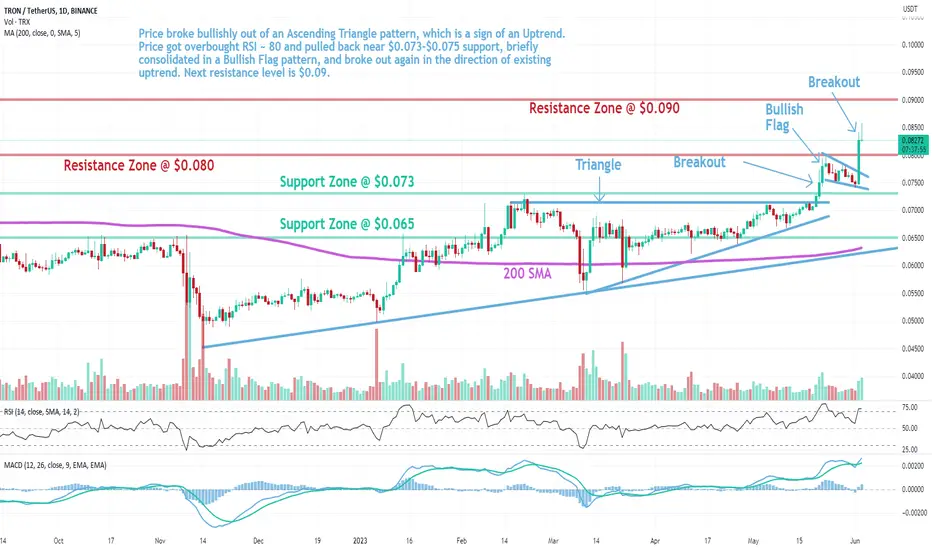
TRX: Bullish Flag BreakoutTRON (TRX) technical analysis:
Trade setup : A rare asset that’s remained in an uptrend despite the overall market correction, signaling robust demand from buyers. Price broke bullishly out of an Ascending Triangle pattern, which is a sign of an Uptrend. Price got overbought RSI ~ 80 and pulled back near $0.073-$0.075 support, briefly consolidated in a Bullish Flag pattern, and broke out again in the direction of existing uptrend. Next resistance level is $0.09.
Pattern : Bullish Flag pattern. Short term small rectangle trading range between diagonal parallel lines. It moves counter to the prevailing price trend observed in a longer time frame on a price chart. It forms typically following a sharp advance and often indicates a small change in direction (or areas of consolidation) before the previous trend resumes. Flag pattern is among the most reliable continuation patterns that traders use because it generates a setup for entering an existing trend that is ready to continue. Trade is initiated on a breakout, if it is in the same direction as the prevailing trend. Also, with bullish flag patterns, traders prefer a breakout with an increase in volume but it isn’t a must.
Trend : Uptrend across all time horizons (Short- Medium- and Long-Term).
Momentum is Bullish (MACD Line is above MACD Signal Line and RSI is above 55).
Support and Resistance : Nearest Support Zone is $0.073, (previous resistance) then $0.065. The nearest Resistance Zone is $0.080, which it broke, then $0.090.
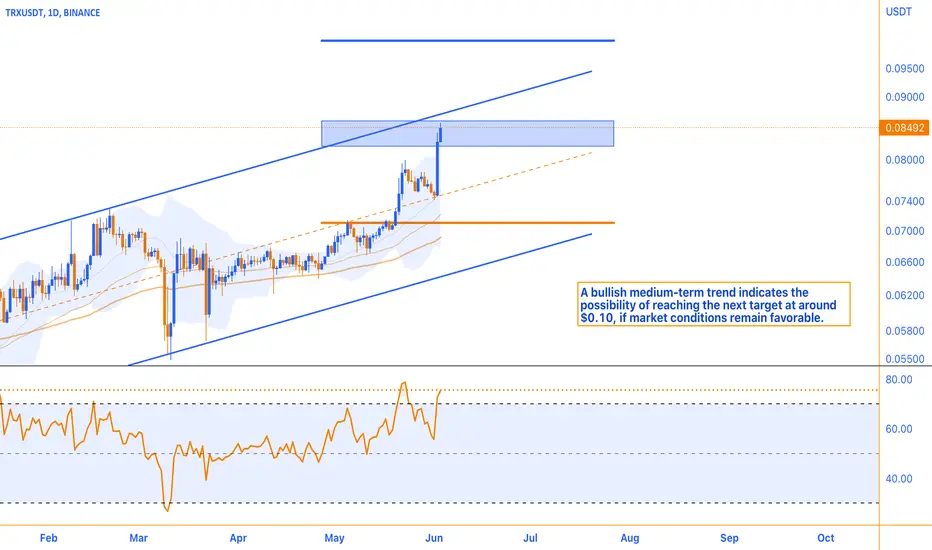
TRX Shows Strong GrowthTRX has experienced a growth rate exceeding 10% as a result of renewed demand, reaching the specific resistance range of $0.082-0.086. It is noteworthy to observe that this resistance level has historically elicited significant market reactions. Additionally, the price movement has consistently progressed towards the upper boundary of the medium-term ascending channel. Consequently, there exists a potential for the price trend to consolidate beneath this resistance level. The medium-term outlook for Tron remains optimistic, and under favorable market conditions, a successful breach of the current resistance level may lead to a plausible next target within the $0.10 range.
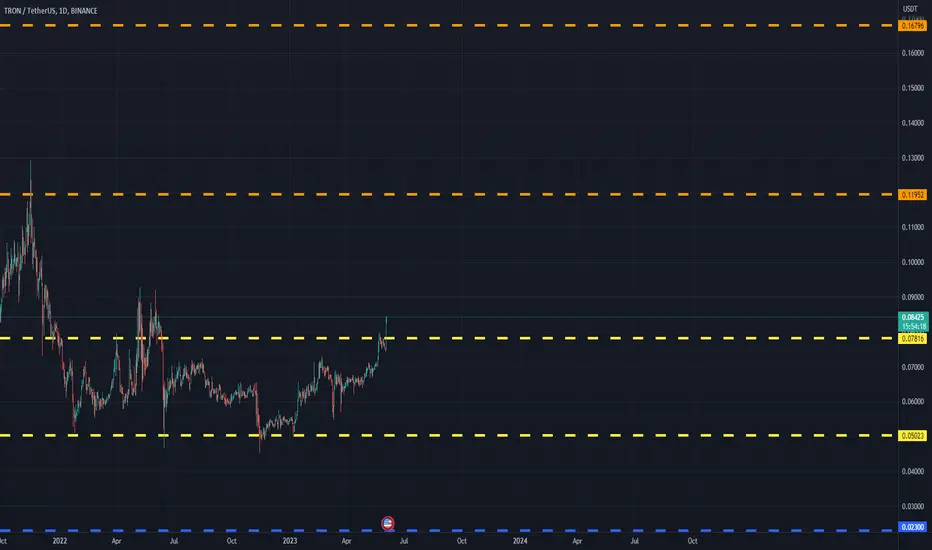
TRXUSDT(TRON) Daily tf Range Updated till 03-06-23TRXUSDT(TRON) Daily timeframe range. we all know what alt this is. #0.07816 is a solid level we can see last several times fakeout and failed here, so gotta be careful here and potential of setup here too. clearing here can lead the price to jump in above zone.
TRX: Bullish FlagTRON (TRX) technical analysis:
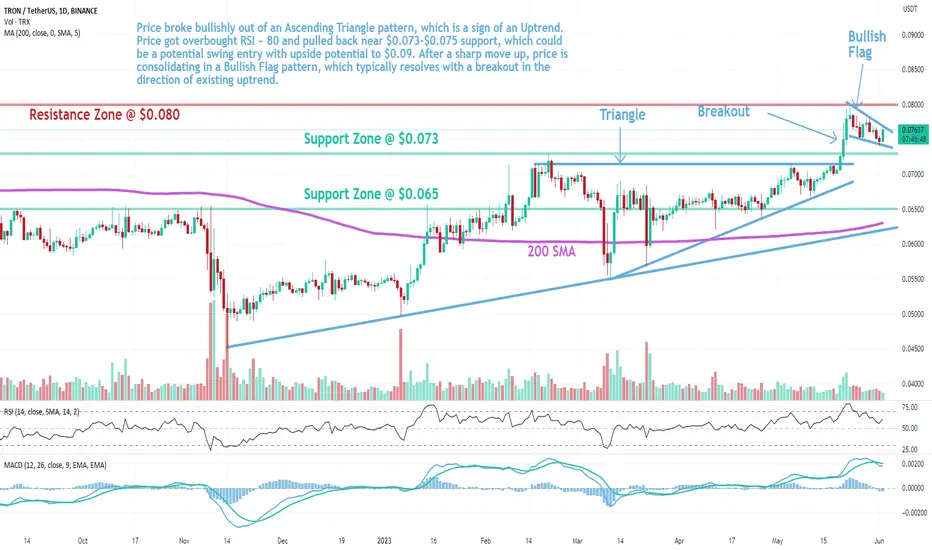
Trade setup : A rare asset that’s remained in an uptrend despite the overall market correction, signaling robust demand from buyers. Price broke bullishly out of an Ascending Triangle pattern, which is a sign of an Uptrend. Price got overbought RSI ~ 80 and pulled back near $0.073-$0.075 support, which could be a potential swing entry with upside potential to $0.09. After a sharp move up, price is consolidating in a Bullish Flag pattern, which typically resolves with a breakout in the direction of existing uptrend.
Pattern : Bullish Flag pattern. Short term small rectangle trading range between diagonal parallel lines. It moves counter to the prevailing price trend observed in a longer time frame on a price chart. It forms typically following a sharp advance and often indicates a small change in direction (or areas of consolidation) before the previous trend resumes. Flag pattern is among the most reliable continuation patterns that traders use because it generates a setup for entering an existing trend that is ready to continue. Trade is initiated on a breakout, if it is in the same direction as the prevailing trend. Also, with bullish flag patterns, traders prefer a breakout with an increase in volume but it isn’t a must.
Trend : Uptrend across all time horizons (Short- Medium- and Long-Term).
Momentum is Mixed as MACD Line is below MACD Signal Line (Bearish) but RSI > 55 (Bullish).
Support and Resistance : Nearest Support Zone is $0.073, (previous resistance) then $0.065. The nearest Resistance Zone is $0.080, then $0.090.
Tron Adam & Eve ProjectionTRX is on its way to print an Adam & Eve pattern. It's definitely set to test the local ATH and as a result print a cup & handle pattern too.
This is NOT FINANCIAL ADVICE
TRX: Ascending Triangle BreakoutTRON (TRX) technical analysis:
Trade setup : A rare asset that’s remained in an uptrend despite the overall market correction, signaling robust demand from buyers. Price broke above the Ascending Triangle pattern, which is a sign of an Uptrend. However, price is getting overbought RSI ~ 80. Wait for price to pullback near $0.073. This could be a potential swing entry with upside potential to $0.09.
Pattern : Ascending Triangle which is a continuation pattern (it typically breaks out in the direction of existing trend). Most traders wait for a breakout but Swing traders could trade between the trendlines (Buy at Support, Sell at Resistance) as long as the trendlines are still relatively far apart.
Trend : Uptrend across all time horizons (Short- Medium- and Long-Term).
Momentum is Bullish (MACD Line is above MACD Signal Line and RSI is above 55).
Support and Resistance : Nearest Support Zone is $0.065, then $0.058. The nearest Resistance Zone is $0.073, which it broke, then $0.090.

Bitcoin is breaking out above the resistance trend line.Bitcoin has broken out above the resistance trend line which is also the upper line of the triangle we anticipated on previous analysis as the bearish pennant structure. However, still there isn't any confirmation for the continuation for this breaking out. Must wait the break also on this horizontal resistance at $27465 level. Also look at the TRX as the hotlist coin for today.
