Tron TRX - Bad NewsHey Guys and Gurls!
Hope you're having a great day!
It's sunny in Incheon, but there are some dark clouds in the Tron-verse...
Justin Sun is reportedly withdrawing millions or billions of TRX...:
JUST IN: Tron withdraws 948 million #TRX ($48M) from Binance "to safeguard the blockchain industry and crypto market."
-From WatcherGuru tweet
Also this article:
watcher.guru
TRX is pretty surely going downward, so we can trade the pullbacks on the way down, and take profits on the "breakdowns".. However you feel confident to trade.
I try to make sure I only go short when stochastic RSI is overbought, on higher and shorter timeframes. (higher most important, but timeframe depends on your leverage... Higher leverage requires higher "sniper"-accuracy in the entry price.
Okay, enough for now, Good luck, and God bless! :)
-Thomchris777
TRON


SELL TRX SUPPORTTRX has the largest open interest in exchages meaning a lot of positions are being opened! Justin sun is afraid of losing the USDD stability like the UST nightmare. In these current market conditions I won't long the support as fundamentals are agains me.
Starting from New york open, markets will be very volatile because of fear from fed interest rate decision with the leaked data indicating a 75bps hike!
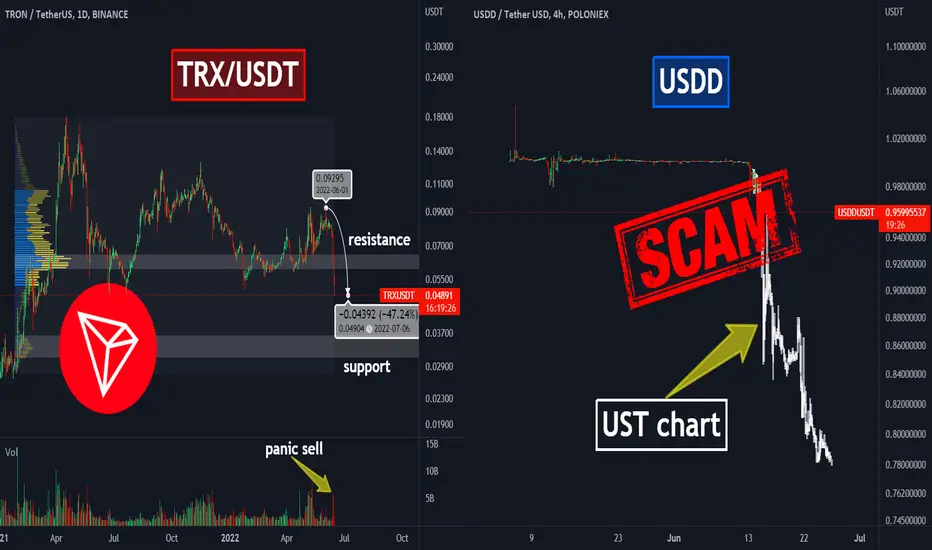
📊Are TRX and USDD next SCAM coins? $3B to save the peg!Should you have to short the TRON with x20 leverage? In this idea i explain you all pros and cons for traders in the current situation.
📊USDD is the alghoritmical stablecoin that start to lost it`s peg with USD. This is very similar to the case of UST that lost it`s peg a month ago. Of course you remember the Luna and Luna 2.0 that lost almost all capitalization because of UST peg.
🔶Will it happen to TRX? Now CEO of the Tron (TRX) announce additional money flow to protect the USDD(Tron stablecoin) to dave it`s peg to USD (1:1). There is about $3 billion in reserves right now to save Stablecoin and Tron project but peg is continuing to fall.
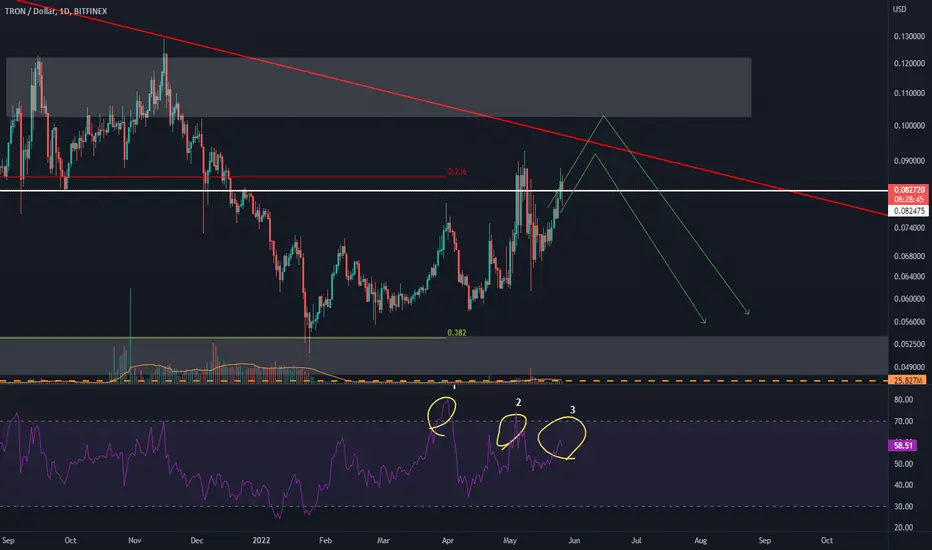
🔶Should i sell or buy TRX? Friends, check this idea that was published at May 9. When TRX pumped i tell that is not the best time to buy it. After the second liquidity collection of the value area it fell for -46%(!).
At the current situation the value area of $0.3-0.33 could become the huge support for the price and revesal point.
The value area of $0,59-0,66 is the resistance for the price. And if the TRX return to this area it will be hard to break it.
As you can see at the volume indicator the bars are not even renew it`s higs or previous highs.
🔶 No one knows what happend to price but technical analysis in combination with volume indicator could help you to open a trade and understand the nest price movements.
✅Now after -46% DUMP i don`t reccomend you to gamble. Better to save the money to the possible bullish trend in 1-2 year or use small part of your depo to stufy trading this situations. Actually, i don`t recommend you to trade such dumps without using trading strategy as it was with lunatics at Luna 1.0 dump. They almost destroyed.
Additionally, today is the a day of uncertainty. The FED meeting can dump the stock and crypto markets after rate hikes to 0,75%!
🏁Traders, write your thoughts about current situation with Tron. Will the USDD lost it`s peg and we need to open a short or it skyrocket to the moon in 2-3 months?
💻Friends, press the "like"👍 button, write comments and share with your friends - it will be the best THANK YOU.
P.S. Personally, I open an entry if the price shows it according to my strategy.
Always do your analysis before making a trade.
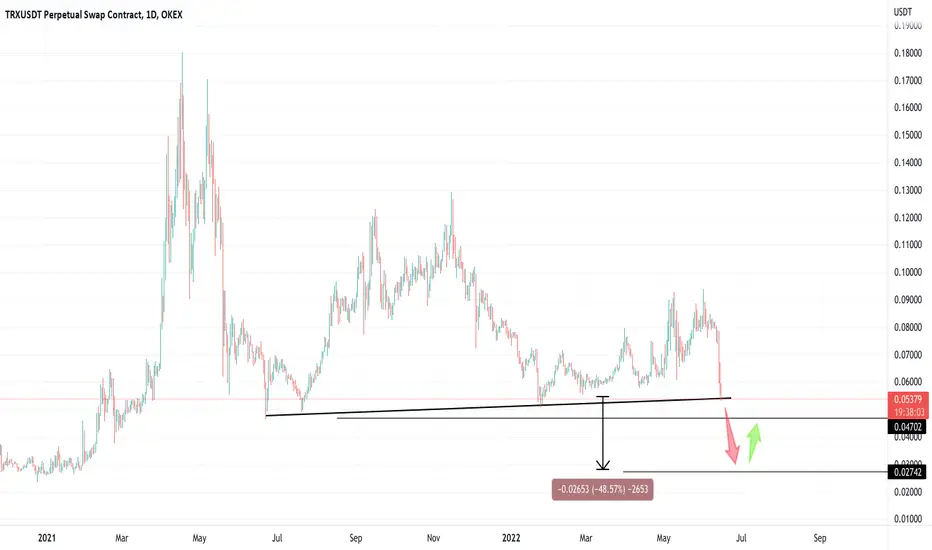
TRXUSDT BIG DUMPMake sure to LIKE and FOLLOW for more valuable content
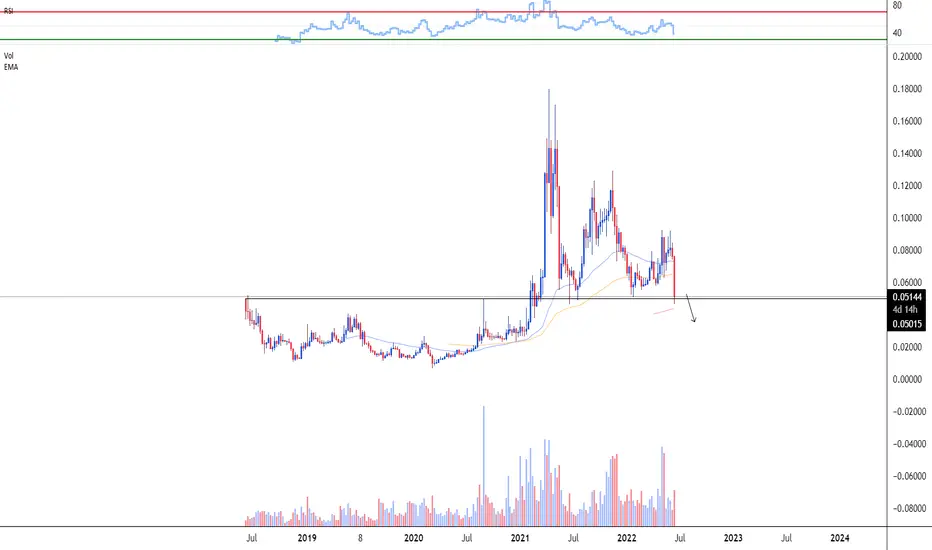
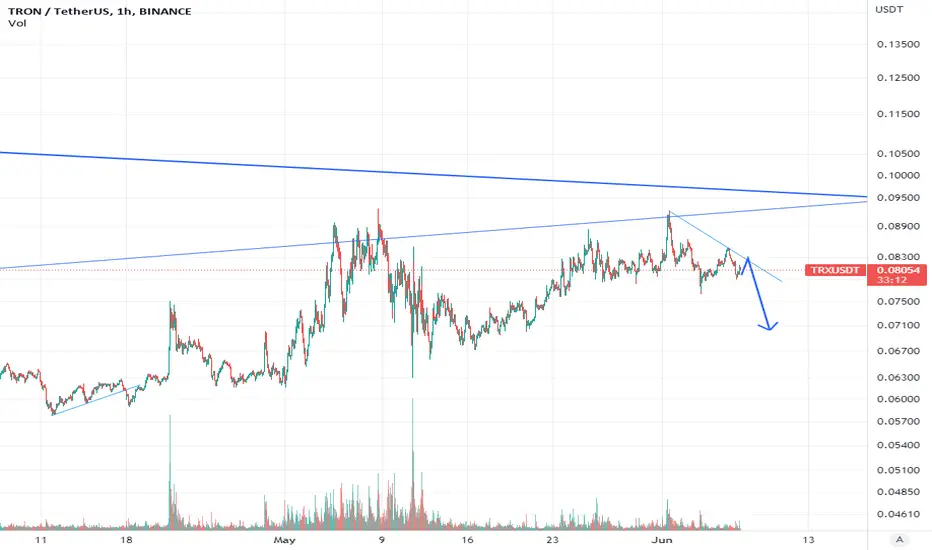
TRX nearly breaking longterm trendline supportexpect to see -35% drop
TRX / USDT - shortI look at the simple chart
This is what I see in the chart
I think more shedding is on the way
Log in with your capital management
TRON Deploys $700 Mln To Support USDD StablecoinDespite initially outperforming amid the recent crash, TRON (TRX) prices have dropped by over 16% in the last 24 hours. In order to defend and build support, Justin Sun, TRON head has planned to deploy over $2 billion.
With the USDD stablecoin briefly losing its peg, Tron deployed $700 million to support the stablecoin and maintain redemptions.
Justin Sun in a Twitter post highlighted that the funding rate of shorting TRX token on the world’s biggest crypto trading platform, Binance has redhead 500% ARP. The announced amount will help them to fight it. He added this situation won’t last for even 24 hours.
The TRON DAO informed that to counter the current situation they have received 700 million USDC. This amount will be used to defend the USDD peg. It added that its collateralization rate is nearly 300%. In another update, it mentioned that DAO has added 100 million USDC to the Binance to buy more TRX.

tron/usd ready for landing...After analyzing the TRON, weakness in uptrend is observed. Due to the market momentum, there is a possibility that TRON will crash. but first, set a trigger for entry position and do not forget about SL
trade with your choice

long TRX$TRX is bouncing off the support level. Bullish movement to resistance level at 0.0754$ is possible.

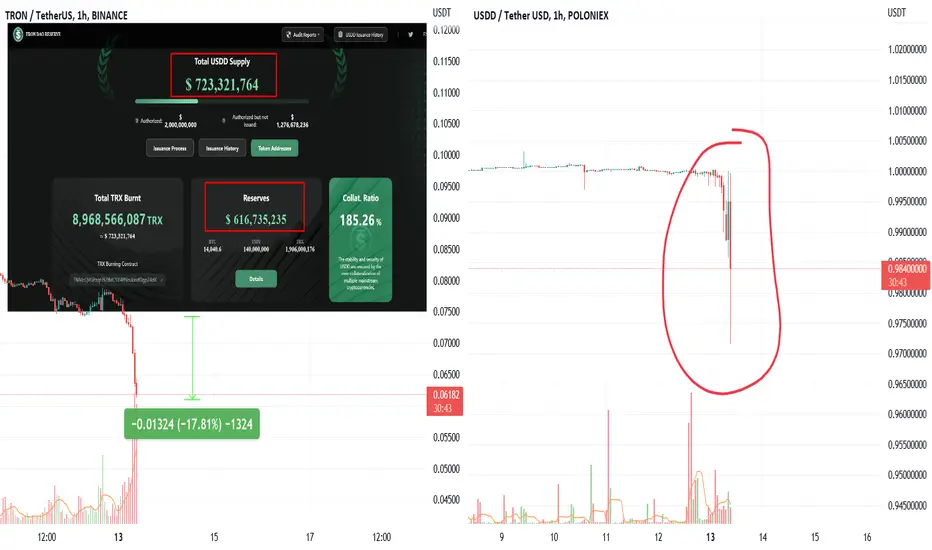
Tron is dying? New Luna?😱😱😱Tron dropped 18% and looks like it only accelerates.
It may be connected to problems with it's stablecoin - USDD. At the picture you can see that reserves cover only 90% of supply.
How death spiral may look like?
As people start to sell USDD, USDD will have to sell TRX to keep itself stable, TRX drops in price, reserves become even smaller and so on.
I advise you to be careful with TRX for now and keep your savings in other stablecoins if possible. A lot of people believed LUNA wouldn't fail because it's such a big project but it still happened.

TRON - DOWNSIDEimmediate downside, breaking the consolidation.
Three-waves move down likely to be a wave b, followed by a spike. And, eventually, another leg down to complete a large corrective pattern, with the complex wave (b).
Trade safe


TRX Going to Down??Yesterday the news of TRX gained so much attention about the USDD that it shoot for more than 17%. Right now it is in the cooling phase , but Tron is know for doing something opposite in the market so I have a neutral view, but if the price breaks in either direction I will open a trade.
Please Like, Share and Comment.

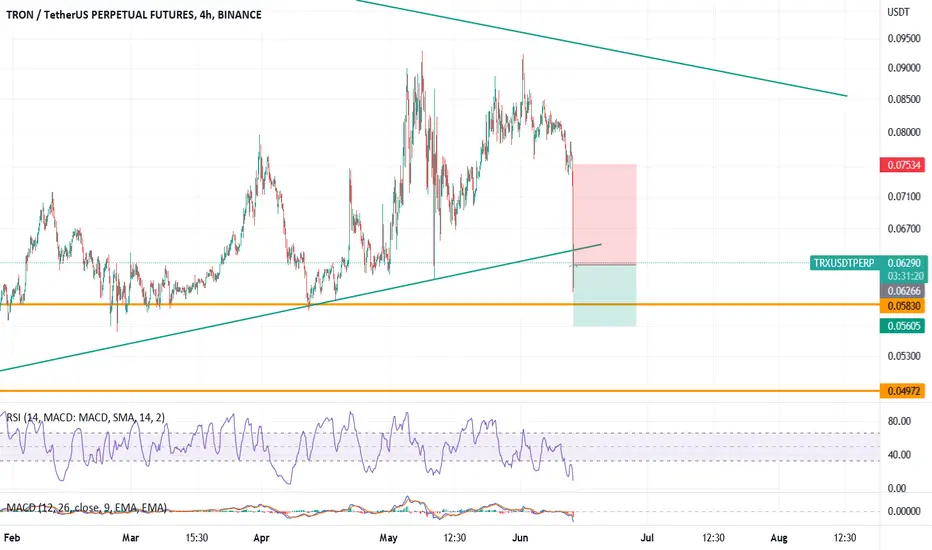
TRON TRX short Entry Range, Take Profits and Stop LossTRX/USDT short
Entry Range: $0.075 - 0.081
Price Target 1: $0.072
Price Target 2: $0.064
Price Target 3: $0.057
Stop Loss: $0.091

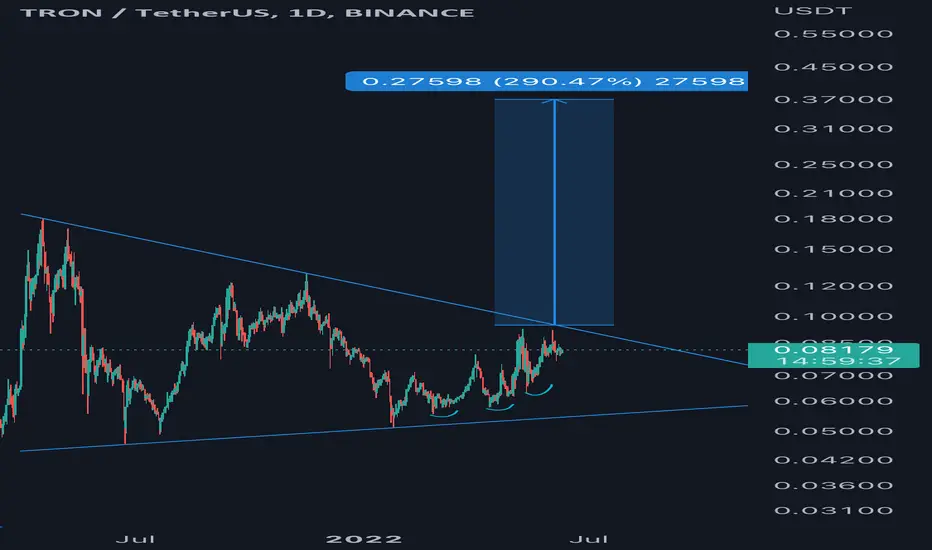
Tron looking bullish Tron /trx has been consolidating for over a year and a break of 0.093 could usher in a major impulse towards the 0.30 area
TRON (TRX) - June 8hello?
Traders, welcome.
If you "follow", you can always get new information quickly.
Please also click "Like".
Have a good day.
-------------------------------------
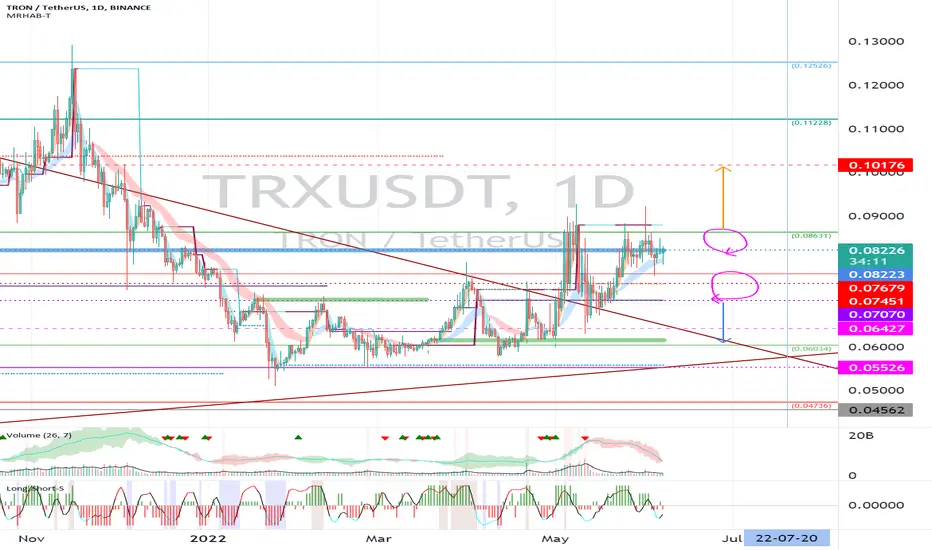
(TRXUSDT 1W Chart)
From a mid- to long-term perspective, if the price holds above 0.07192, we expect the uptrend to continue.
However, the key issue is whether it is supported by rising above 0.08631, the primary resistance section.
(1D chart)
If it finds support and rises in the 0.08223-0.08631 section, it is expected to surge.
So, the key is whether it can move higher than 0.08631.
(buy)
- After confirming the support in the section 0.08223-0.08631
(Stop Loss)
- When resistance is received by falling in the range of 0.07451 - 0.07679
- When it falls below 0.07070
(Sell)
- When receiving resistance in the range 0.11228-0.12526
------------------------------------------------------------ -----------------------------------------------------
** All indicators are lagging indicators.
Therefore, it is important to be aware that the indicator moves accordingly with the movement of price and volume.
However, for convenience, we are talking in reverse for the interpretation of the indicator.
** The MRHAB-T indicator used in the chart is an indicator of our channel that has not been released yet.
** The OBV indicator was re-created by applying a formula to the DepthHouse Trading indicator, an indicator disclosed by oh92. (Thanks for this.)
** Support or resistance is based on the closing price of the 1D chart.
** All descriptions are for reference only and do not guarantee a profit or loss in investment.
(Short-term Stop Loss can be said to be a point where profit and loss can be preserved or additional entry can be made through split trading. It is a short-term investment perspective.)
---------------------------------
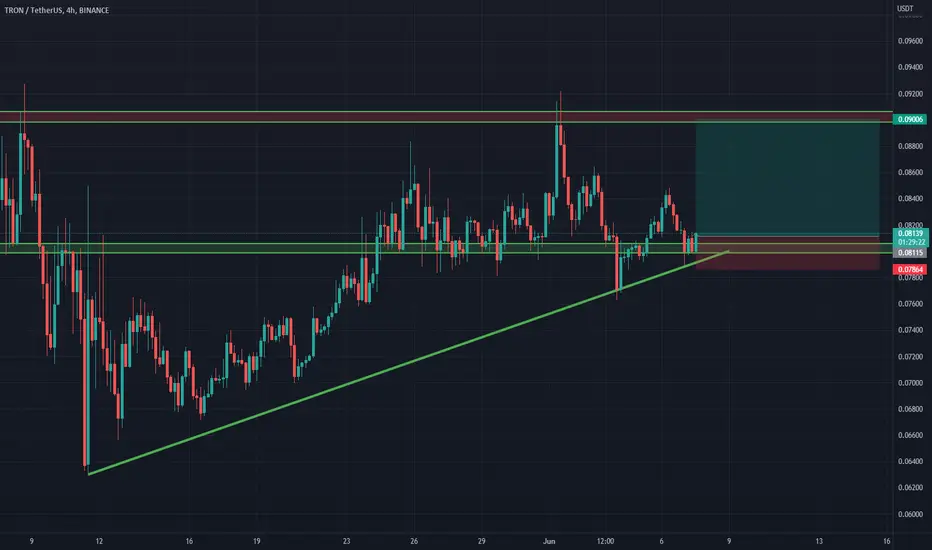
lomg TRON $TRX is bouncing off the ascending trendline. Bullish movement to resistance level at 0,09$ is likely to happen.
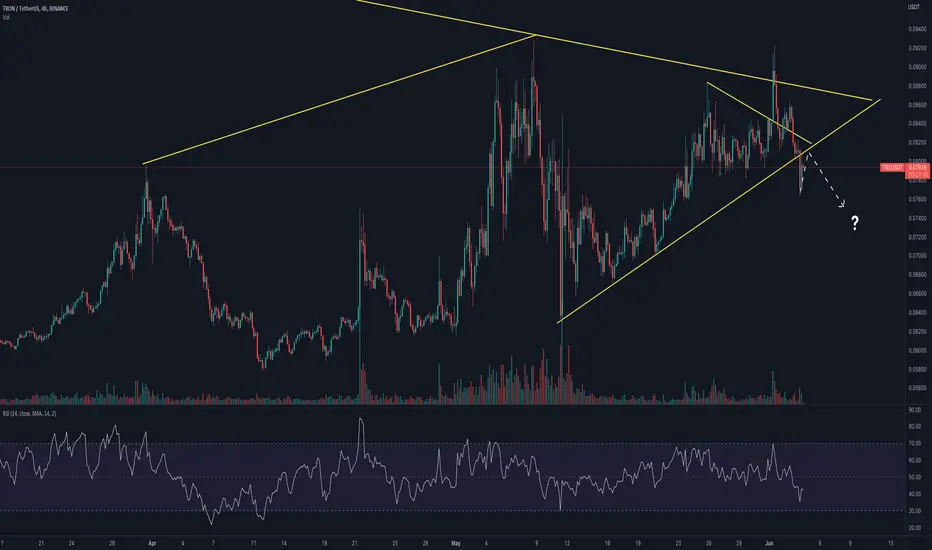
A chance to get good Shor position TRONIN 4H the chart has the double top pattern with medium divergence in RSI indicator
We have a downward trend line and around 0.0823 there is good position to get short.
0.07 can be a good target for that.
Be careful and goodluck!
TRX Tron falling wedgePrice action has been bound to a rising channel since march. Currently a falling wedge has printed and break out will get price to test the channel midline. If TRX remains bullish it will test the the channel resistance. Breakout of the channel will send price to 0.1295.
CCI about to breakout of its downtrend.

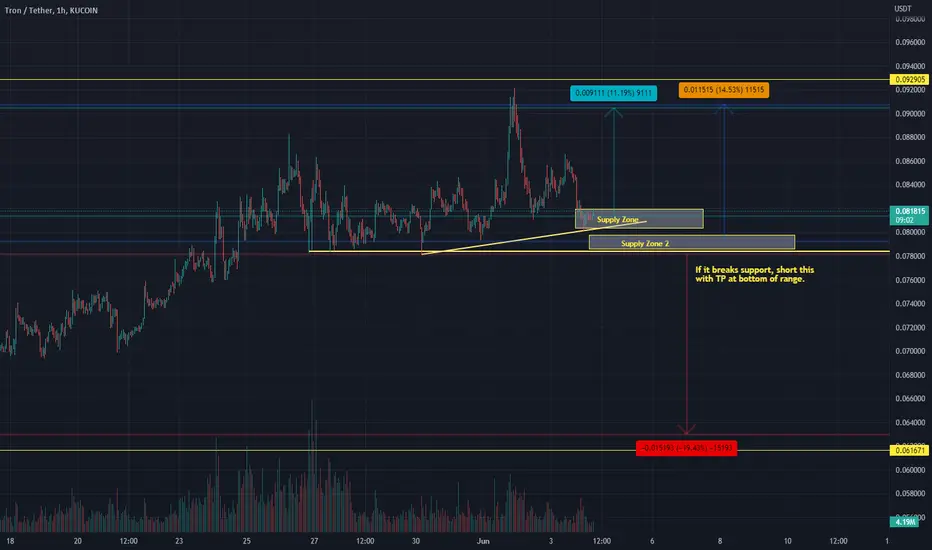
Tron USDT Up or down, time will tell. These are suggestions for what might happen.
You could already buy around now, if you have low leverage and can have some space for stop loss.
Or you could wait and see if price breaks temporary trend line, enter at the lower support line,
or wait to see if price breaks down below lower support, and take a short to the downside of the range.
Good luck!
God bless you all!
PS. I do not swear to abide to house rules, cause Jesus told us never to swear by anything.
But Yes, I comply with house rules.
Regards
ThomChris