NFT/USDT triangle Hello dear traders ! Apenft is fundamentally a huge project with exiting roadmap ! For technical analysis we can see how we bounced out of resistance and ready to finally break out and go the moon !
TRON

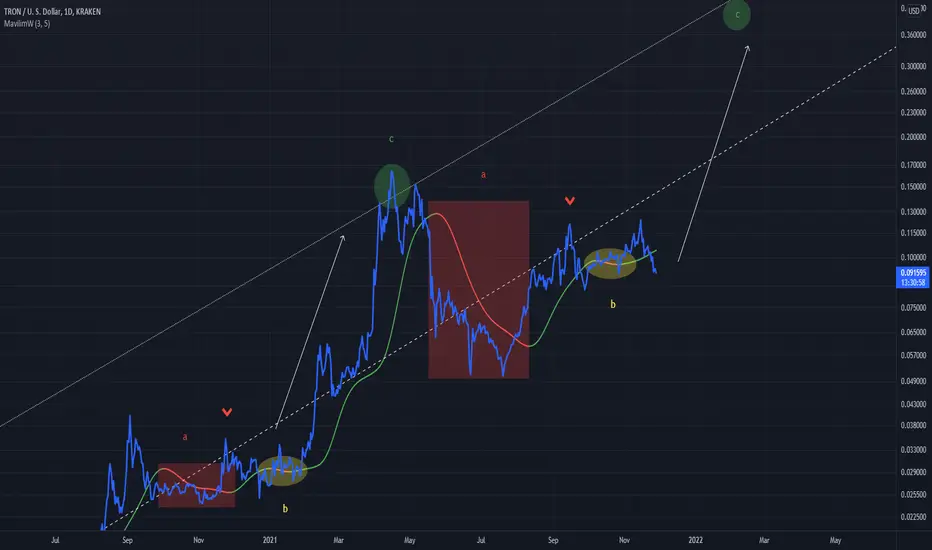
TRXUSD Bull SentimentAn idea showing comparable points for TRXUSD (labelled a,b,c)
Bullish action is coming
Using the MavilimW indicator still, it is quite effective
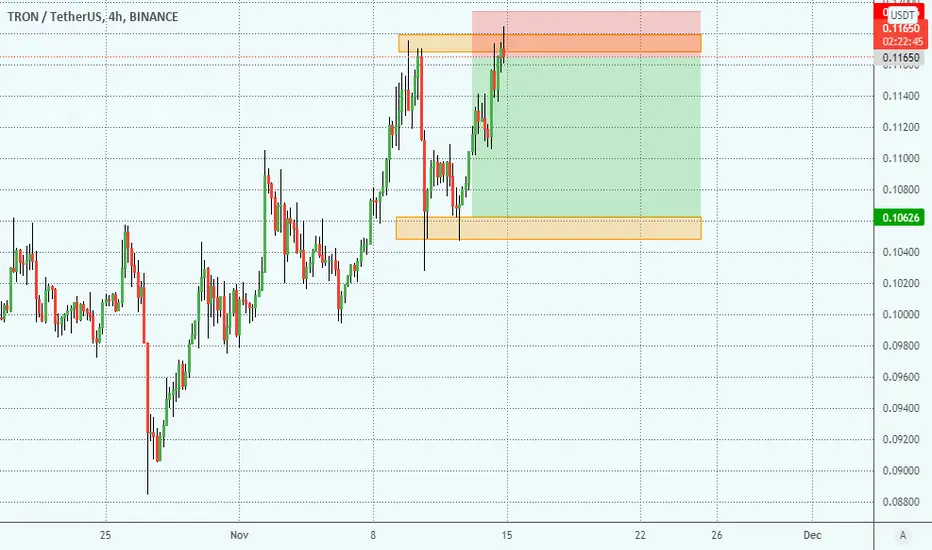
TRX (TRON) UpdateHi Traders,
Welcome to my update regarding TRON TRX technical analysis. As you can see we popped out of the down trend with a nice bullish run. The technical pattern that broke out was a falling wedge idea. In this trade I took 50% of my profit at the first target thus to give myself a better entry if we pulled back. Which as you can see in the chart we have came back down to the entry zone of the original breakout. After making a new local high and a new local higher low I have been given extra confidence that this trade will head to the second target area that I posted in the original trade. Therefore, I entered at the original breakout area giving myself an extra 40% profit potential on this specific trade.
Fell free to ask questions in the comments.
Have a green week!
Savvy

TRX IS PREPARING FOR THIS HUGE MOVE...HI EVERYONE
I think this could happen for TRX as you can see on chart 0.09 is strong support and was strong resistance and that means the correction is pull back to 0.09 and after that will touch ATH and a huge move to 1$ and next 2$ very soon.
God bless you

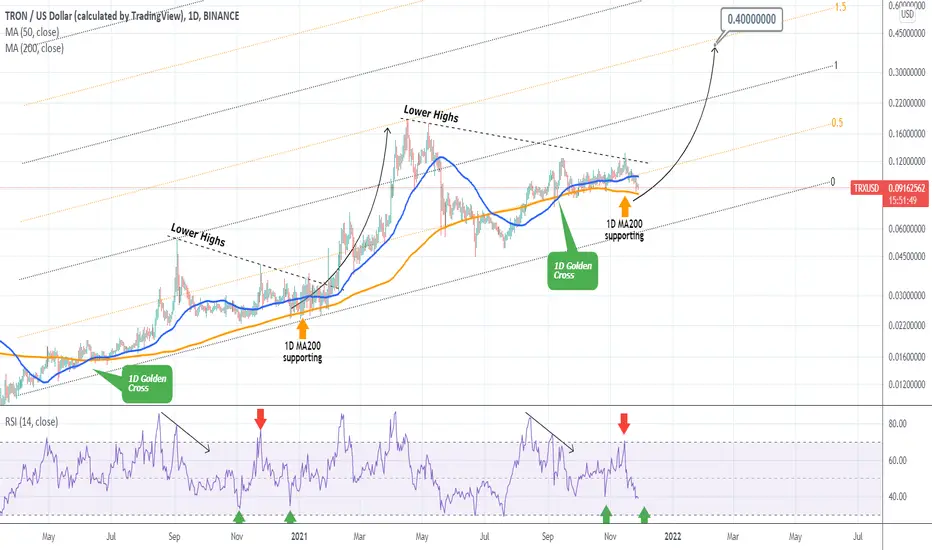
TRON preparing a parabolic rallyTRXUSD may be at the final accumulation phase before a strong Parabolic Rally. It is trading on a Golden Cross on the 1D time-frame since mid September but is under the Resistance of the Lower Highs trend-line that started on the April Top.
We can see almost the same sequence printed from September 03 2020 to January 30 2001. The price was at the time trading sideways, under the Lower Highs pressure but supported by the 1D MA200 (orange trend-line). When the Lower Highs trend-line broke and closed more than one 1D candles above it, a strong parabolic rally started.
The target of that rally was the 1.5 Fibonacci extension on the Channel pattern. Will that be the case this time around also?
--------------------------------------------------------------------------------------------------------
** Please support this idea with your likes and comments, it is the best way to keep it relevant and support me. **
--------------------------------------------------------------------------------------------------------
Tron is in a good area to go long.you can have it in your watch list. after hitting the bottom of channel and an engulfing bullish candle i will enter long.
this is just my analysis and IT IS NOT A TRADING SIGNAL!

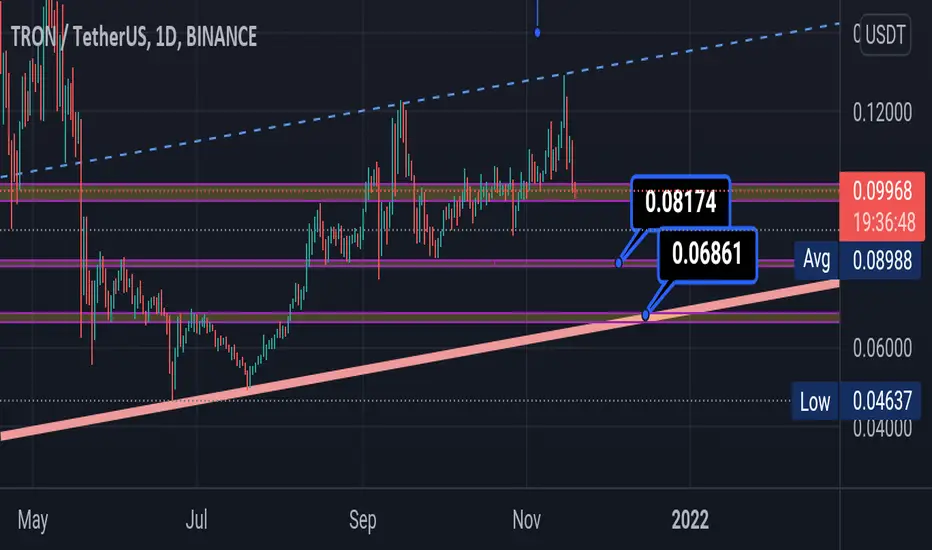
TRX Possible PathsTRX is suffering from a lack of confidence exacerbated by the news this week that eToro would be removing trading of TRX for US users. (www.etoro.com) If TRX successfully bounces in the next couple of days, it could reach 0.114 in the current channel in the next couple of months or 0.14 in the next quarter. The next major levels to watch are .067 with recovery to 0.88 and .041 with recovery to 0.058, but I think the lower bounce is very unlikely unless more bad news emerges around TRX.
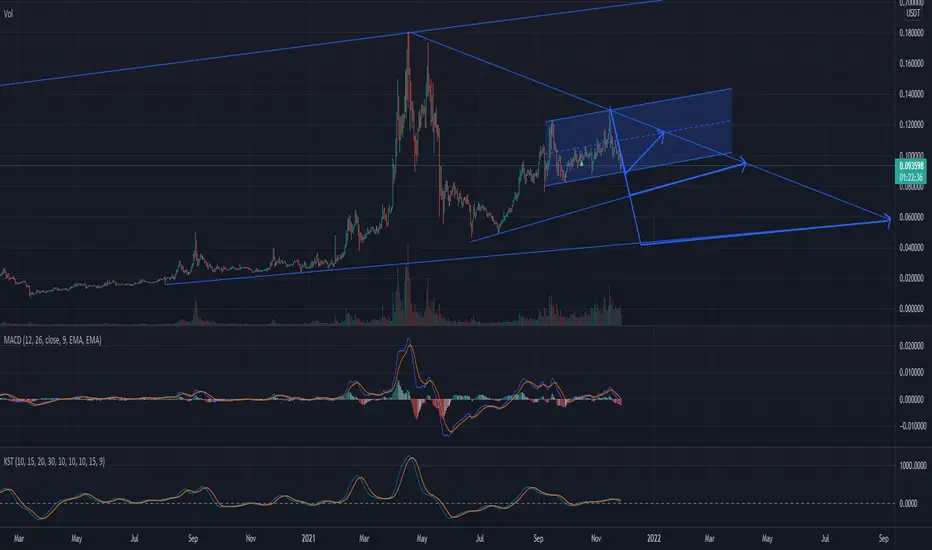
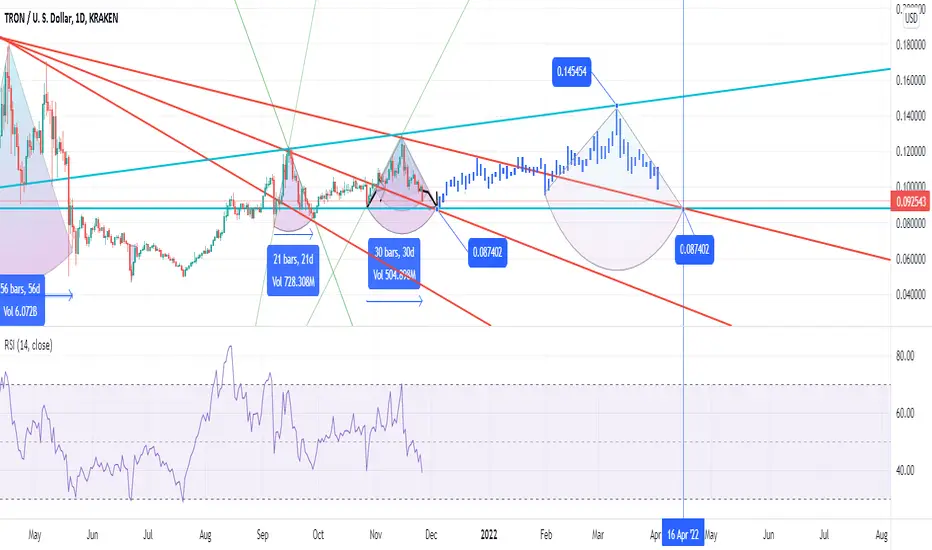
An idea based on retrospective patternsHi every one , this idea is based on chart patterns in the past.
The bell arcs is possible routes where price could touch based on its movement in the past and is based on equal rise and fall in the past idea. although the whole scenario could occur in a rising or falling road map.
prediction at low points attained based on ATH point ray line to present high points and confirmed by bell arcs rise and fall equality.
predicted high point is attained by present high points ray line combined with a scaled chart pattern in the past and predicted low point mentioned above , and confirmed by bell arc.
any way this is just and idea. what do you think?
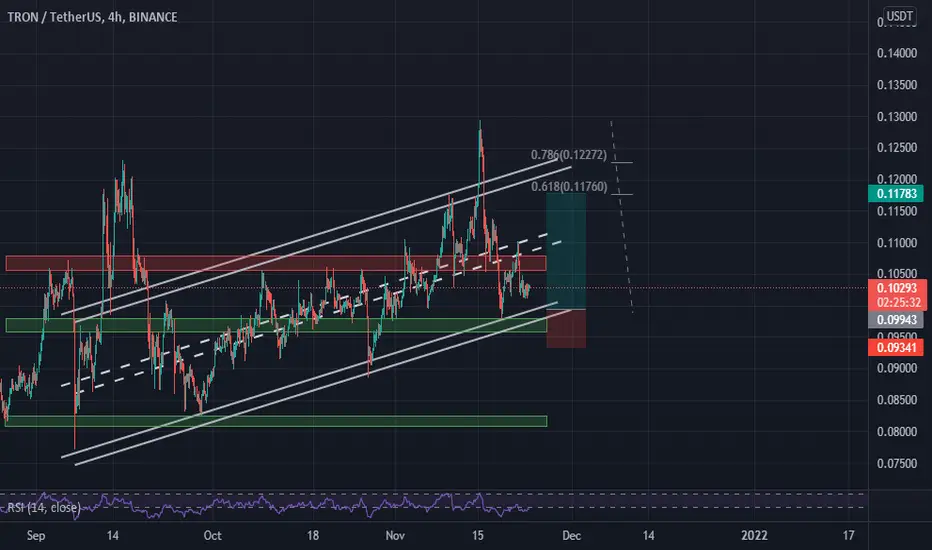
TRON, EXPECTED SCENARIO...This is my expected scenario for tron and hope you enjoy.
*Not financial advice.
TRON - 2h TF AnalysisIn a 2-hour timeframe, The support of 0.097 is very important right now. If this support is strongly broken, then I expect it to drop to lower targets. In the $0.09 area, there is a possibility of reversing the trend. If you want to trade (Long or Short), check the price reactions in the ranges I have drawn.

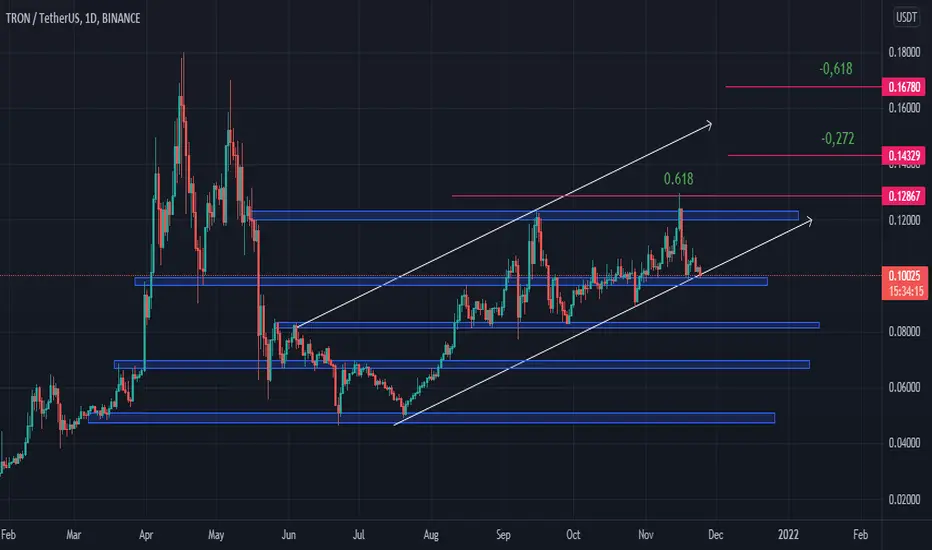
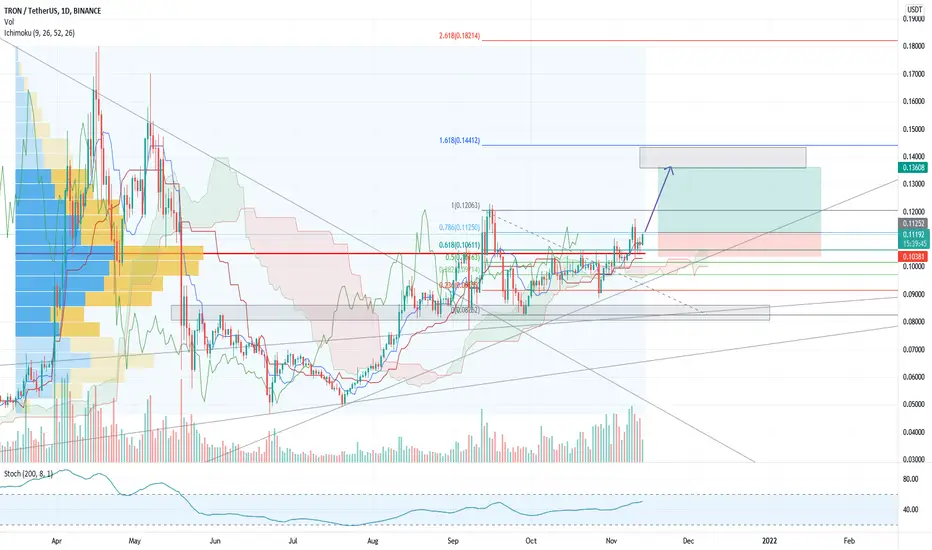
TRONTron still in bullish scenario until now. Correction on support EMA 50 TF 1D, Support Trendline and Classic Support.
Correction happen after price touch fibonacci 0.618 on price 0.12867 (swing high to swing low).
Based on fibonacci -0.272 and -0.618 target price around 0.14329 and 0.16780 (swing low to swing high). Wait for confirmation before take position.
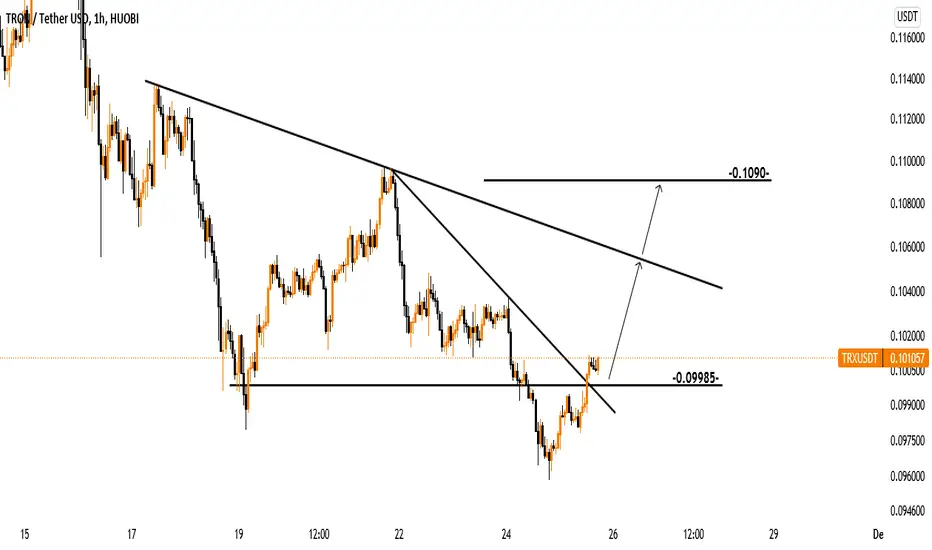
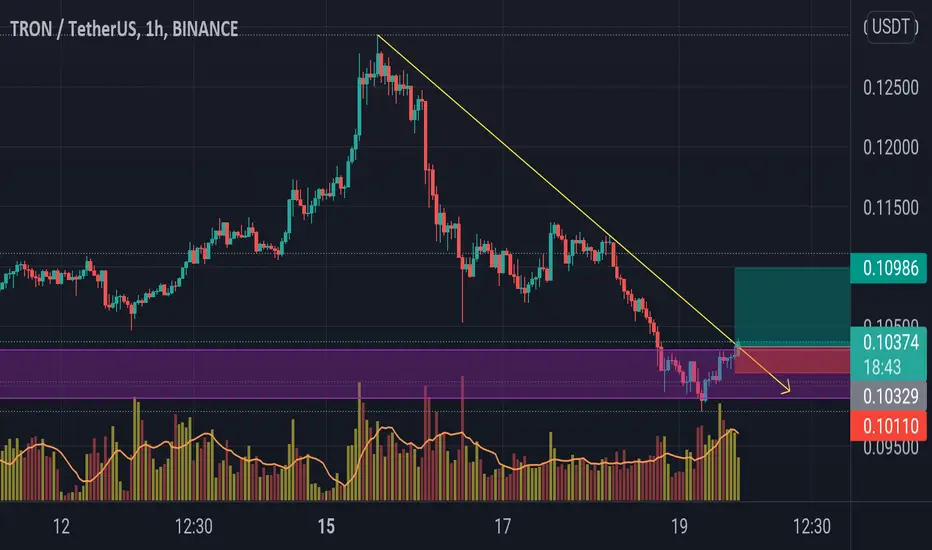
Setup for $TRX we can see falling wedge pattern at TF1H, if you want to put long position you can put at last fibo price and don't forget to set SL if this setup invalid. DYOR thank me later


best place for profit TRXUSDTbest place for profit . TRX is looking ready to break from the channel.

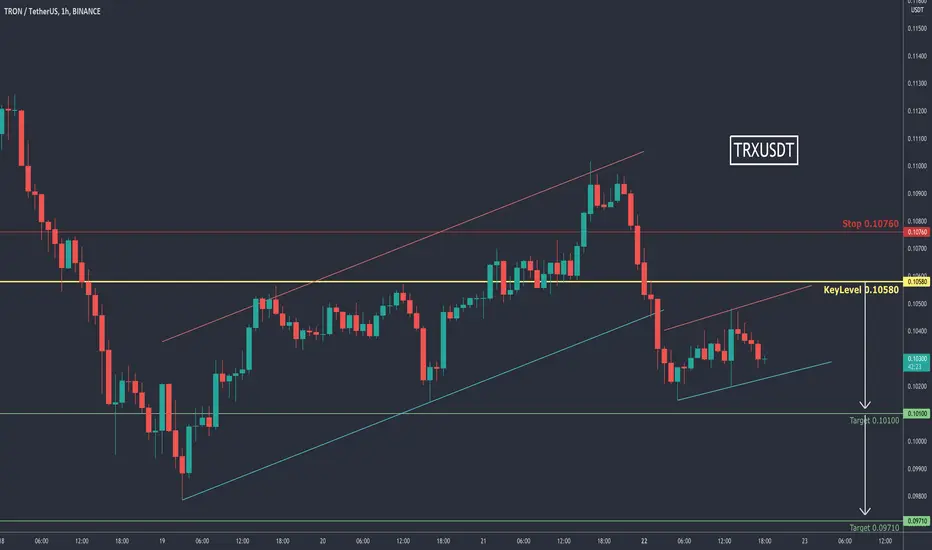
TRXUSDT-SHORTTRXUSDT TRON TRX
Futures
🔴Short Now or set on Key Level 0.10580
🟢Target 1 0.10100
🟢Target 2 0.09710
❌Stop loss 0.10760
#K_Level
TRXBTC bottom is in, the future is heredid you know that TRX is better than ETH ? that is why tether/USDT were swapping their USDT token from ETH chain to TRX chain.
dont believe me ? try to withdraw your usdt via TRX chain from your binance and compared it with via ETH chain. and check the fees.
disclaimer: not fincancial advice, always D.Y.O.R.

[TRX/BTC] Tron vs Bitcoin Inverse H&S - Long [BTFD-VIP]Greetings members and guests PLEASE hit the Thumbs Up button on the right to show some support and love ------------------------->>>>>> ^^^^^^^^ <<<<<
Comments and questions are welcomed below, please feel free to ASK anything!
HOW TO TRADE THIS CHART?
First like/thumbs up the chart then read below.....
Tron has seen significant strength and gains with its popularity amongst the crypto community
Due to this its formed an inverse H&S and about to break the neck line which means a buy signal for this coin/pair
Indicators are showing bullish signs, we just came out of overbought last week and plenty of momentum to carry on up as the market gains more confidence
Purple lines are the resistances/targets at 430, 499, 586 & 745 Sats
Stop Loss is at 342 (just under right shoulder)
Looking to enter around 372-380, we're pretty sure bitcoin market can bring price down again to a good entry point
use no more than 2% of your total account
disclaimer: this is for entertainment purposes only and not be considered trade advice

TRON - Trade This WedgeTron is currently within an ascending wedge which we can trade. Every bounce and rejection of the wedge can be a point of entry with stops outside of the wedge.
We recently saw a bounce off the wedge which we can use to enter with stops below the ascending wedge.
Targets will be the ascending wedge resistance.
Goodluck!

Tron long or buyHello friends. I hope you take full advantage of the good opportunity to buy theron in the specified areas, please support me by liking and following
Tron Short TradeResistance Rejected, Forming divergence in MAC indicator. It's a good opportunity to go short