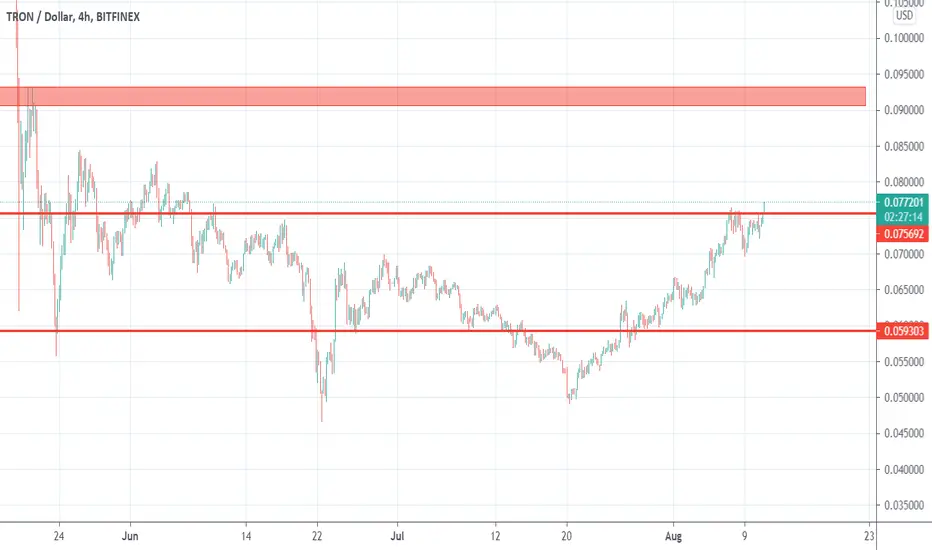
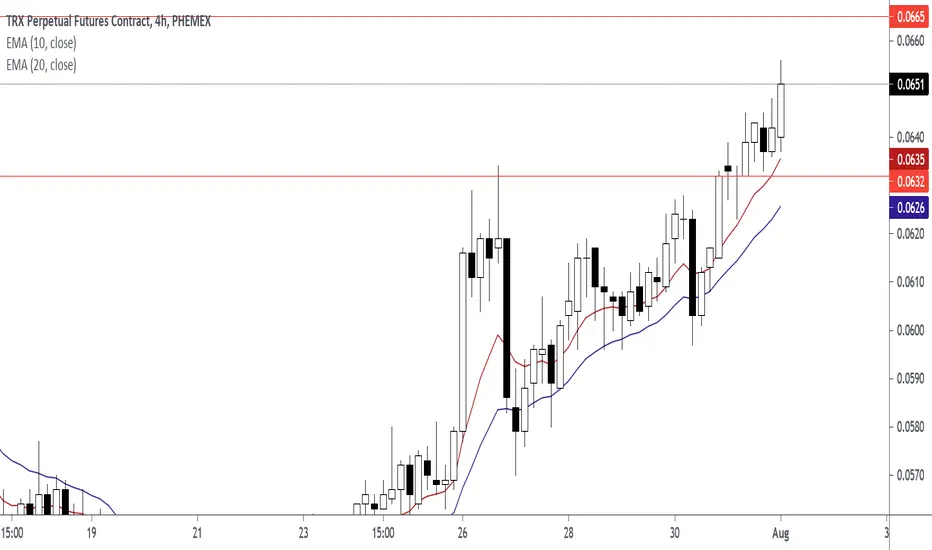
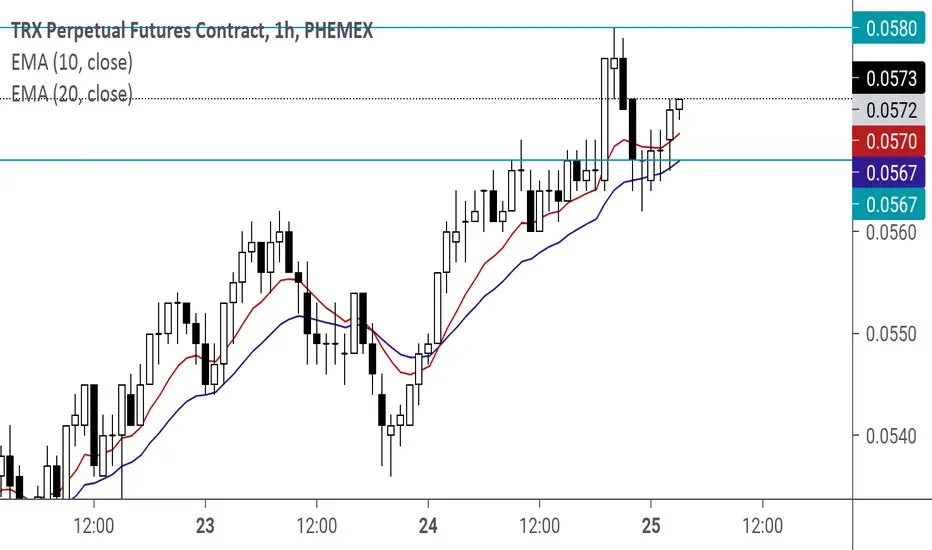
Tron has broken above- 0.9 in sightAlso Tron is on the run since 20th July, and after breaking above the double bottom's neck-line, the coin confirmed the break as a genuine one and now is making a new high.
I expect a continuation and 0.9 resistance is my target
TRON
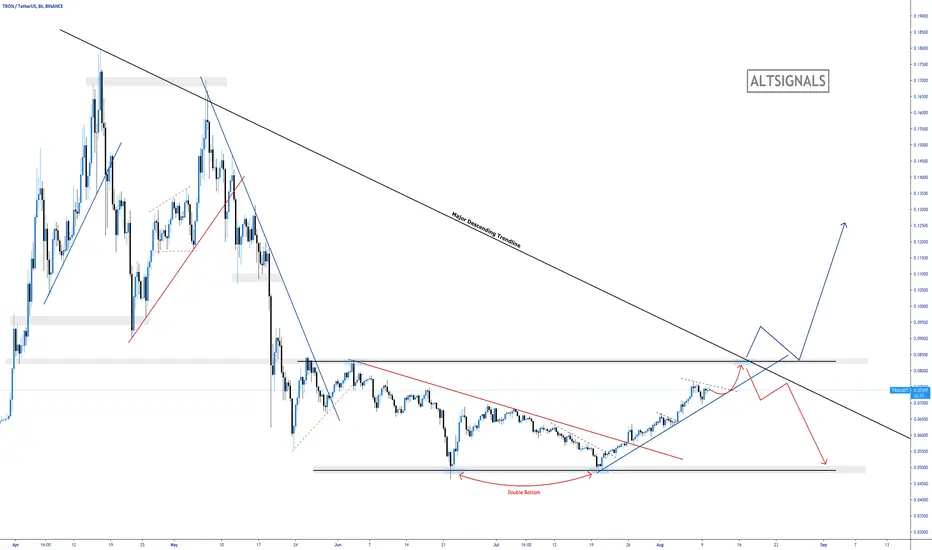
Tron TRXUSD - Massive Ascending channel + Impulse Elliott Wave!- On the chart we can spot an incomplete Impulse Elliott Wawe (5th wave).
- Rounding bottom or cup and handle is also printing at the chart.
- Target is 1:1 fib trend-based extension + top of the ascending channel + 5th elliott wave
- For expected duration of the trade, probability, stop loss, profit target, entry price and risk to reward ratio (RRR) - please check my signature below ↓
- Huge bullish volume is also one of the positive signs!
- If you want to see more of these ideas, hit "Like" & "Follow"!

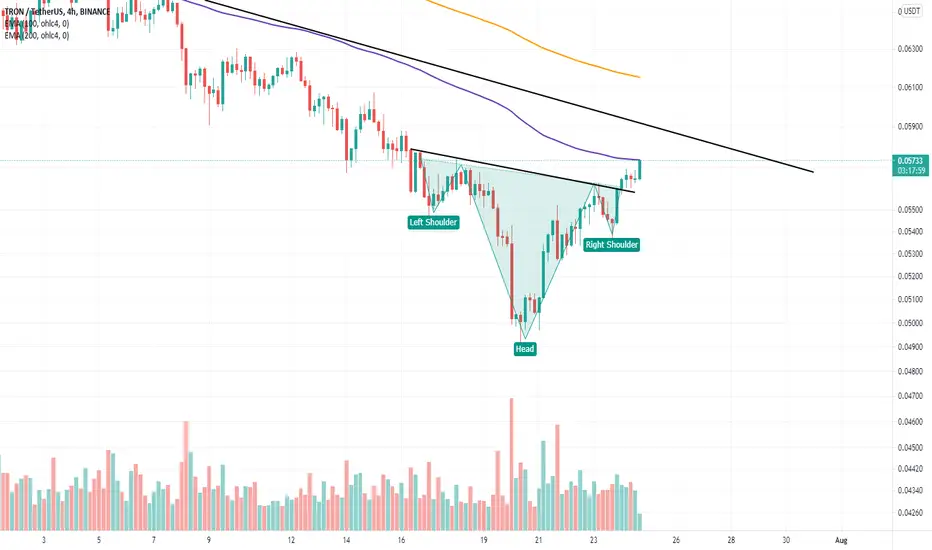
TRON - Break Or Bounce 👀Tron is approaching a key level where we have a bounce or break scenario.
Bounce = price rejects the structure level and comes back down.
Break = Price breaks through the structure level and continues higher.
Watch for price to keep pushing up to the 0.0825 and then watch price action to tell us where it's going next.


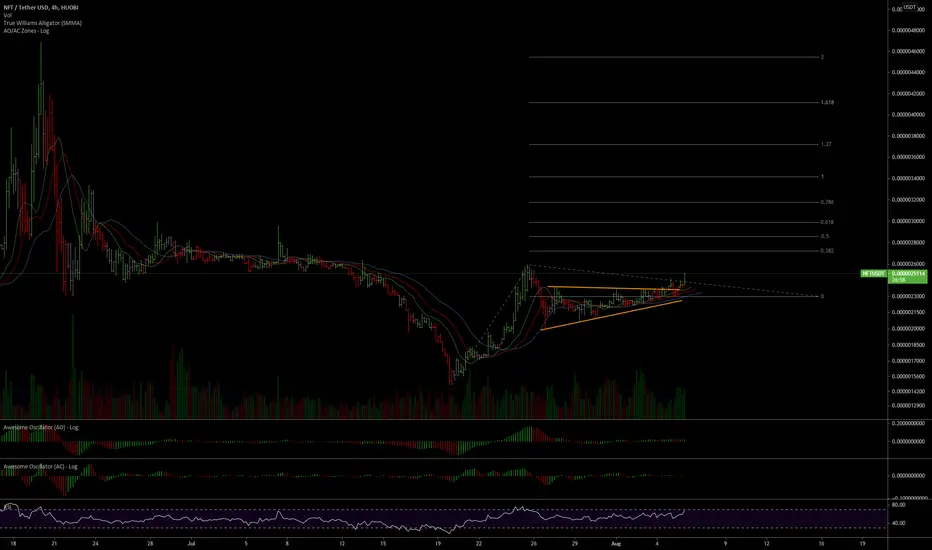
APENFT Breaking OutLooks like NFT token is finally breaking out from this range and could see much higher prices from here. Min target is around 0.0000034 but this could potentially go as high as all time high as the NFT craze continues to grip the market. Fundamentally, the NFT token is a governance token that governs the APENFT fund which is a fund that purchases high value NFTs, the fund currently holds works from Picasso, Warhol, and Beeple and this collection will continue to expand in the future.
Tron (TRX) - August 4Hello?
Welcome, traders.
By "following", you can always get new information quickly.
Please also click "Like".
Have a nice day.
-------------------------------------
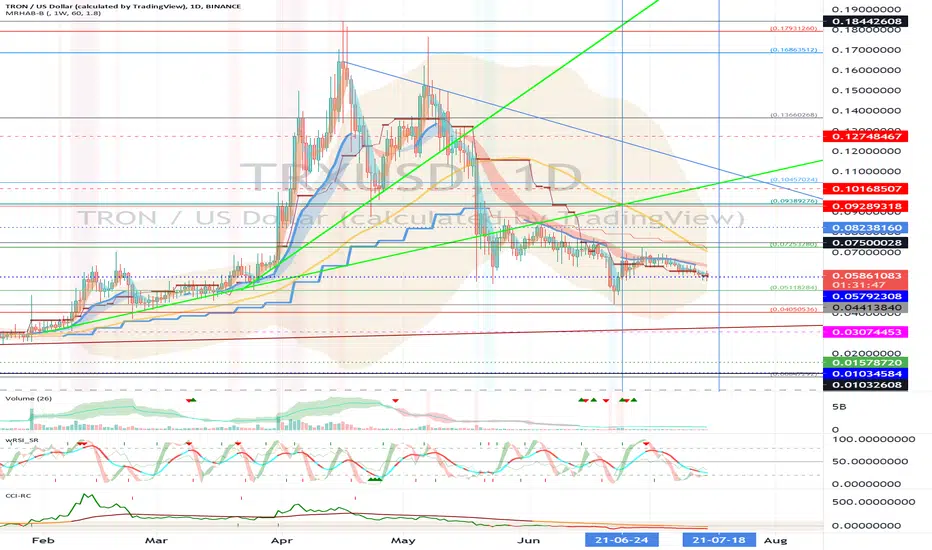
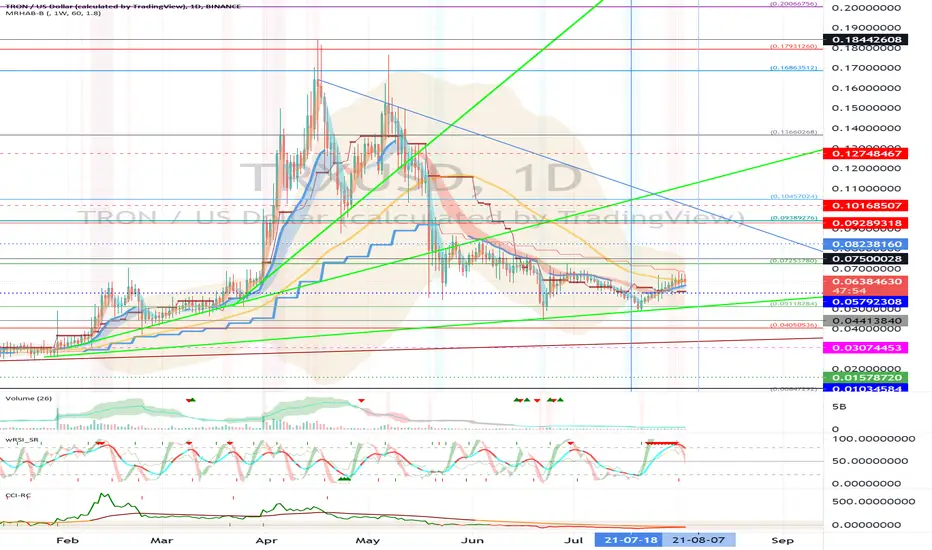
(TRXUSD 1W Chart)
If the price holds above the 0.03074453-0.04413840 range, it is expected that the uptrend will continue.
(1D chart)
If the price is maintained in the 0.05118284-0.07253780 range, it is expected to turn into an uptrend.
If the price holds above the 0.07253780 point, I would expect it to reorient itself in the range 0.09389276-0.10457024.
If the price falls in the range of 0.04050536-0.05118284, there is a possibility of entering the mid- to long-term investment area, so careful trading is required.
-------------------------------------
(TRXBTC 1W Chart)
If the price is maintained above the 259 Satoshi point, it is expected to create a new wave.
(1D chart)
If the price is maintained in the range of 168 Satoshi-199 Satoshi, it is expected to turn into an uptrend.
If it falls in the 121 Satoshi-137 Satoshi range, it is possible to enter the mid- to long-term investment area, so careful trading is required.
------------------------------------------
We recommend that you trade with your average unit price.
This is because, if the price is below your average unit price, whether it is in an uptrend or in a downtrend, there is a high possibility that you will not be able to get a big profit due to the psychological burden.
The center of all trading starts with the average unit price at which you start trading.
If you ignore this, you may be trading in the wrong direction.
Therefore, it is important to find a way to lower the average unit price and adjust the proportion of the investment, ultimately allowing the funds corresponding to the profits to regenerate themselves.
------------------------------------------------------------ -----------------------------------------------------
** All indicators are lagging indicators.
Therefore, it is important to be aware that the indicator moves accordingly with the movement of price and volume.
However, for the sake of convenience, we are talking in reverse for the interpretation of the indicator.
** The wRSI_SR indicator is an indicator created by adding settings and options to the existing Stochastic RSI indicator.
Therefore, the interpretation is the same as the traditional Stochastic RSI indicator. (K, D line -> R, S line)
** The OBV indicator was re-created by applying a formula to the DepthHouse Trading indicator, an indicator disclosed by oh92. (Thanks for this.)
** See support, resistance, and abbreviation points.
** Support or resistance is based on the closing price of the 1D chart.
** All descriptions are for reference only and do not guarantee a profit or loss in investment.
Explanation of abbreviations displayed in the chart
R: A point or section of resistance that requires a response to preserve profits.
S-L : Stop Loss point or section
S: A point or section where you can buy to make a profit as a support point or section.
(Short-term Stop Loss can be said to be a point where profit and loss can be preserved or additional entry can be made through split trading. It is a short-term investment perspective.)
GAP refers to the difference in prices that occurred when the stock market, CME, and BAKKT exchanges were closed because they are not traded 24 hours a day.
G1 : Closing price when closed
G2: Opening price
(Example) Gap (G1-G2)
TRON (TRX) between theory and practiceTRON (TRX) is in a DOWNTREND BEAR FLAG and from which he seems to want to get out of this flag through an ascending channel.
The theory is that the bear flag should still come down.
We will see. Anyway, TRX will move between $ 0.50 and $ 0.67 for now.

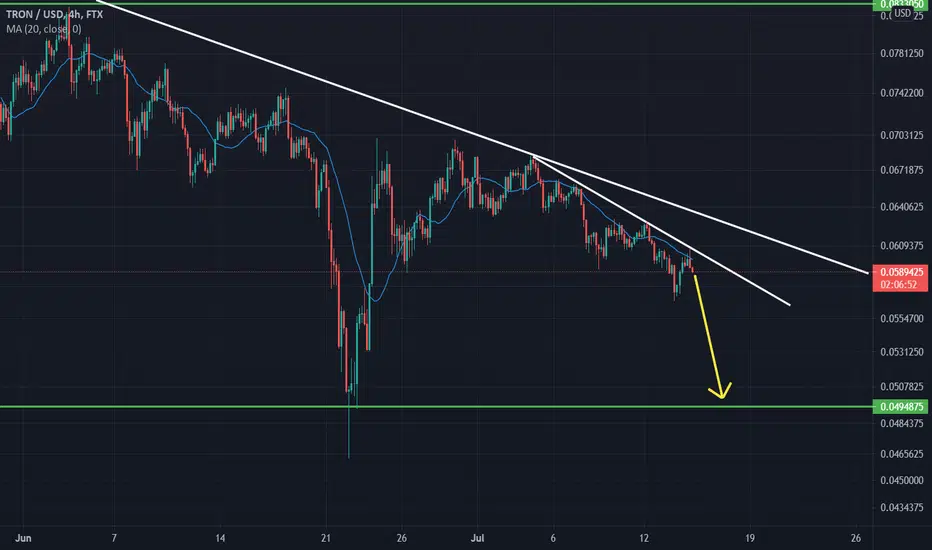
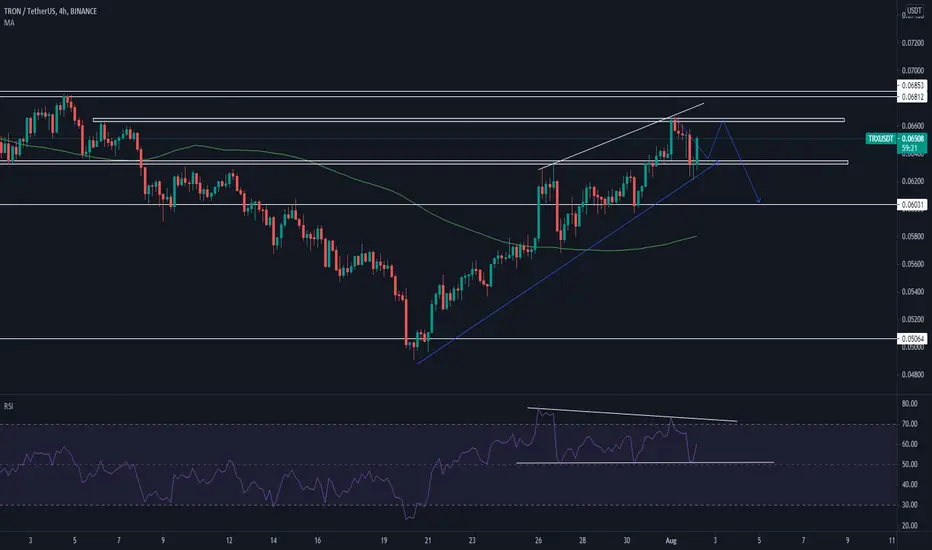
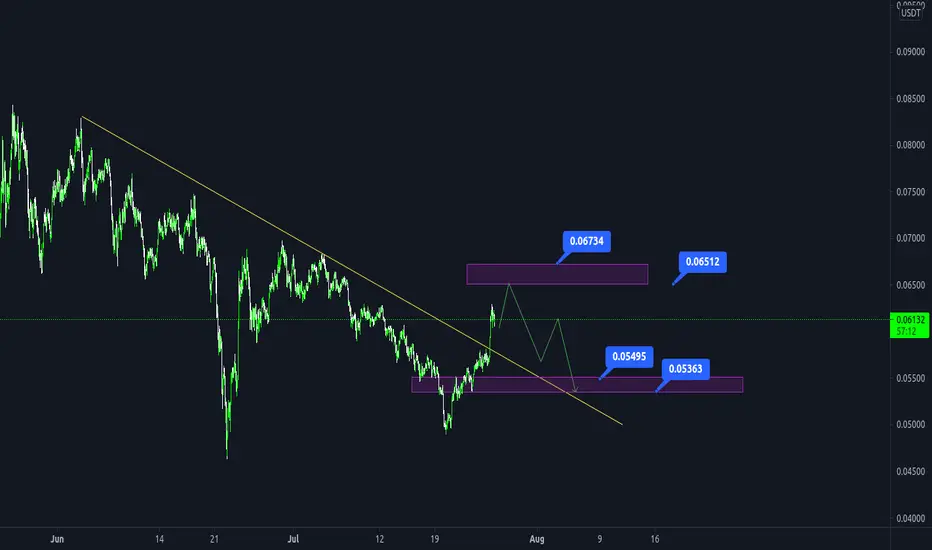
TRXUSDT may fall TRX bouncing off from the support on 0.062 , it seems to be a good area for buy , but as you can see we have a divergence here
as prices made new highs , RSI made lower highs , this is a warning
I think prices will go down after it touch 0.066 resistance
This is just an analysis , make your own decision
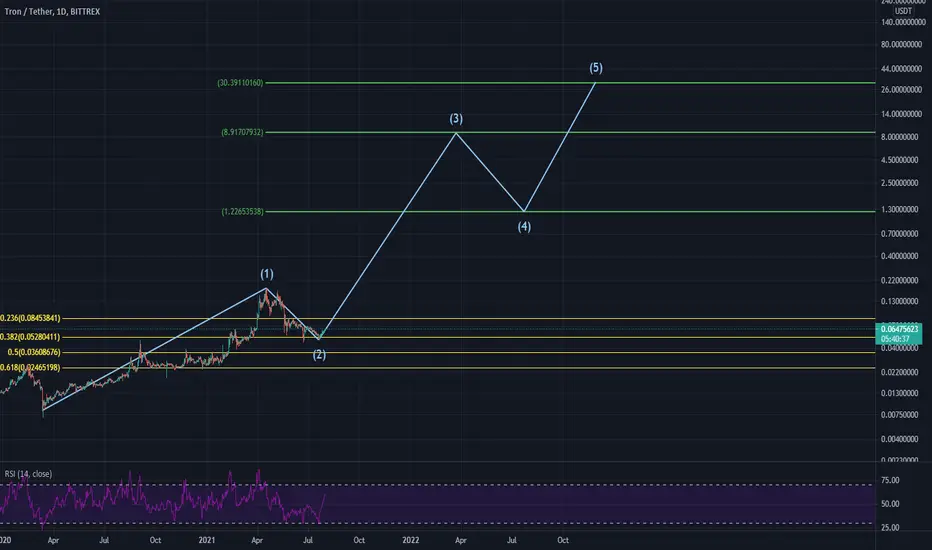
Possible TRXUSDT Targets - 30 USD by the end of this waveIn one version for TRX charting, one would assume that TRX topped in its wave 1 in April 2021 at about 0.166, when bitcoin realized its ATH .
following the market correction, TRX retraced to 0.381 FIB and held that support level quite well.
If things continue well, the long term targets for TRX are shown in this chart, hitting the 1.618 FIB at the end of wave 3, retracing to Fib 1 (might go deeper as wave 2 was not that strong) , before realizing a new ATH .
PS: this chart ain't a financial advice
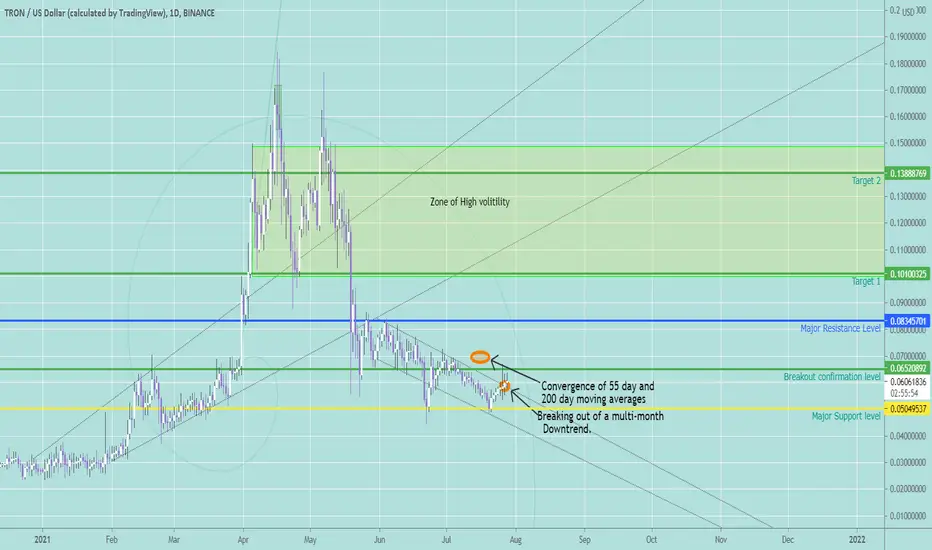
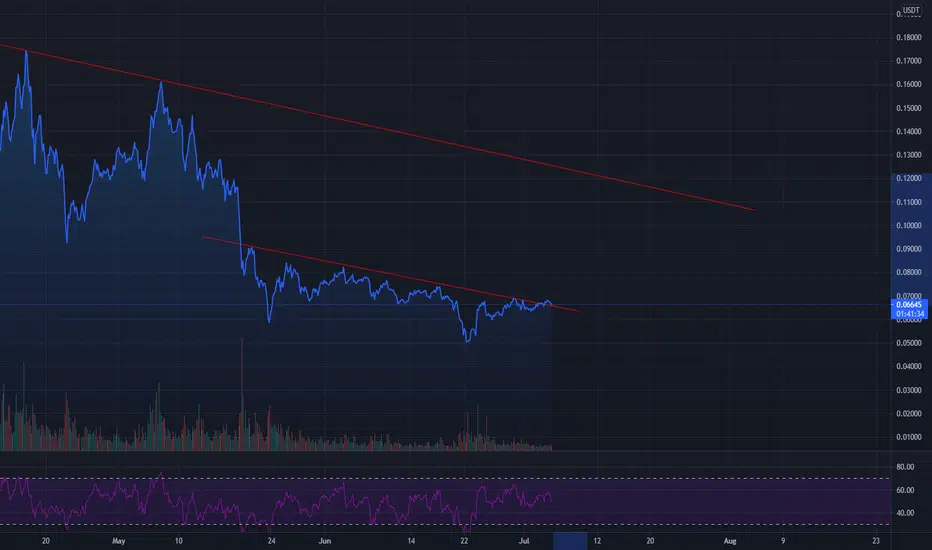
Trx Long Idea-Potential 100-200% gainI am not a fan of the Tron Foundation or Justin Sun by any means, but when I see a good trade I take it.
This trade is highly dependent on Bitcoin maintaining a steady price action and not crapping the bed.
As you can see by the chart $TRX is currently attempting to break out of a multiweek declining channel, I highlighted the $.065 level in green at a breakout confirmation level that I am watching very carefully. I would recommend setting alerts at that level if you arent comfortable shorting just yet and would like to see a guaranteed break out.
Other key levels are highlighted and labeled, feel free to take profit at any level you please, and don't get greedy.
If you have any questions feel free to ask away in the comments and ill get back to you when I have time :)
Have a blessed day everyone!
-
tron trxusdtPretty similar as most of coins left one small leg up before some crucial pullback which is must buy in my opinion.
TRON TRX +80%??? Big PUMPTRON TRX +80%??? Big PUMP
No es un consejo de inversión, haz tus propios análisis
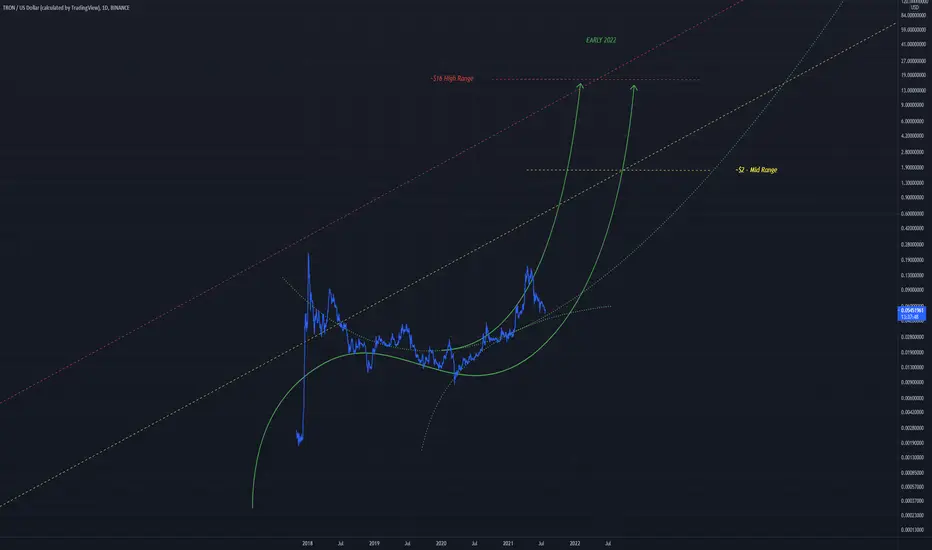
TRON Price Range Targets for Early 2022An idea for TRON
Top channel band suggests $16 which is a massive increase from the current 0.05
Middle channel band suggests $2 which is also a huge increase
Both of these scenarios make sense, the top band was where price hit in 2017
Time will tell if it repeats
I have used a sort of 'quasi' channel to identify these ranges
Also some funky trend lines included to support this channel idea !

Tron (TRX) - July 16Hello?
Welcome, traders.
By "following", you can always get new information quickly.
Please also click "Like".
Have a good day.
-------------------------------------
(TRXUSD 1W Chart)
If the price holds above the 0.04413840 point, it is expected that the uptrend will continue.
(1D chart)
If the price is maintained in the 0.05118284-0.07253780 range, it is expected to turn into an uptrend.
If it falls in the range of 0.04050536-0.05118284, there is a possibility of entering the mid- to long-term investment area, so careful trading is required.
-------------------------------------
(TRXBTC 1W Chart)
If the price is maintained above the 194 Satoshi-259 Satoshi section, it is expected to create a new wave.
(1D chart)
If the price is maintained in the range of 168 Satoshi-199 Satoshi, it is expected to turn into an uptrend.
To continue the uptrend, it needs to rise above the 215 Satoshi point.
If it falls from the 168 Satoshi point, it can touch the 121 Satoshi-137 Satoshi section, so careful trading is required.
------------------------------------------
We recommend that you trade with your average unit price.
This is because, if the price is below your average unit price, whether it is in an uptrend or in a downtrend, there is a high possibility that you will not be able to get a big profit due to the psychological burden.
The center of all trading starts with the average unit price at which you start trading.
If you ignore this, you may be trading in the wrong direction.
Therefore, it is important to find a way to lower the average unit price and adjust the proportion of the investment, ultimately allowing the funds corresponding to the profits to regenerate themselves.
------------------------------------------------------------ -----------------------------------------------------
** All indicators are lagging indicators.
Therefore, it is important to be aware that the indicator moves accordingly with the movement of price and volume.
However, for the sake of convenience, we are talking in reverse for the interpretation of the indicator.
** The wRSI_SR indicator is an indicator created by adding settings and options to the existing Stochastic RSI indicator.
Therefore, the interpretation is the same as the traditional Stochastic RSI indicator. (K, D line -> R, S line)
** The OBV indicator was re-created by applying a formula to the DepthHouse Trading indicator, an indicator disclosed by oh92. (Thanks for this.)
** See support, resistance, and abbreviation points.
** Support or resistance is based on the closing price of the 1D chart.
** All descriptions are for reference only and do not guarantee a profit or loss in investment.
Explanation of abbreviations displayed in the chart
R: A point or section of resistance that requires a response to preserve profits.
S-L: Stop Loss point or section
S: A point or section where you can buy to make a profit as a support point or section
(Short-term Stop Loss can be said to be a point where profit and loss can be preserved or additional entry can be made through split trading. It is a short-term investment perspective.)
GAP refers to the difference in prices that occurred when the stock market, CME, and BAKKT exchanges were closed because they are not traded 24 hours a day.
G1 : Closing price when closed
G2: Opening price
(Example) Gap (G1-G2)