TRON Partners With Chainlink to Strengthen Its DeFi EcosystemTRON ( AMEX:TRX ) has made a strategic move by joining forces with Chainlink SCALE, effectively making Chainlink Data Feeds the official oracle provider for TRON’s decentralized finance (DeFi) ecosystem. This collaboration marks a significant upgrade to TRON’s blockchain infrastructure, introducing high-quality and decentralized oracle solutions to TRON’s $6.5 billion total value locked (TVL) in DeFi.
TRON DAO Partners with Chainlink SCALE
In a strategic shift, TRON DAO recently announced its partnership with Chainlink, one of the most recognized decentralized computing platforms globally. The integration enables TRON to harness Chainlink’s industry-leading oracles, which will replace WINkLink as the primary oracle solution for TRON's ecosystem. With Chainlink Data Feeds securing more than $6.5 billion in TVL within TRON’s DeFi applications—such as JustLend and JustStable—the partnership promises to enhance security, precision, and reliability in TRON’s DeFi sector.
According to TRON’s founder, Justin Sun, joining Chainlink SCALE will ensure that TRON’s DeFi environment has dependable data, a foundational necessity for the expansion of DeFi applications on the network. This new system allows developers on TRON to access high-quality pricing and market data, contributing to a more robust and scalable decentralized economy.
Driving the Next Generation of DeFi on TRON
The adoption of Chainlink Data Feeds on TRON means more than just a technical upgrade. It represents a pathway to expand TRON’s ecosystem while offering enhanced stability, increased scalability, and reduced operational costs for early-stage DeFi applications. Chainlink SCALE introduces a model where TRON initially covers certain gas fees for using Chainlink’s oracles, fostering DeFi growth until the ecosystem matures and user fees can sustain these costs independently.
Thodoris Karakostas, head of blockchain partnerships at Chainlink Labs, voiced his enthusiasm, noting that Chainlink’s high security and reliable on-chain market data provide TRON developers with the tools needed to create the next generation of DeFi applications. This integration, he emphasized, will bolster TRON’s foundation for a decentralized internet—a vision at the core of TRON DAO’s mission.
TRON’s Commitment to Growth and Innovation
In addition to the Chainlink partnership, Justin Sun recently commented on TRON's growing ecosystem and the anticipated rise of memecoins on the platform. He highlighted the community’s role in supporting these developments and expressed confidence in a new growth phase if AMEX:TRX surpasses its previous peak, potentially triggering a wave of FOMO-driven interest in TRON’s DeFi and memecoin markets.
This commitment to innovation signals a brighter future for TRON as a hub of decentralized finance, and Chainlink’s proven track record in supporting high-volume transactions and delivering reliable data positions TRON advantageously.
Technical Analysis
Currently, AMEX:TRX is trading within an overbought channel with an RSI of 77, reflecting its strong demand following the Chainlink partnership announcement. This movement aligns with previous trends observed in AMEX:TRX ’s price behavior, where periods of bearish momentum were often followed by bullish reversals. This pattern indicates TRX’s resilience and suggests potential for sustained price growth, especially with heightened interest from institutional investors and developers exploring TRON’s DeFi space.
From a technical standpoint, AMEX:TRX offers a relatively stable investment opportunity, appealing to traders looking for a balance between growth and moderate risk. The blockchain’s notable transaction speed and scalability, combined with its new oracle integration, are factors that solidify its position as one of the most secure and reliable assets within the DeFi landscape.
The Strategic Implications for Investors
With Chainlink Data Feeds now part of TRON’s foundational infrastructure, the TRON network is positioned to enhance its appeal for DeFi developers and investors alike. The partnership not only promises to make TRON’s DeFi ecosystem more resilient and scalable but also strengthens its ecosystem’s security—vital as TRON seeks to decentralize the internet through blockchain technology and decentralized applications (dApps).
The long-term implications are clear: TRON’s partnership with Chainlink represents a new era for its DeFi ecosystem. As the TRON DAO continues to expand, AMEX:TRX stands poised to benefit from increased market confidence and user adoption. For investors, this development presents an attractive opportunity to capitalize on TRON’s expanding ecosystem and DeFi potential.
In summary, the TRON-Chainlink collaboration marks a transformative milestone in TRON’s roadmap. With enhanced infrastructure, reduced operational costs, and a renewed commitment to scalability, AMEX:TRX solidifies its role as a key player in the decentralized finance sector. For investors, TRON’s commitment to innovation and growth signals a robust opportunity, particularly in the evolving DeFi space.
TRON
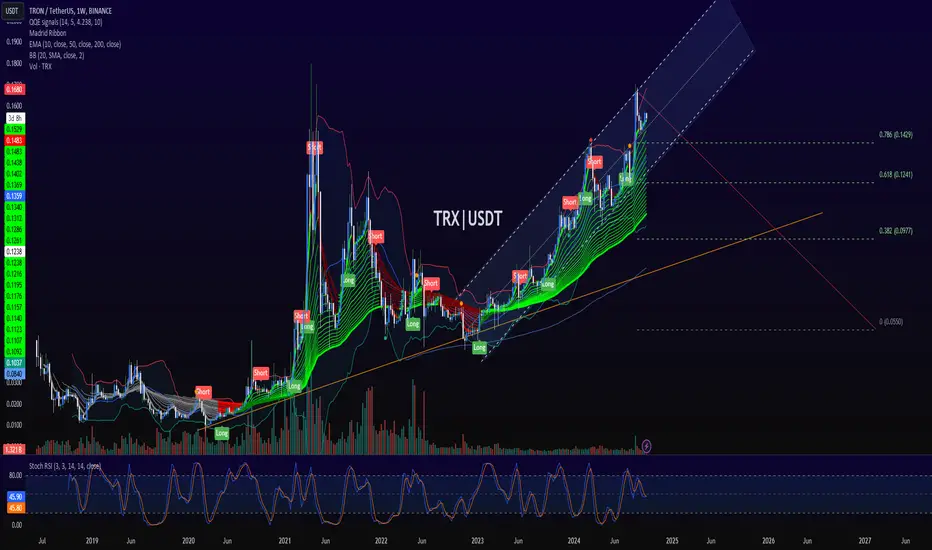
TRXUSD: Cup and Handle buy signalTron is technically overbought on its 1D outlook (RSI = 69.926, MACD = 0.003, ADX = 23.630) but is far from topping on its 2 year Channel Up. The 1W RSI is at a level where previously three times it made short term consolidations in the form of Cup and Handle patterns, rise to at least the 1.5 Fibonacci extension. The last one even hit the 2.5 Fib and that's what we're aiming for now (TP = 0.2000) as it is the closest to the Channel Up top.
## If you like our free content follow our profile to get more daily ideas. ##
## Comments and likes are greatly appreciated. ##

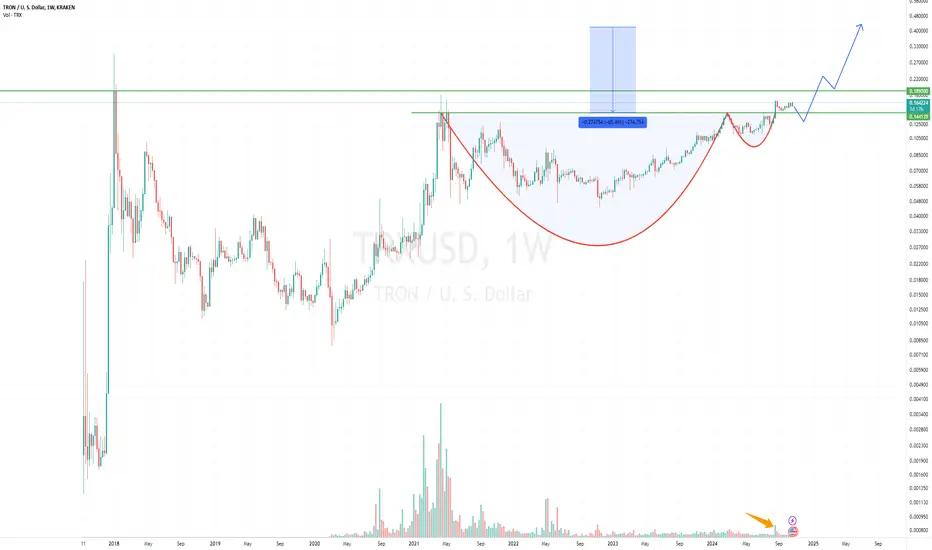
[C&H] TRON is creating base for move up higherKRAKEN:TRXUSD seem to have broken out of a cup and handle pattern and in process of retest/consolidation. It might retest the breakout zone around 0.143 before a move up higher. Note that all time highest close (higher green line) would likely act as resistance but if we manage to break past it then we should see 0.41 levels as per the height of C&H pattern.
From Elliott wave perspective though, it looks much more bullish with a potential target of 1.12 in medium term. Will share the counts in a separate post.
Justin Sun’s Vision and the Growth of Tron’s Memecoin EcosystemJustin Sun, the visionary behind Tron, is sparking fresh excitement in the memecoin arena with his strategic moves and groundbreaking developments on the network. With the recent launch of SunPump, a platform designed to bolster memecoin creation on Tron, Sun is preparing for a “second wave” of memecoin growth, backed by continuous development, strategic community involvement, and robust ethical standards.
A New Era for Tron’s Memecoins
Sun believes the next growth cycle for Tron’s memecoins is imminent. He’s actively promoting a community-driven approach, which he feels is key to sparking fresh investment and driving adoption. The memecoin wave aligns with the overall growth of Tron’s native token, AMEX:TRX , which experienced a 24% boost in market capitalization in Q3 2024 alone—from $11 billion to $13.5 billion. Tron’s commitment to memecoin culture is part of a larger push to position AMEX:TRX among the top 10 cryptocurrencies, where it currently stands close behind giants like XRP and Dogecoin.
Technical Outlook: TRX’s Rising Deflationary Mechanism
One significant factor driving TRX’s recent performance is its robust deflationary model. With a capped total supply of 100 billion tokens, TRX's circulating supply dropped from 87.2 billion to 86.62 billion in Q3, thanks to an intensified burn schedule that increased its annual deflation rate to -2.7% from -2.4%. This steady reduction in circulating supply is a powerful mechanism that can potentially support higher valuations by restricting token availability.
In August alone, Tron ( AMEX:TRX ) witnessed its largest-ever single-day burn on the SunPump platform, where 270 million AMEX:TRX tokens, valued at $42 million, were removed from circulation. This burn policy has helped sustain positive price momentum for AMEX:TRX , contributing to a 1.83% increase, currently hovering at $0.17. TRX’s pairing with BTC has also gained traction, with a notable 25% increase driven by the popularity of SunPump and heightened USDT transactions on the Tron network.
SunPump’s Impact on the Tron Ecosystem
SunPump’s launch marks a bold step into the world of memecoins, with SunPump acting as both a “meme fair” and a streamlined platform for creating new meme tokens on Tron’s blockchain. This initiative aims to simplify the process of memecoin creation, making it accessible to developers and investors who wish to engage with this growing market sector. SunPump has already made a splash, inspiring tokens like $SUNDOG and $TRONBULL, which rapidly gained popularity and captured the attention of the wider crypto community.
Ethical Guidelines for AI Memecoins
In a nod to Asimov’s Three Laws of Robotics, Sun has crafted “The Asimov Three Laws of AI Meme Coin Ethics” to ensure a fair and ethical framework for AI-driven memecoin projects on Tron. These rules emphasize that AI should avoid self-serving activities, prioritize human interests, and maintain the integrity of its own projects without harming others. Sun’s adaptation of Asimov’s principles for AI highlights Tron’s dedication to responsible innovation within the memecoin space, promoting a sustainable approach for this rapidly growing digital landscape.
Technical Indicators
The technical analysis for AMEX:TRX shows an optimistic outlook as the token attempts to break out of a short-term falling wedge pattern, a typically bullish indicator. Currently, AMEX:TRX has an RSI of 66, which places it in a favorable position to sustain upward momentum as it consolidates at a key support level. With Total Value Locked (TVL) in Tron reaching $7.164 billion and stablecoins pegged to the Tron network boasting a market cap of $60.34 billion, the Tron ecosystem is well-capitalized and primed for future growth.
Conclusion
As Tron cements its role in the memecoin space with SunPump, it has positioned itself as a blockchain with both strong technical fundamentals and a vibrant community. With TRX showing consistent growth, driven by strategic deflationary measures and a surging TVL, Tron’s prospects for continued expansion in the memecoin market look bright. Sun’s ethical guidelines for AI-driven memecoins also underscore Tron’s commitment to innovation with responsibility, making Tron a pioneering force in the memecoin space poised for the next wave of growth.

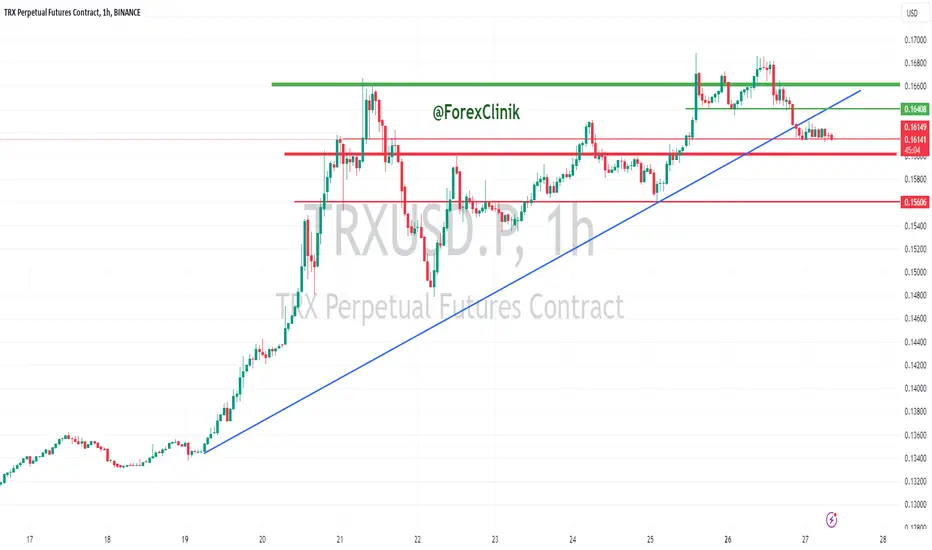
TRX and a broken trendline!hello guys.
as you can see trx broke the ascending trend and formed a head and shoulders!
we can get a position on the neckline or wait for a deeper correction!
target is 0.1548 and 0.1532.
let's see what happens

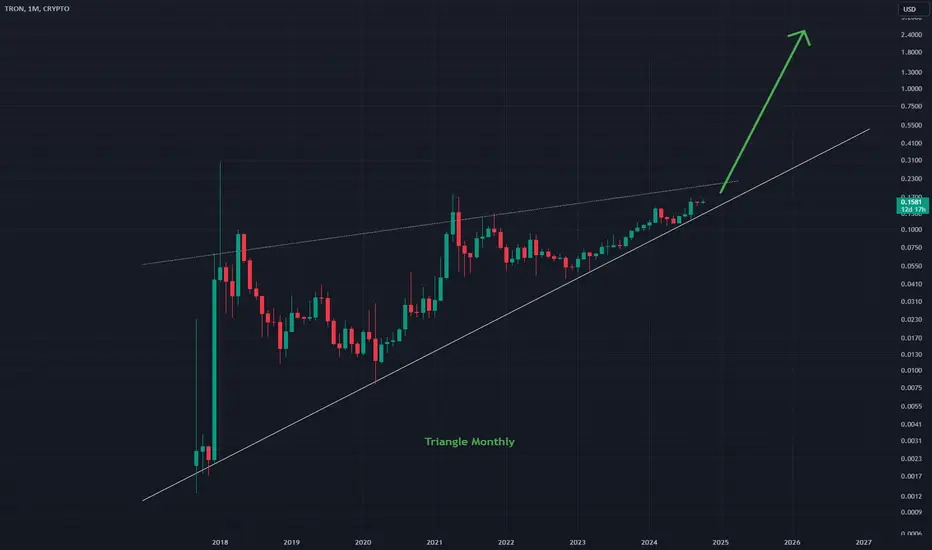
TRXUSD - Monthly TriangleI expect this to be a larger bull structure allowing fast growth for Tron once breakout occurs
The state is obviously bullish on this Monthly timeframe
Good buy for long
I think its an Ascending Triangle, if its something else clue me in below
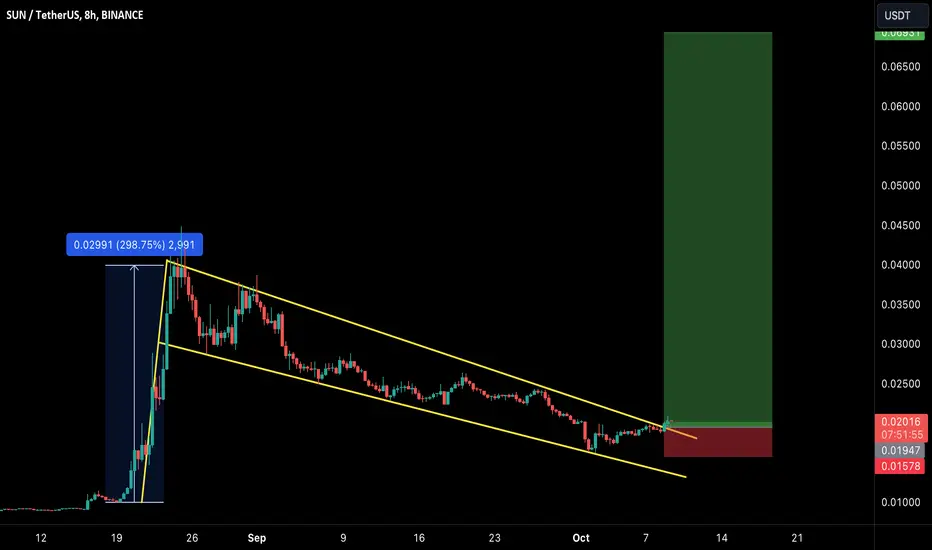
SUN/USDT Breakout Alert: Ready for 200-300% Gain!!Hey everyone!
If you're enjoying this analysis, please give it a thumbs up and follow!
SUN is showing strong potential! It has broken out of a bull flag structure on the daily time frame and is holding above the flag, signaling a bullish move. Buy now and accumulate more on dips for maximum gains!
Entry range: CMP and accumulate up to $0.0185
Target: 200-300% potential upside
Stop Loss (SL): $0.0158
What do you think of SUN's current price action? Are you spotting a bullish setup? Share your thoughts and analysis in the comments below!
TRXUSDT - TRX been trading in this upwards channel since JANTRX has been trading in this upwards channel since JAN 2024 and it looks like we are going to attempt to breakout towards the top. Should we fail we can expect a retrace towards the 0.618. With the launch of sun.pump and memecoins launching on the TRON network we can expect a bullish move over the next few months.

TRON Crypto + 3 Step Rocket Booster StrategyThe market is in a very steep decline.
Everything is on sale..and if you are into dip-buying
this is your moment
-
This is my first time experiencing
a dip buy in the market it kinda sucks
because the volatility is insane.
This is the time to focus on risk management
but if you are looking for a high
edge in the cryptocurrency side of things
then BINANCE:TRXUSDT
is the play I think that will
go on the high end of prices.
Which means:
#1-The price is above the 50 ema
#2-The price is above the 200 ema
#3-The price will go up in a trend.
Because this is a bear market
my last trade ideas have been dip-buy patterns
so if you got caught up in the volatility
without risk management am sorry
that's the nature of trading.
The 3 steps above are the rocket booster strategy.
Rocket boost this content to learn more.
Disclaimer: Trading is risky please learn risk
management and profit
taking strategies.
Because you will lose money wether you like it or not.

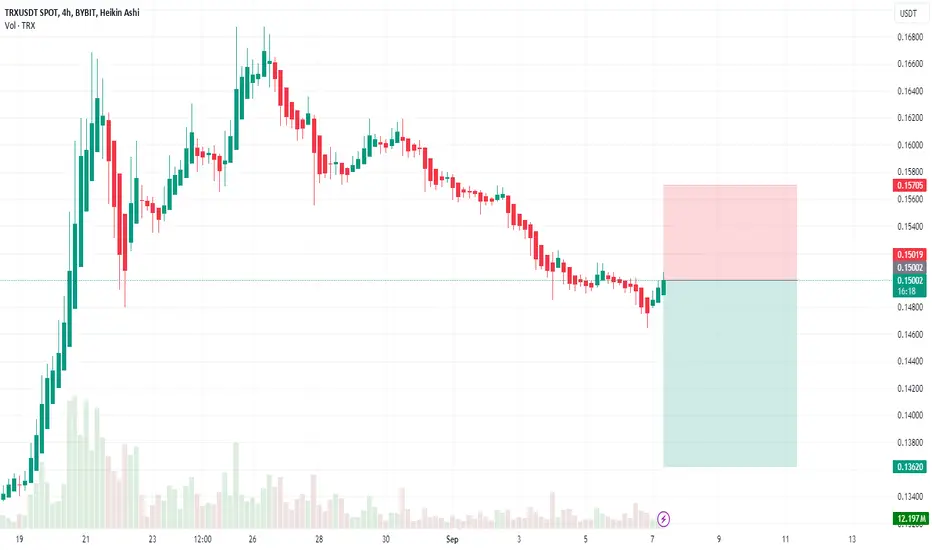
After VETUSDT —-> TRX 1:1 Long Setup SettingBINANCE:TRXUSDT
CRYPTO:TRXUSD
SL1 ---> Low-risk status: 3x-4x Leverage
SL2 ---> Mid-risk status: 5x-8x Leverage
👾The setup is active but expect the uncertain phase as well.
➡️ Entry Area:
Yellow zone
⚡️TP:
0.1556
0.1575
0.1595
0.1619
0.1640
🔴SL:
0.1460
🧐The Alternate scenario:
If the price stabilizes below the trigger zone, the setup will be cancelled.

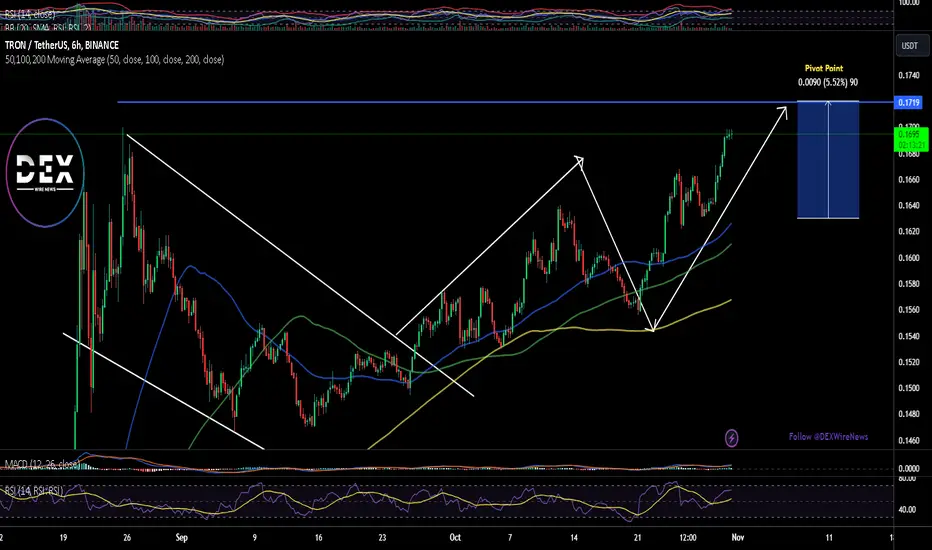
TRXUSDT Potential Up trend continuation after bounce from the suSince the launch of the platform for meme coins, the Tron network has garnered significant attention in the crypto space. The price action of TRXUSDT looks promising, characterized by a smooth formation of higher highs and higher closes. Recently, the market pulled back from the resistance zone and is now testing the support level at 0.1525, which has been respected twice before. There’s potential for the market to bounce back from this support level and the upward trendline, especially with the emergence of rejection candles. The target is the resistance zone at 0.1575

TRXUSDT | I am having mixed feelings on TRONLooking at the chart you can clear see TRX trading in a upwards channel. Looking at the RSI we are still trading in the middle of the range and there is definitely still a possibility that we can see another push up. However, looking at the volume, you can clearly see the volume decreasing and TRX loosing steam. The best outcome would be a healthy re-tracement to build up some momentum if we wanted to see TRX reach much higher prices
TRX, the UPSHIFT has started, the whole CRYPTO will SURGE!AMEX:TRX
DO YOU SEE WHAT I SEE?
MASSIVE ALERT!
When TRX reverses to the upside, It means the whole crypto market is preppin to move with it. USDT inflows will pick up pace signaling a buying spree event. Expect more than average upside momentum from this point onwards. Historically, this signal never misses. TRX moves first in advance, then the market gets moving after a while. Just like January 25, 2024 (BTC from 38k to 73k journey), TRX started ascending, then the market gets wild after a few days.
Get ready.
TAYOR

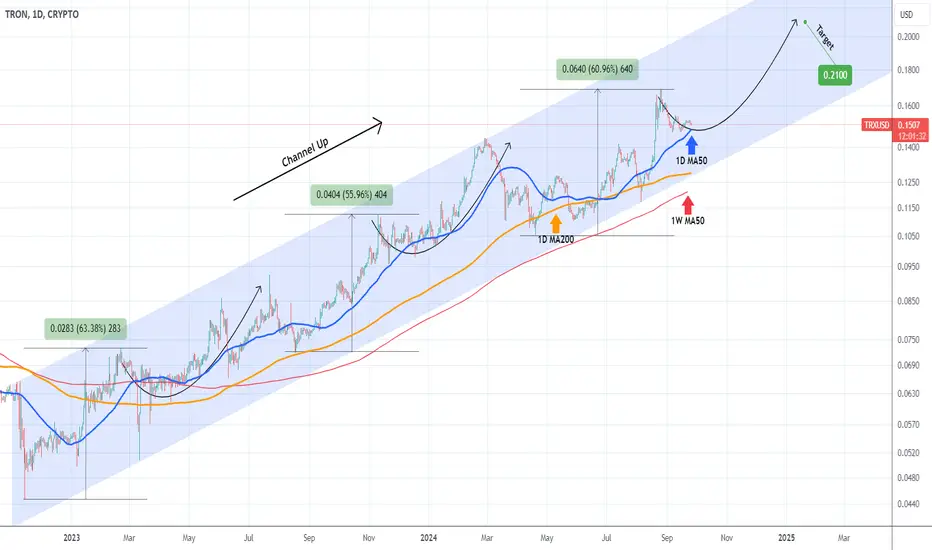
TRXUSD Buy opportunity below the 1D MA50.Tron (TRXUSD) has been trading within a Channel Up pattern since the November 14 2022 bottom. The price is now pulling back from the latest Higher High but remains above the 1D MA50 (blue trend-line).
This pattern indicates that after roughly every 55% - 65% rise, the price makes a pull-back and upon breaking below the 1D MA50, a buy signal emerges again. Wait until that and buy for the next Higher High. Our Target is 0.2100.
-------------------------------------------------------------------------------
** Please LIKE 👍, FOLLOW ✅, SHARE 🙌 and COMMENT ✍ if you enjoy this idea! Also share your ideas and charts in the comments section below! This is best way to keep it relevant, support us, keep the content here free and allow the idea to reach as many people as possible. **
-------------------------------------------------------------------------------
💸💸💸💸💸💸
👇 👇 👇 👇 👇 👇
TRX/USD Secondary trend (part) 18 11 2023Logarithm. Time frame 3 days.
The ascending channel in the lower part of the big triangle. Local work in it from the key support / resistance levels.
The whole range of this channel on a larger scale. .
Everything is more detailed and shown in the ideas of the main trend. .
TRX/USD Main trend. Channel. 17 11 2023
Note where this zone (channel) is in the main trend.
TRX Tron Elliott Wave RetracementsIf you haven`t sold TRX before the previous retracement:
Now according to the widely-followed Elliott Wave theory, the potential retracement targets for Tron are $0.14, $0.13, and $0.115.
I anticipate Tron will reach $0.115, driven by the legal issues surrounding its founder, Justin Sun, which are expected to escalate this year.

TRX (Crypto TRON-USD) SELL TF H4 TP = 0.1362On the H4 chart the trend started on Aug. 27 (linear regression channel).
There is a high probability of profit taking. Possible take profit level is 0.1362
Using a trailing stop is also a good idea!
Please leave your feedback, your opinion. I am very interested in it. Thank you!
Good luck!
Regards, WeBelievelnTrading
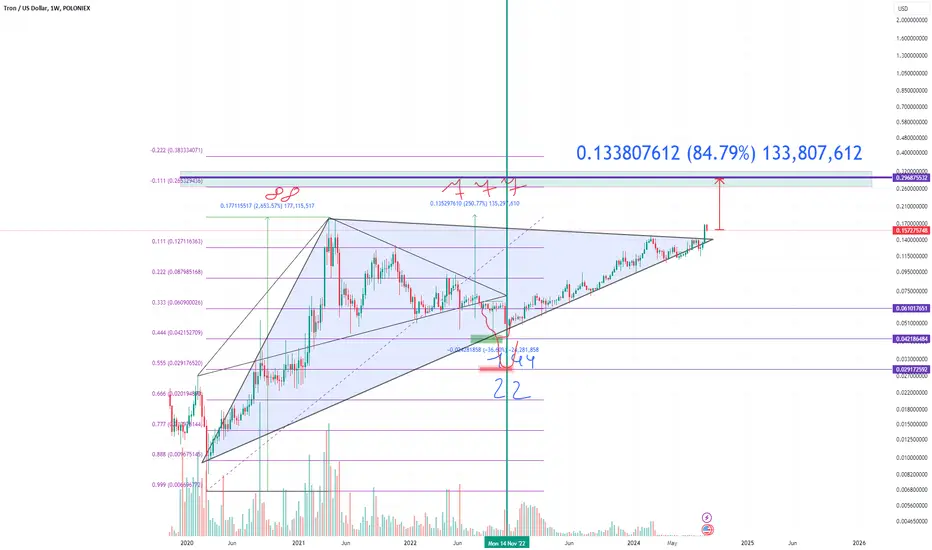
TRX +83%?The analysis is simply based on numerological fibonacci as we have broken the global triangle. For more details see the previous idea
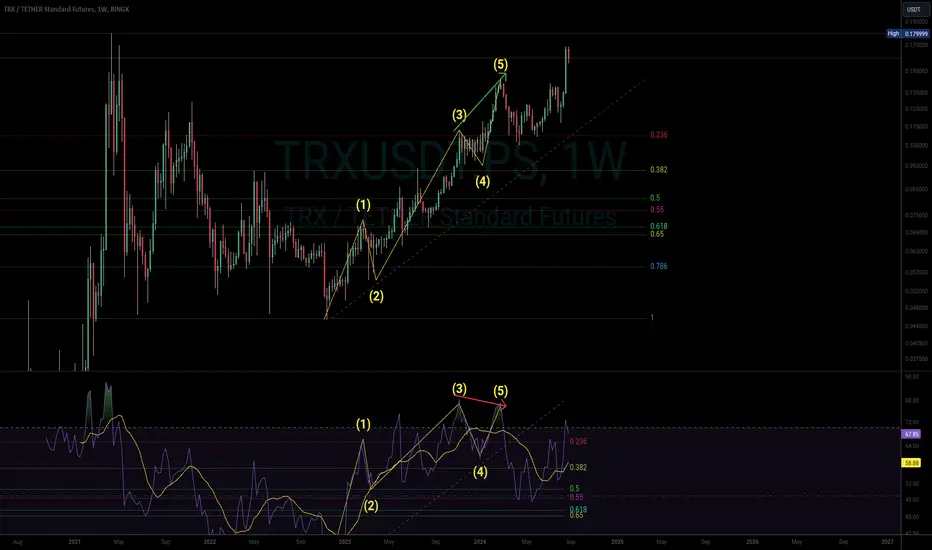
TRON's Wave 1 & 2 of current cycle over with. What Next?I believe that this cycle's wave 1 and its correction are done. Wave 2 being a shallow correction at Fib 0.236 gives us some clues as to what to expect next. Here's why I believe Wave 1 and its corrective wave 2 are past us and how wave 3 has already begun.
RSI bearish divergence (usually happens between the tops of wave 3 & 5 price action)
Correction to a significant fib level 0.236
RSI's significant correction and confluence at Fib .5 and RSI level 50.
And yes you can definitely apply Elliott Wave theory to the RSI signal, which I rarely see being applied here on TV. It helps confirm not-so-obvious EW charts.
So what do I expect to happen next? Either upcoming wave 3 or wave 5 will extend reasonably. I'm putting my money on wave 3 but won't rule out 5. The recent meme mania on TRON is shaping up quite nicely and could be the precusor of the extension and explosive price growth.
TRX (TRON): Overbought at ResistanceTrade setup: Price remains in an Uptrend. It bounced off of its long-term up trendline and 200-day MA, and resumed its uptrend. We removed it from our HOT list because it's overbought (RSI > 70) near $0.17 resistance, hence we're likely to see some profit taking near-term. We'd wait for a pullback. Nearest Fibonacci Retracement levels (possible support) are $0.16 (23.60%), $.15 (38.20%), and $0.14 (50%). Learn risk management in Lesson 9.
Pattern: Price is Overbought at Resistance. This trading strategy finds assets that are overbought (RSI > 70) and are near a resistance area, which means there's a high probability that price will get rejected and pull back near-term. Overbought conditions are typically reached when RSI hits 70 or more. Learn this trading strategy in Lesson 5.
Trend: Short-term trend is Strong Up, Medium-term trend is Strong Up and Long-term trend is Strong Up.
Momentum is Bullish but inflecting. MACD Line is still above MACD Signal Line but momentum may have peaked since MACD Histogram bars are declining, which suggests that momentum could be nearing a downswing. Price is neither overbought nor oversold currently, based on RSI-14 levels (RSI > 30 and RSI < 70).
Support and Resistance: Nearest Support Zone is $0.14, then $0.128. Nearest Resistance Zone is $0.17, then $0.20.


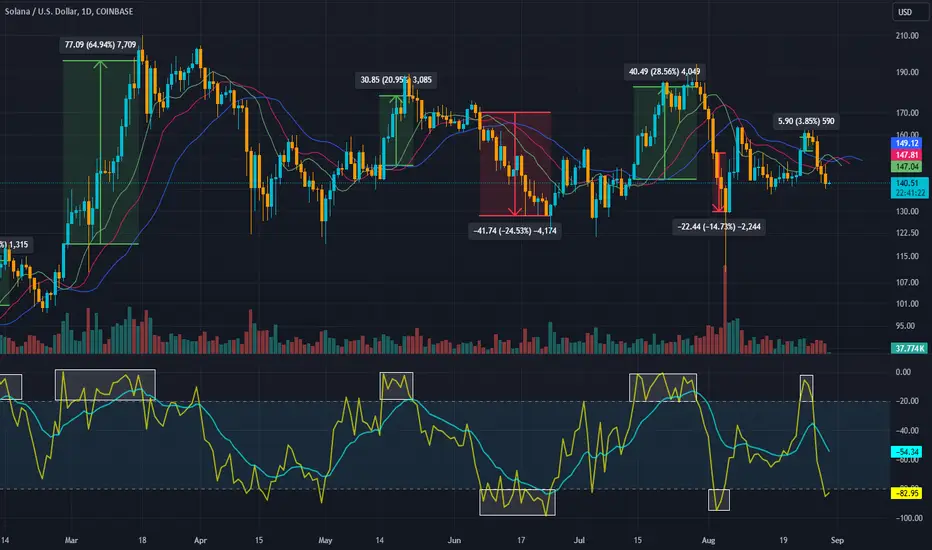
Biased SOL outlook%R has been a cheat code on the daily for Solana
Just dipped below the scary line again
If not a fakeout, could be good R/R
My View For TRON TodayMy View For TRON Today
These are some critical areas to watch for TRX.
The question is: after the consolidation on 1H time-frame, what next.