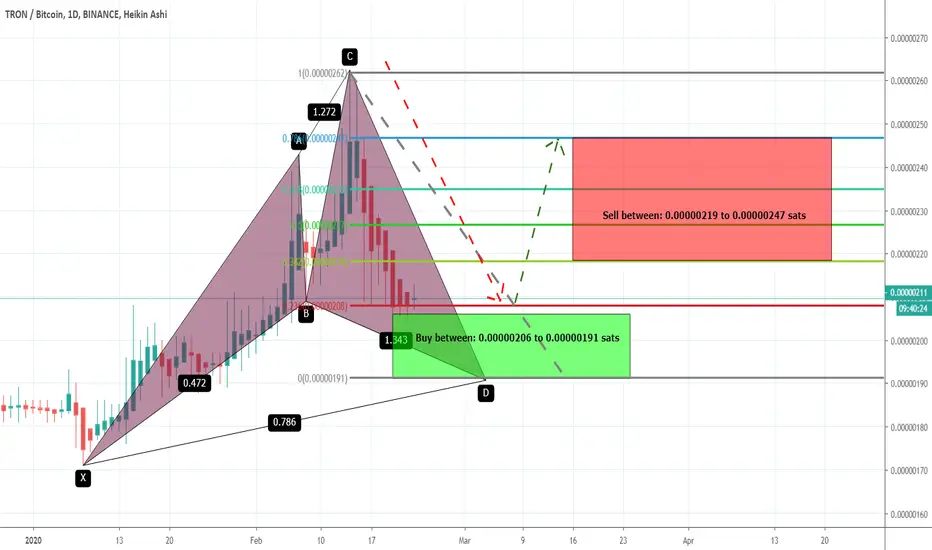
TRXBTC formed bullish Cypher | Upto 29% bullish move expectedPrice actions of Tron (TRX) with Bitcoin coin pair has formed bullish Cypher pattern and entered in bullish potential reversal zone.
Lets have a look on the TRX priceline's move:
After initial leg (X to A) the A to B leg is retraced between 0.382 to 0.618 Fibonacci and then B to C leg is projected between 1.272 to 1.414 of A to X leg's Fibonacci projection and final (C to D) leg is retraced between 0.618 to 0.786 Fibonacci projection of X to D leg for a perfect bullish Cypher and then the price action is entered in potential reversal zone of this bullish Cypher pattern, Now we can expect bullish divergence at any time which will lead the priceline between 0.382 to 0.786 Fibonacci projection of C to D leg, but after this bullish divergence if the candles sticks will be closed above 0.786 Fibonacci levels then it can also lead to the long term bullish move.
Buying And Sell Targets:
The buying and sell targets according to harmonic BAT pattern should be:
Buy between: 0.00000206 to 0.00000191 sats
Sell between: 0.00000219 to 0.00000247 sats
Stop Loss:
The potential reversal zone area which is up to 0.00000191 sats can be used as stop loss in case of complete candle sticks closes below this level.
I will be keep posting more trading ideas.
Tronbreakout
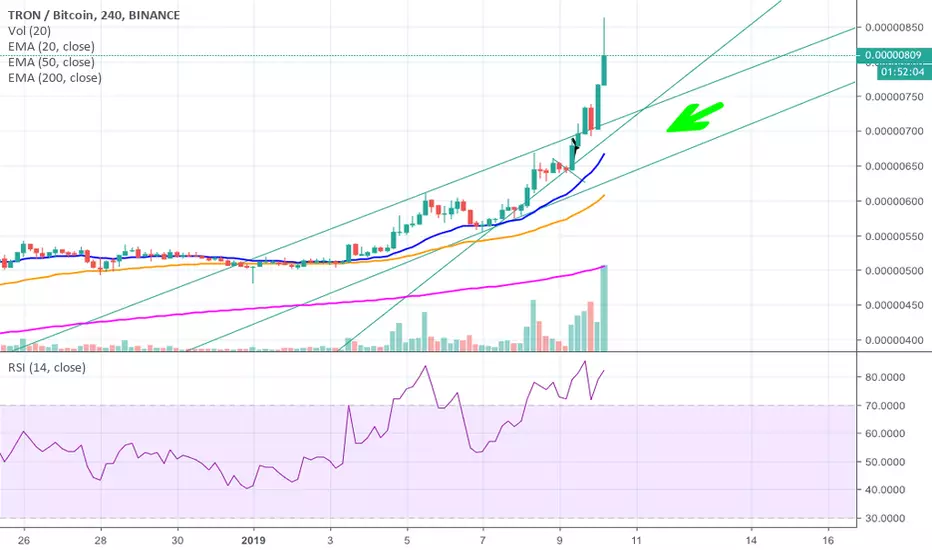
TRX / BTC - Bullish penant breakout and retest. Can fly to 230+Hi! TRX looks bullish.
Targets: 230, 270, 350, 420 satoshi
Stop: 166
Good luck!

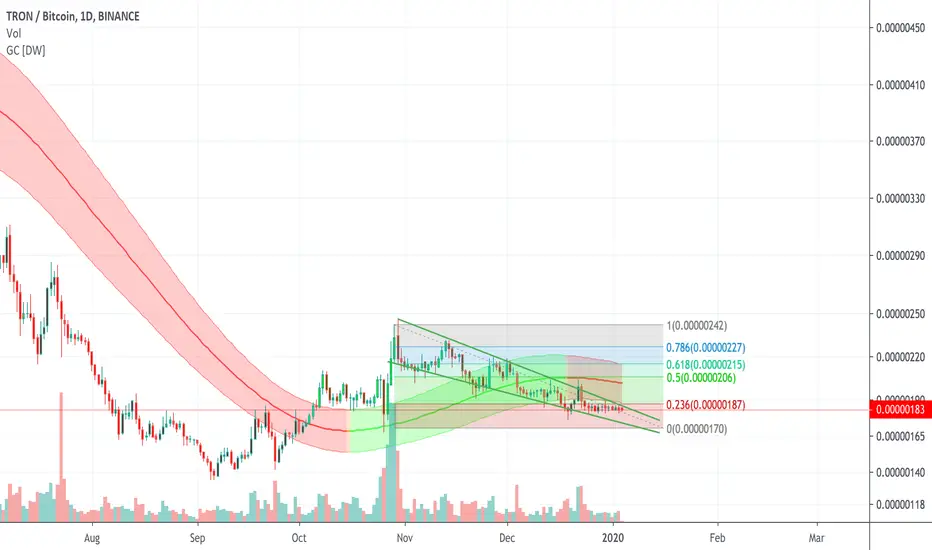
TRON Falling WedgeFalling Wedge setup. A lot of these seem to be forming amongst cryptocurrencies, maybe its just my selection preferences.. Included fibonacci retracement levels.
Inverted Head and Shoulders patterns are everywhereEven with our motherchip (Bitcoin), the structure is present. 2020 bull run might be sooner rather than later coming much earlier than expected?
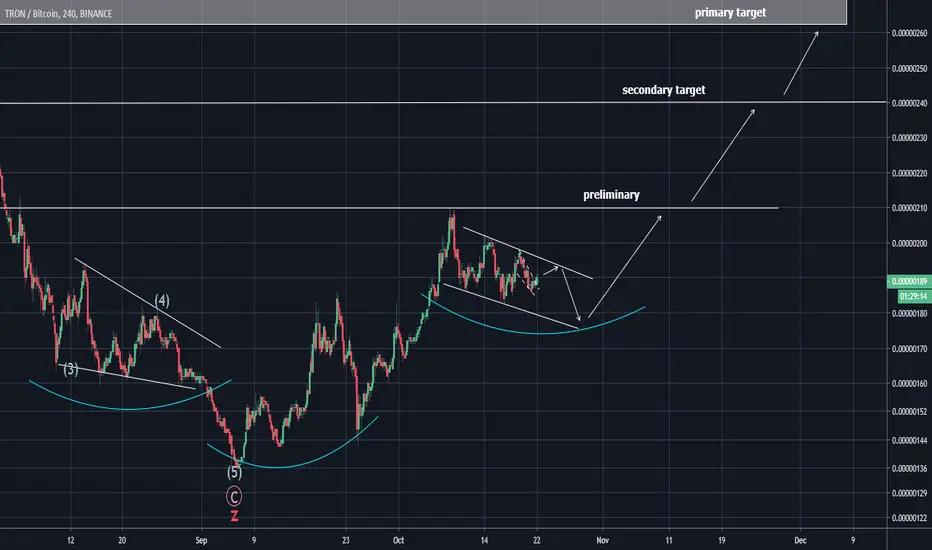
TRXZ19 TRON bullish breakout ?TRX bounce from 181 sats strong support. TRX was farmed HL formation at 183 sats. Finished ABC correction.
Price action above EMA 21,50,100,200 periods, Uptrend. Potential retest double bottom at 210 sats.
Volume: confirm bullish price action.
Pattern: ABC correction , Symetrical Triangle.
Indicators: MACD bullish crossover above zero line. RSI above 50 points. Bullish sign.
S/R: support 180, major support at 166 sats. Resistance at 200 psychology, Major Resistance 210 double top.
Disclaimer: THIS IS NOT FINANCIAL ADVICE. All the information shared here is for learning and entertainment purposes only.

TRX - Range ConsolidationI will build a strategy already from the exit from the range indicated on the chat
According to cluster analysis, sales have prevailed over the past three days. Was it profit taking or a short set?
Think for yourself? and share your opinion


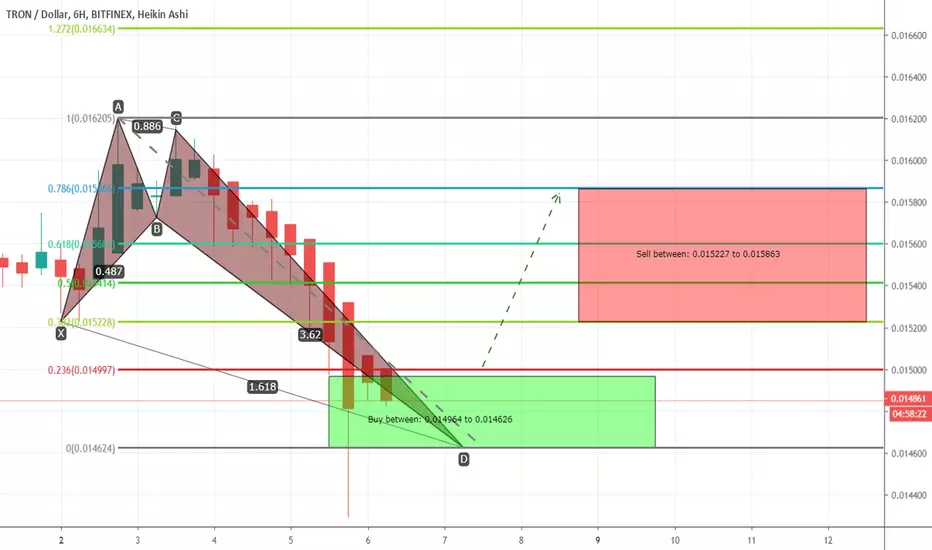
TRXUSD formed a bullish CRAB pattern | A good long opportunityIn my previous chart I published a BAT pattern but the price action has extended the leg and formed a bullish bulish CRAB pattern therefore I have revised the targets using Fibonacci sequence as below:
Buy between: 0.014964 to 0.014626
Sell between: 0.015227 to 0.015863
Regards,
Atif Akbar (moon333)
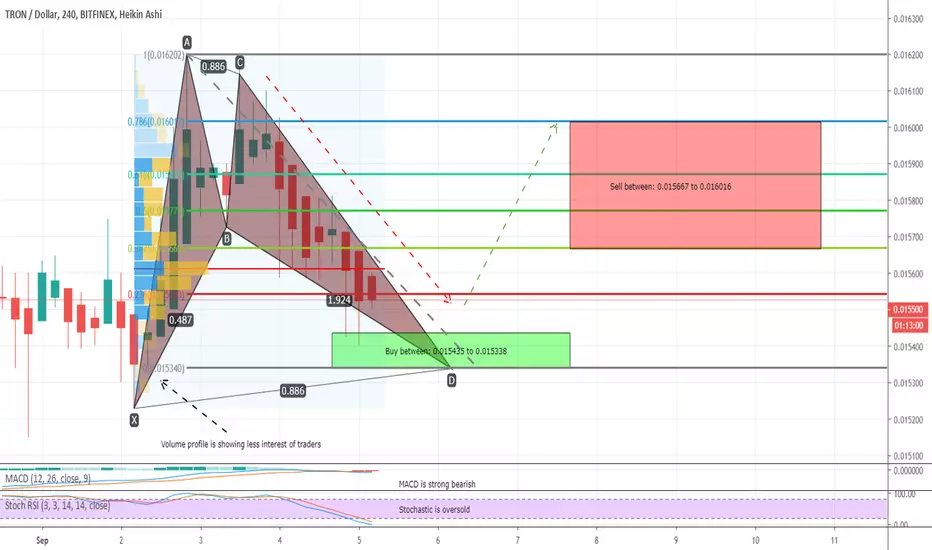
TRXUSD formed BAT pattern | A good long opportunityPriceline of Tron / Dollar has formed a bullish BAT and almost entered in potential reversal zone to hit the sell targets soon insha Allah.
Volume profile is showing less interest of traders within potential reversal zone.
MACD is still strong bearish and stochastic did not give any bull cross sofar therefore I would suggest to wait for MACD to turn weak bearish or for stochastic bull cross signal then buy.
I have defined targets using Fibonacci sequence:
Buy between: 0.015435 to 0.015338
Sell between: 0.015667 to 0.016016
Regards,
Atif Akbar (moon333)
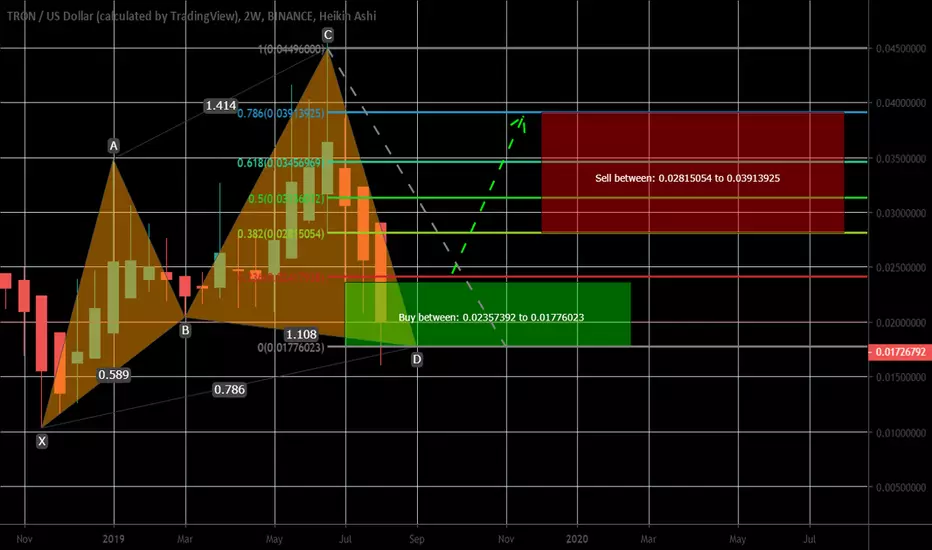
TRXUSD has formed bullish cypher | Upto 120% profit potentialPriceline of TRON / US Dollar has formed a bullish cypher pattern and entered in potential reversal zone.
From here the price action can move up to hit the sell targets soon insha Allah.
I have defined the targets using Fibonacci sequence and the targets are:
Buy between: 0.02357392 to 0.01776023
Sell between: 0.02815054 to 0.03913925
Regards,
Atif Akbar (moon333)
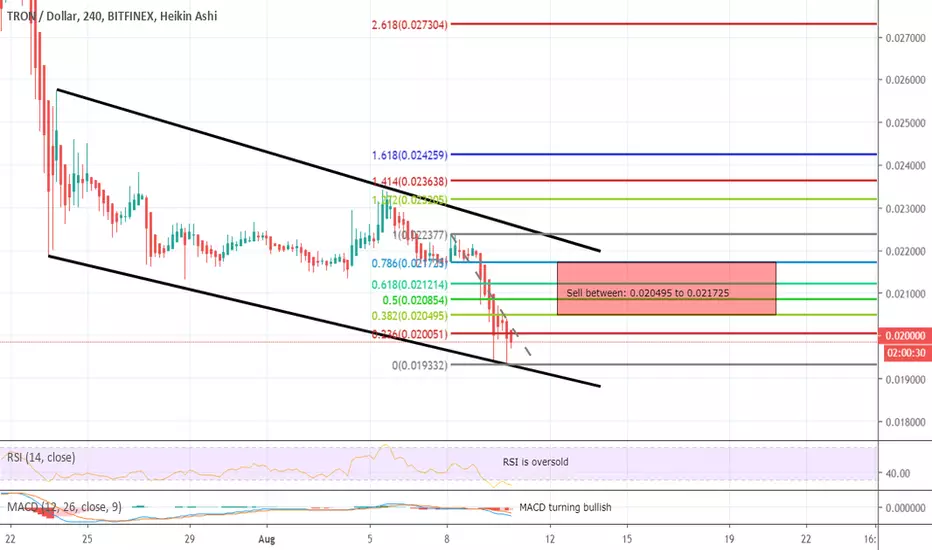
TRXUSD hit the channel's support a good long opportunityPriceline of TRON / US DOLLAR hit the down channel's support.
RSI is oversold.
MACD turning bullish.
I have defined sell targets using Fibonacci sequence as below:
Sell between: 0.020495 to 0.021725
Regards,
Atif Akbar (moon333)
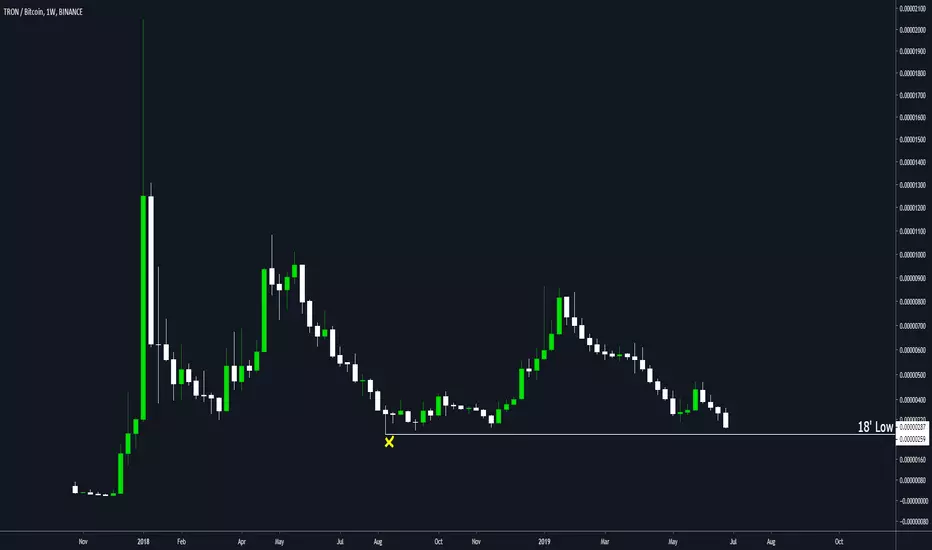
TRX Thoughts$TRX
We haven't taken out the 18' low, and we're currently resting beneath the range low. I would personally be patient with this and sit on the sidelines until we get some closes back into the range.

TRON TRX Supercycle - Realistic target around 1.13$ Hi everyone,
thanks for visiting this page and having some interest in TRON TRX cryptocurrency. Tron will begin it's ascension in SuperCycle Wave 3 during the next bullmarket and i would like to share some realistic targets for long term hodlers.
SuperCycle Wave 3 most common targets :
161.8% = 0.57742512 minimum target
200% = 0.71117835
261.8% = 0.92756447 expected target
361.8% = 1.27770382 expected target
461.8% = 1.62784317

TRX Scalp Trade ideaClear invalidation beneath the POC/recent HL, bullish divs on the 4H, exit at the first trouble area, lunch is on me.
R: 2.83

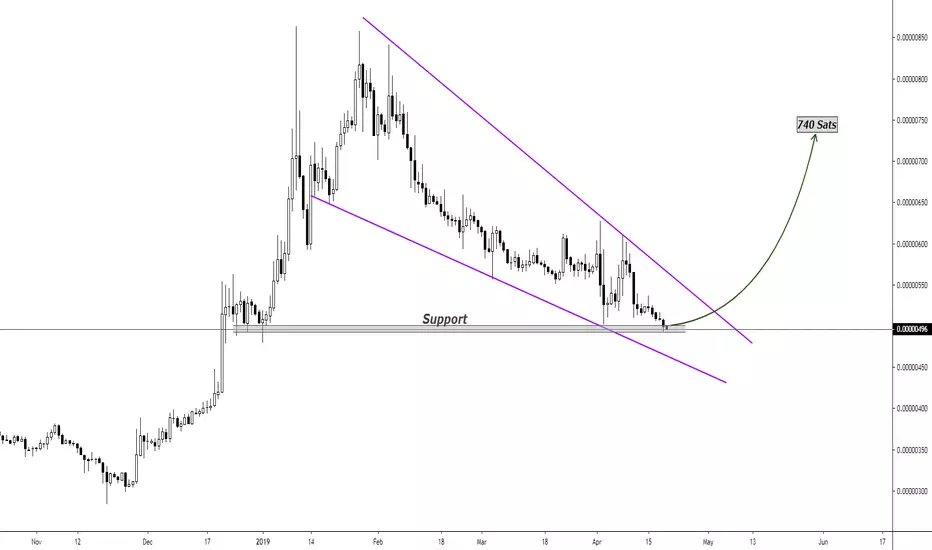
TRX (Tron) Breakout Soon..!!#TRXBTC (Binance)
Looking Stable & Bullish On This Support..
So Keep An EYE On It.
Buying Zone Above Support Zone..
Sell Target For Midterm Is 740 Sats
Stop Loss Below Support AREA..
Introduction...!!
TRON (TRX) strives to build the future of a truly decentralized internet and global free content entertainment system that utilizes blockchain technology. The TRON Protocol represents the architecture of an operating system based on the blockchain which could enable developers to create smart contracts and decentralized applications, freely publish, own, and store data and other content. According to the TRON Foundation, the ecosystem surrounding this network specializes in offering massive scalability and consistent reliability capable of processing transactions at a high rate via high-throughput computing.
Hit Like & Follow Us..
Thanks
TRX Ready For GainsWelcome Back!
Ready for another coin ready to move?
Today we will be talking about TRX or Tron!
This one is pretty self explanatory.. Massive Inverse Head and Shoulder coming at the end of a long retrace? Could it be any easier?
We got rejected at resistance however, now is a great time to accumulate before the coming breakout.
Lot's of people call this coin a scam! Something I can tell you from personal experience is scams pump the hardest ;)
I will update as the trade takes footing...

TRON setting up for a 4x leverage tradeHowdy people :)
TRX has been a leading the charges this year with break-outs. As i see it here as the rest of the market is in a sideways consolidation with a good chance of making a break up, TRX is about to setup a H&S.
I have a quick spread of 3 buy levels here as I am taking this as my month gamble swing, so I have 2 levels in for the H&S, and 1 level down low encase it breaks down, canceling the H&S...I will try to make a new low buy inn on the lowest level TRX has hit in the past year.
I have been waiting for a good trade to throw my fun money on, and this looks like it. Be safe, use protection, and dont try this at home of course :)
TARGETS: you do the math...usual target for H&S, measure the neck line
ARE YOU READY TO BUY THE TRON/TRX DIP?Hey Fellow Traders!
TRX is back on uptrend and we saw a great channel breakout but guess what we are going back soon to our support!
Why?
Because it's too much overbought!
So, Where is our support?
It's the blue line on the chart! Our 20-DAY EMA and we are be going back there in a couple of days!
Keep watching to buy-in!
Thank You
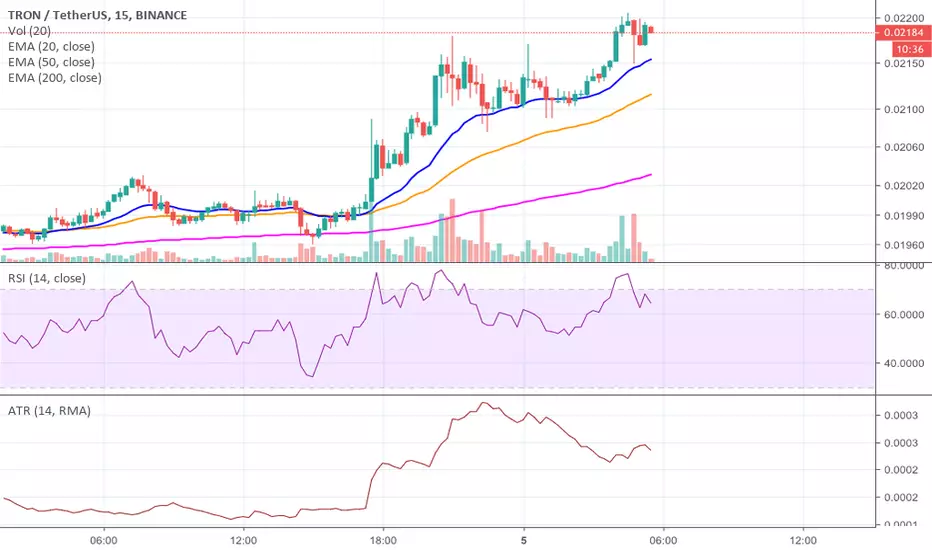
EASY TRON/TRX TRADE BUY OPPORTUNITY!BINANCE:TRXUSD
Hey fellow traders!!!
Here is an Easy short-term trade opportunity for you...
As you can clearly see we are moving upwards and holding strong support over the 200 day EMA on a 15 min chart.
So, Our buy zone would be clearly at the 200 day EMA on a 15 min chart as we bounce back every single time from here!
P.S. be patient and wait for the prices to touch/pass the 200 day EMA to Buy-In for an easy short-term profitable trade.
Good Luck!
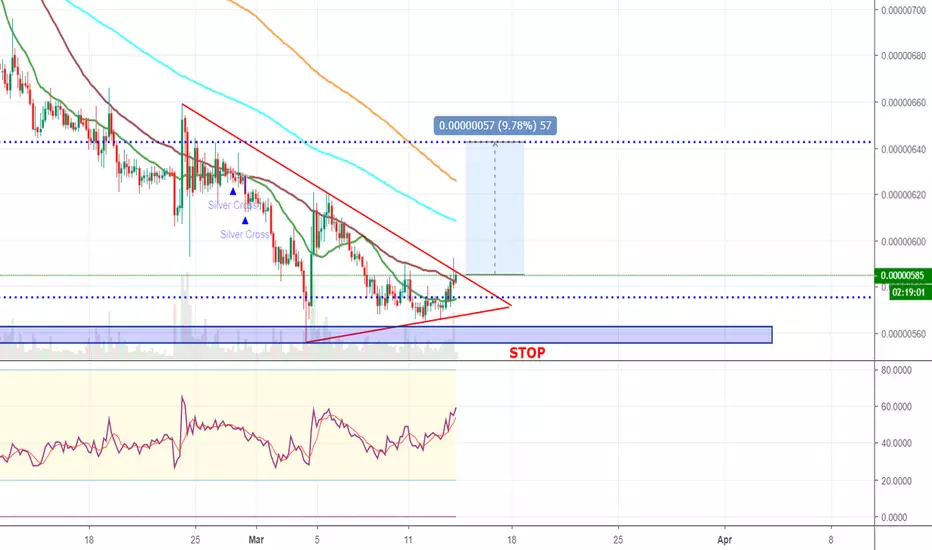
TRX/BTC Upward Break PotentialHere for a quick look at the TRX/BTC pair on Binance.
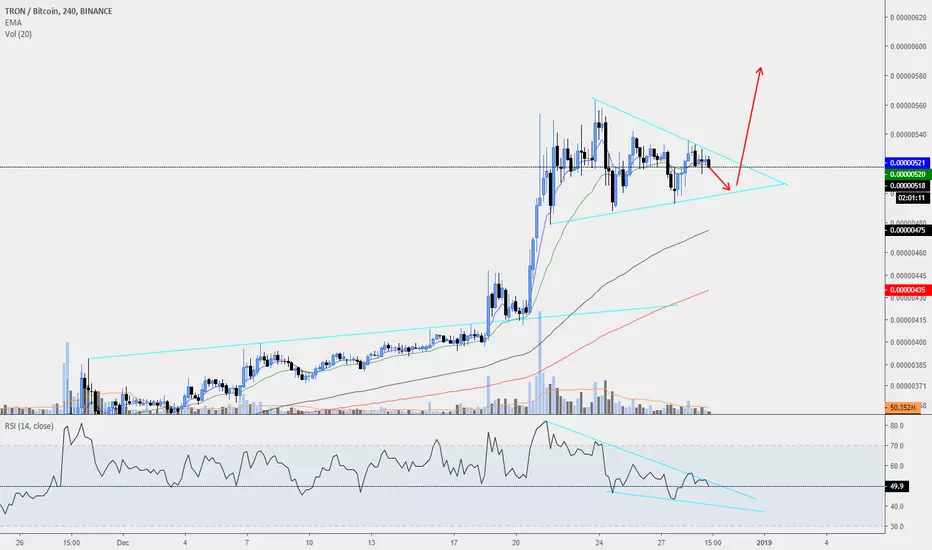
BINANCE:TRXBTC Potential for an upward break, 4H RSI rising wedge along with a nice looking bull pennant.
A break of the pennant is setting my target in the 580 Sat region.
Entry: on breakout
Stop-Loss: below support of pennant
Target: 580 Sats