Tron (TRX) Price Prediction: Nasdaq Deal Fuels Bullish ForecastThe $210 Million Nasdaq Rumor: Deconstructing the Hype for a Realistic Tron (TRX) Price Prediction
In the volatile theater of cryptocurrency, headlines can ignite market-moving frenzies, and few have been as potent as the recent whirlwind of news surrounding Tron (TRX). The prospect of a planned Nasdaq listing via a $210 million reverse merger, intertwined with the enigmatic presence of the Trump family, sent shockwaves through the community, promising a new era of mainstream legitimacy and sparking wildly bullish price predictions. However, as the dust settles, a clearer, more nuanced picture emerges—one that separates explosive rumors from the fundamental drivers that will truly dictate the future of Tron's price.
The core of the excitement stemmed from a strategic deal involving SRM Entertainment, a Nasdaq-listed company specializing in theme park merchandise. In a stunning pivot, SRM announced it would rebrand as Tron Inc., initiate a substantial TRX treasury funded by a $100 million private equity investment, and appoint Tron's founder, Justin Sun, as an adviser. This "reverse merger" was widely interpreted as a backdoor for the Tron blockchain to gain a coveted spot on a major U.S. stock exchange, a move that would grant it unprecedented access to traditional capital and validation. Adding a layer of political intrigue, the deal was facilitated by an investment bank where Eric Trump and Donald Trump Jr. serve on the advisory board.
This confluence of high finance, crypto ambition, and political association created a perfect storm for speculation. The stock price of SRM Entertainment skyrocketed over 500%, and the price of TRX saw a notable jump. However, the narrative quickly became more complex. Eric Trump clarified his position, denying any direct "public involvement" in the new company, despite expressing his admiration for Justin Sun and their established business connections.
While the deal with SRM Entertainment is very real, its direct implications for the TRX token are more complex than a simple "Nasdaq listing." The transaction is for the corporate entity, which will hold TRX in its treasury, not for the decentralized TRX asset itself to be traded on Nasdaq like a stock. This distinction is critical. The move provides Tron with a publicly-traded vehicle and significant capital, but the ultimate value of TRX still hinges on the utility and adoption of the Tron network itself. Therefore, a realistic price prediction must look beyond the initial hype and analyze the bedrock of Tron's fundamentals.
Deconstructing the Hype: The Nasdaq Deal and Trump Connection
The plan for SRM Entertainment, a Florida-based supplier of toys and souvenirs, to morph into Tron Inc. is a masterclass in financial engineering. Through a reverse merger, a private company (in spirit, Tron) can go public by merging with an existing publicly-traded company (SRM), bypassing the rigorous and lengthy process of a traditional Initial Public Offering (IPO).
The deal, valued at up to $210 million upon full exercise of warrants, involves SRM receiving a $100 million equity investment from a private investor to initiate a "TRX Treasury Strategy." This strategy mirrors the approach of companies like MicroStrategy with Bitcoin, where the public company's assets are heavily invested in a specific cryptocurrency, making its stock a proxy for that asset. With Justin Sun serving as an adviser, the new Tron Inc. plans to implement a TRX staking program and even a dividend policy for its shareholders, further intertwining its fate with the Tron ecosystem.
The involvement of the investment bank brokering the deal brought the Trump name into the headlines. Eric Trump and Donald Trump Jr.'s roles on the bank's advisory board led to speculation about their involvement in the new Tron Inc. However, Eric Trump later clarified his position, separating his personal and business relationships from a formal executive role in the public venture, though the connection undeniably added to the initial media frenzy.
Beyond the Rumors: Tron's True Fundamental Strengths
With the Nasdaq hype contextualized, the real question for investors is: what is the intrinsic value of the Tron network? The answer lies in its undeniable dominance in one of the most crucial sectors of the digital economy: stablecoins.
The Undisputed King of USDT
The Tron network has become the world's primary settlement layer for Tether (USDT), the largest stablecoin by market capitalization. The network hosts over $78 billion in USDT, a figure that has surpassed the amount on its main rival, Ethereum. This dominance is not accidental. Tron's architecture, which allows for high throughput and extremely low transaction fees, makes it the preferred network for USDT transfers, especially for retail users and in emerging markets.
During a single month in mid-2025, the Tron network processed over $694 billion in USDT transfers through nearly 90 million contract interactions. The vast majority of USDT holders on Tron are retail users with balances under $1,000, highlighting the network's deep penetration into everyday peer-to-peer and remittance use cases. This immense and consistent utility generates real, sustained demand for the network, forming the most solid pillar of its valuation.
A Growing DeFi and dApp Ecosystem
While stablecoins are its main draw, Tron's Decentralized Finance (DeFi) ecosystem is also substantial. The network holds a Total Value Locked (TVL) of over $8 billion, placing it among the top layer-1 blockchains. Platforms like the lending protocol JustLend and the decentralized exchange SunSwap are key contributors to this activity.
The network has processed over 10.5 billion transactions from more than 313 million user accounts, demonstrating a vibrant and active user base. Although a recent decline in TVL from its peak and slowing DEX volume has been observed, the sheer number of daily active users and transactions suggests a pivot towards non-DeFi dApps and peer-to-peer transfers, reinforcing its utility beyond pure financial speculation.
Tron (TRX) Price Prediction: Technical Analysis and Future Outlook
Given the strong fundamentals, particularly its role as the leading stablecoin platform, what can be expected from the TRX price?
Technical Indicators
As of mid-2025, TRX has shown resilience. Technical analysis reveals a generally neutral to bullish sentiment. The price has been consolidating in a horizontal channel, with key resistance and support levels being closely watched. Bullish signals, such as a "golden cross" and a bullish MACD crossover, suggest potential for upward momentum. A key indicator of its potential is its market-cap-to-TVL ratio, which, at 0.26, suggests the coin may be significantly undervalued compared to the value of the assets secured on its network.
Price Forecasts for 2025 and Beyond
Price forecasts for the end of 2025 vary but are generally optimistic, contingent on broader market conditions.
• Conservative Outlook: A conservative forecast places the potential price of TRX in a range between $0.18 and $0.35 for 2025. A move toward the upper end of this range would depend on a sustained crypto bull market and continued growth in Tron's user base.
• Bullish Scenario: An optimistic forecast suggests that if a full-blown "altseason" takes hold, TRX could surpass its previous highs and target levels between $0.45 and $0.70. Some long-term models even project a path toward $1.00 or higher by 2030, assuming Tron maintains its competitive edge and expands its use cases.
• Bearish Scenario: Risks remain. A regulatory crackdown on stablecoins, particularly Tether, could disproportionately impact Tron. Furthermore, a recent $2 billion drop in its DeFi TVL, despite user growth, suggests a potential weakness in its financial ecosystem that warrants monitoring. In a bearish turn, TRX could fall back to support levels around $0.21 or lower.
The "100x Gem" Fallacy
The headlines promoting Tron's Nasdaq deal were often accompanied by mentions of speculative new tokens like "BTC Bull Token," promising astronomical 100x returns. It is crucial for investors to recognize this as a common marketing tactic that leeches onto legitimate news to promote highly speculative and often worthless assets. The future success of Tron will not be found in chasing such gambles, but in the sustained growth of its core network. The real "alpha" is in understanding the fundamental utility that drives billions of dollars in transactions daily, not in lottery-ticket tokens.
Conclusion: A Bullish Continuation Built on Reality, Not Rumor
The story of Tron's Nasdaq listing is a potent reminder of the crypto market's susceptibility to hype. While the reverse merger with SRM Entertainment is a significant strategic maneuver that provides Justin Sun's ecosystem with a public-facing entity and a war chest, it is not the magic bullet that guarantees a higher TRX price.
The true bullish case for Tron is more mundane but far more powerful. It is the network's unparalleled dominance as the world's preferred highway for stablecoin transactions. This utility provides a constant, powerful demand for the network's resources. As long as Tron remains the fastest, cheapest, and most accessible platform for billions of dollars in daily USDT transfers, its intrinsic value will continue to grow.
The Nasdaq deal is a catalyst, but the engine is the ecosystem. Investors looking for a bullish continuation should focus on the steady hum of that engine—the growth in active wallets, transaction counts, and stablecoin volume—rather than the fleeting roar of market rumors. Based on these fundamentals, a steady, upward trajectory for TRX seems not only possible but probable, with the potential to retest and surpass previous highs as the digital asset market matures.
Tronusdt
TRX/USDT Trade Setup & Why This Fibonacci Level Matters🚨 TRX/USDT Trade Breakdown 🔍💹
Taking a close look at TRX/USDT (Tron) — the chart is showing a strong, sustained bullish trend on the 4H timeframe 📈🔥.
At the moment, I’m waiting for a pullback into equilibrium ⚖️. If we apply a Fibonacci retracement from the current swing low to the recent high, the 50% level stands out as a key area of interest for a potential entry 🎯.
🧠 This zone offers a high-probability area to look for trend continuation, provided price respects it and holds structure. My Fibonacci tool also outlines projected targets, and I walk you through everything in the video 📽️🗺️.
📌 This is NOT financial advice — just my personal analysis and approach. Always do your own research and manage your risk accordingly. ⚠️
👇 Let me know your thoughts in the comments and don’t forget to like & subscribe for more setups!
TRX/USDT Trade Setup & Why This Fibonacci Level Matters

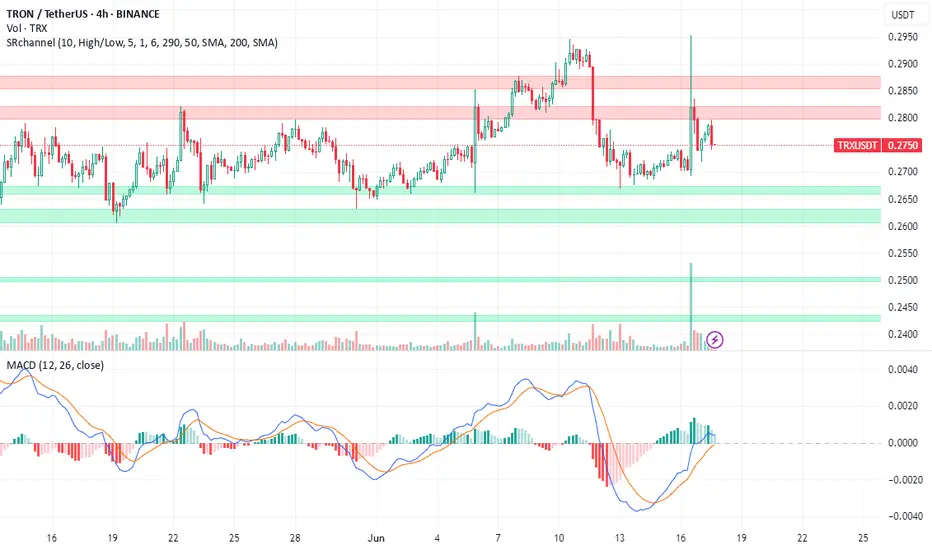
Liquidity Grab Ahead? Why TRX (Tron) May Retrace Soon TRX (Tron) is currently trading near a significant resistance zone, aligning with the upper boundary of a descending channel on the 4-hour timeframe 📉. This area is likely to hold liquidity in the form of buy stops resting above the previous range highs. Given the broader downtrend and the strong resistance overhead, the price may retrace as it taps into this liquidity pool.
This setup presents a compelling short opportunity, with the expectation that TRX will reject this level and move lower, targeting support zones below. Traders should remain cautious and monitor price action closely for confirmation before entering a position ⚠️.
Disclaimer: This analysis is for informational purposes only and does not constitute financial advice. Cryptocurrency trading involves significant risk, and you should consult with a financial advisor before making any investment decisions. Always trade responsibly! 🚨

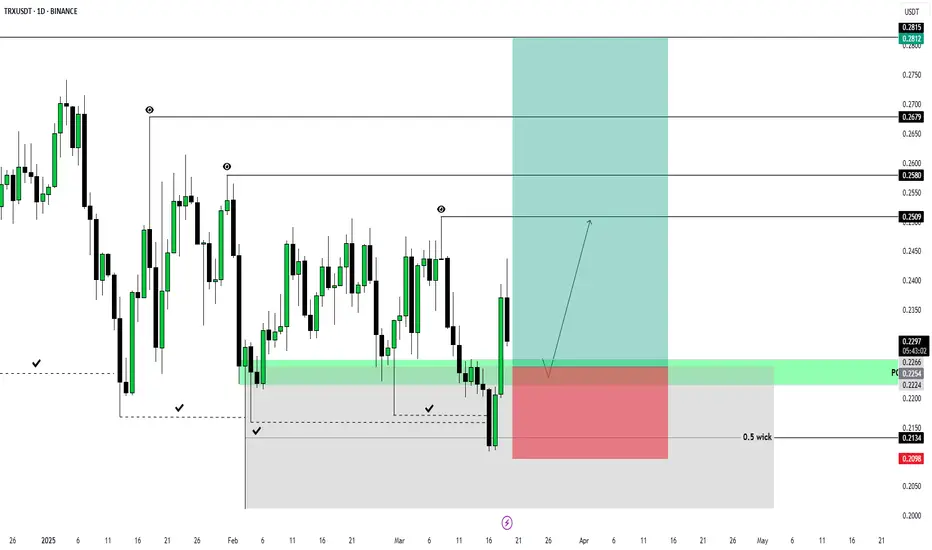
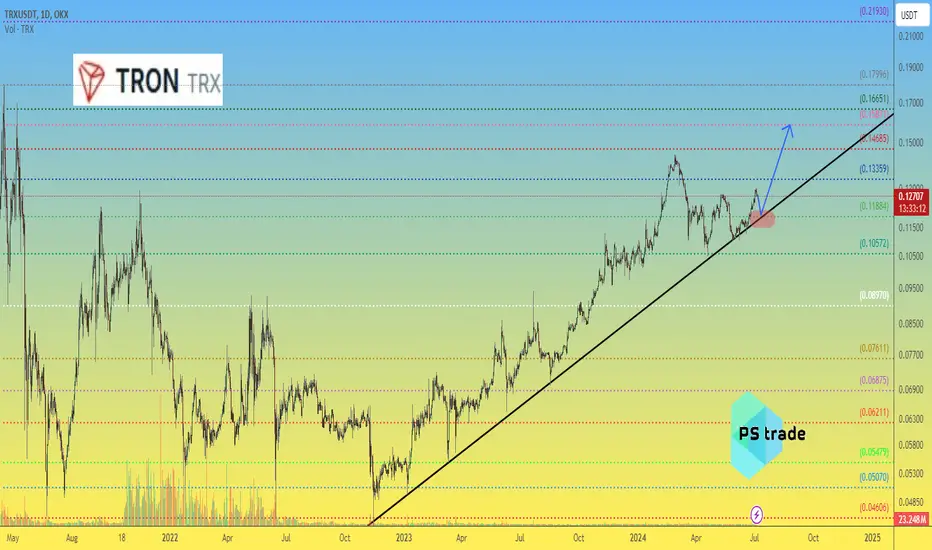
TRXUSDT 1D LONGStudying the market, I have not traded much lately. Daily manipulation, as daily news very often breaks formations and trends within the day.
Therefore, I decided to look at 1D TF and I really liked the situation with TRX
Most likely, the price is in the final stage of reaccumulation before aggressive growth.
I am waiting for the testing of the bullish POI to start looking for an entry point into the position and work out such targets:
$0.2509
$0.2580
$0.2679
$0.2815
Risk for stop order -1%
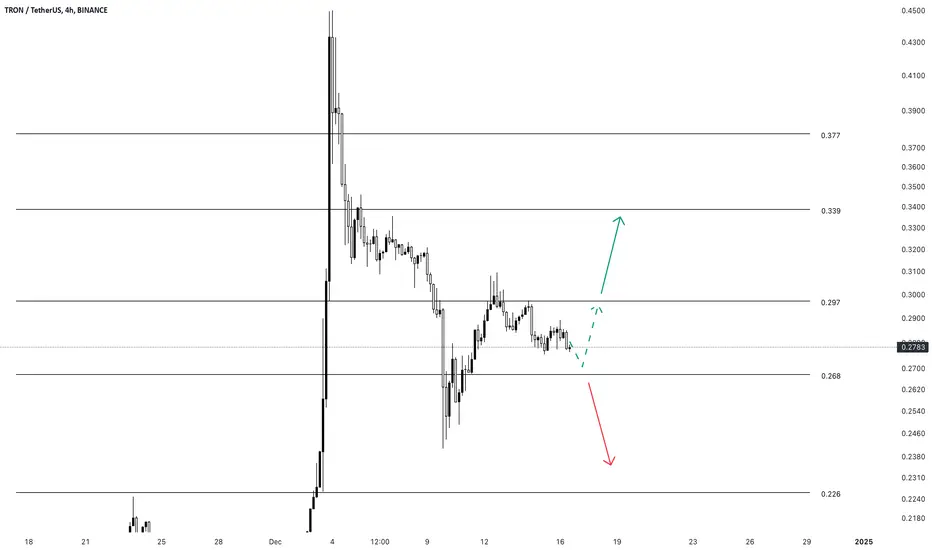
$0.268: Tron TRX Last Stand?Tron is currently trading below the resistance at $0.297, the area characterised by slow and choppy price action.
1. A bounce from the nearby support level at $0.268 could suggest renewed buying interest, setting the stage for a potential move toward $0.297 (Dashed Green Projection).
2. A break and close above this level would indicate bullish strength, opening the path toward the next resistance at $0.339, followed by $0.377, providing room for a broader recovery (Solid Green Projection).
3. Conversely, if TRX fails to hold $0.268, it would indicate increasing bearish momentum, likely triggering a decline toward the key support zone at $0.226 (Red Projection).
Tron Futures Signal / 3x-5x LeverageBINANCE:TRXUSDT
CRYPTO:TRXUSD
📈Which side you pick?
Bull or Bear
SL1 ---> Low-risk status: 1x-2x Leverage
SL2 ---> Mid-risk status: 3x-4x Leverage
(If there is just one SL on the chart, I suggest, low risk status)
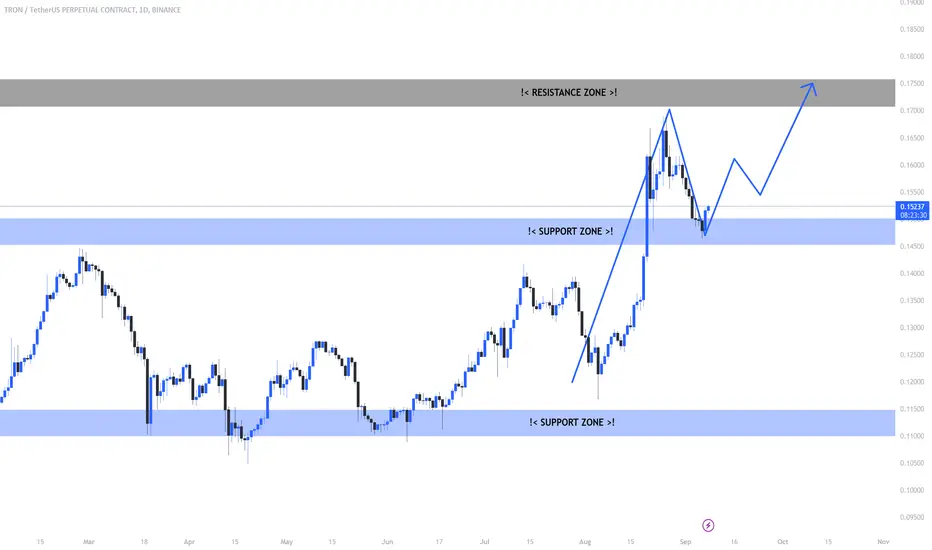
Considering the price trend in its previous channel, by repeating the stabilization of the price at the bottom of the second parallel channel, it can be expected that the price will continue to move up to the top of the new channel.
The price breaking above the specified level can increase the certainty of the realization of the price target.
The price falling below the red level cancels the bullish scenario of Binance Coin.
Potential price targets for the levels will be $950 and $1,447.
👾Note: The setup is active but expect the uncertain phase as well. also movement lines drawn to predict future price reactions are relative and approximate.
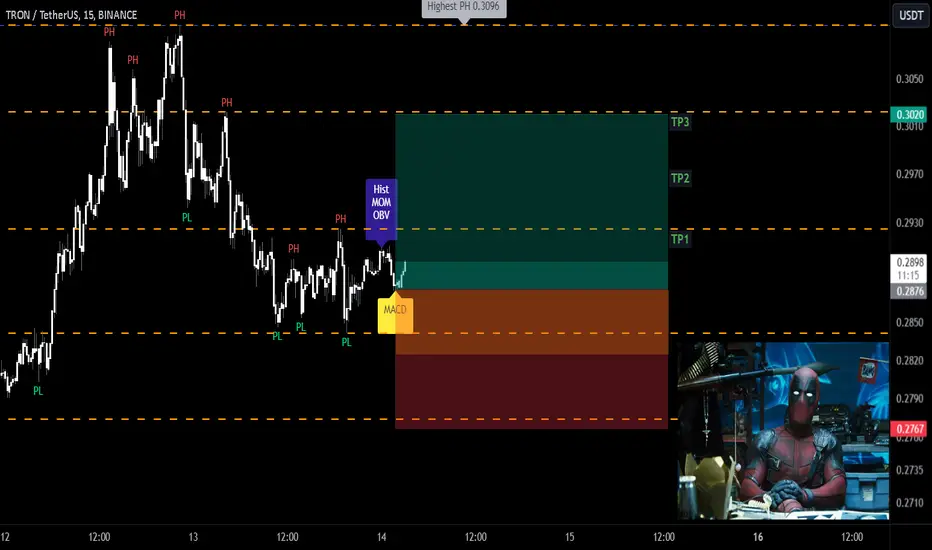
➡️Entry Area:
Yellow zone
⚡️TP:
0.2919
0.2968
0.3020
🔴SL:
0.2767
🧐The Alternate scenario:
If the price stabilizes against the direction of the position, below or above the trigger zone, the setup will be canceled.
Market Outlook: Positive Trends in TRX/USDT Suggest Bullish!Hello Traders,
Just Breaked The Resistance Zone And Taking Support And There is A Potiential Chance To Go Upside!
We have one Resistance Zone, and 2 Supply Zones. The Price Breaked The Resistance Zone, And Becames The Support Zone, Take Entry While Retesting OR Pullback of The Move.
Please Note That The Only Purpose of The Information On This Page is Purely Educational.
I Would Welcome Your Participation And Support in the Form of Likes, Comments, And Follow us to Offer Some Encouragement.
Thank You.
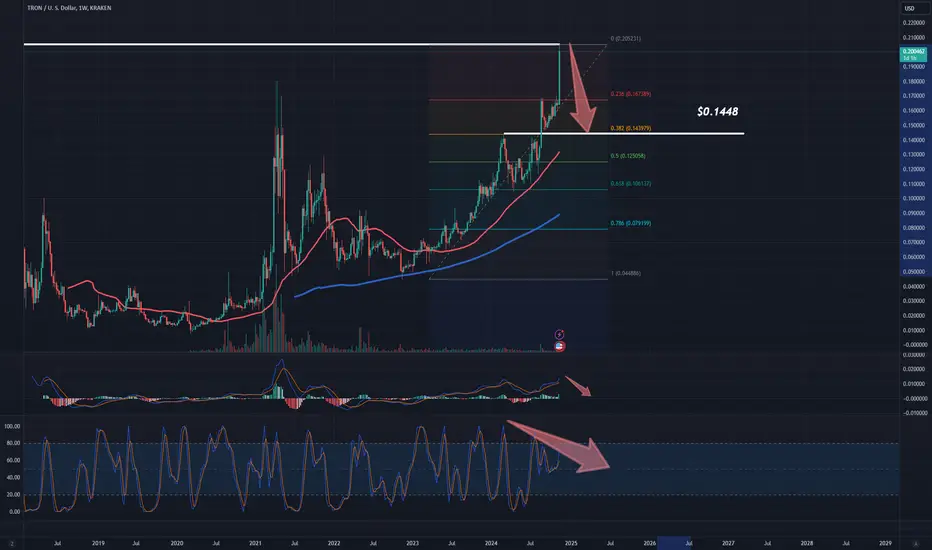
Tron Update 2024-12-8The most optimistic probable next target for Tron are shown as mentioned
Note : This is a personal idea and is NOT enough for trading.

Tron (TRX) Climbs to New Highs - What's Behind the Recent Rally?Exploring the Surge: Tron (TRX) Climbs to New Highs - What's Behind the Recent Rally?
Tron (TRX) Soars to New Heights: A Deep Dive into the Recent Rally
Tron (TRX), a decentralized platform that aims to build a worldwide free content entertainment system with the blockchain and distributed storage technology, has recently experienced a significant surge in price. This rally has caught the attention of seasoned investors and cryptocurrency market newcomers.
The 100% Rally and Beyond
In a remarkable display of bullish momentum, Tron's price surged over 100% within a 24-hour period, propelling it to a new all-time high (ATH). This extraordinary growth ignited a wave of excitement and optimism among crypto enthusiasts. The question on everyone's lips: Could Tron be poised to reach the $0.5 mark?
Technical Analysis: A Bullish Outlook
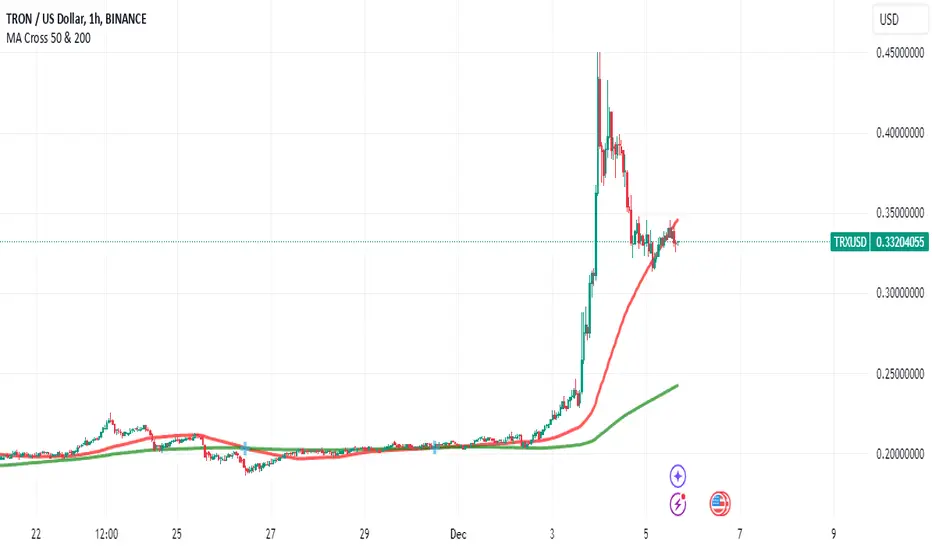
To gain a deeper understanding of Tron's recent price action, let's delve into a technical analysis of its one-hour chart.
• Reclaiming the 20 MA: One of the key indicators of renewed buyer interest is the ability of a cryptocurrency to reclaim its 20-day Moving Average (MA). When Tron successfully recaptured this crucial support level, it signaled a potential shift in market sentiment from bearish to bullish.
• Bullish Momentum: The upward trajectory of Tron's price, coupled with increasing trading volume, suggests strong underlying bullish momentum. This momentum can often drive prices higher, especially when supported by positive market sentiment and fundamental factors.
• Potential Resistance Levels: While Tron's recent rally has been impressive, it may encounter resistance at certain price levels. Identifying these potential resistance zones can help investors gauge the extent of the upcoming price movement.
Fundamental Factors Driving Tron's Rally
In addition to technical indicators, several fundamental factors have contributed to Tron's recent surge:
• Growing Ecosystem: Tron's ecosystem has been expanding rapidly, attracting a diverse range of projects and applications. This increased adoption and utility have positively impacted the demand for TRX tokens.
• Strategic Partnerships: Tron has forged strategic partnerships with various organizations, including BitTorrent, a popular file-sharing platform. These collaborations have strengthened Tron's position in the blockchain industry and boosted its visibility.
• Positive Market Sentiment: The overall bullish sentiment in the cryptocurrency market has also played a role in Tron's price appreciation. As investors become more optimistic about the future of digital assets, they are allocating more capital to promising projects like Tron.
The Road Ahead for Tron
While Tron's recent performance has been undeniably impressive, it's important to approach any investment with caution and conduct thorough research. The cryptocurrency market is highly volatile, and prices can fluctuate rapidly.
As investors look ahead, they should monitor key factors such as:
• Market Sentiment: The overall sentiment in the cryptocurrency market can significantly impact Tron's price.
• Regulatory Developments: Changes in regulations can have a profound effect on the cryptocurrency industry, including Tron.
• Technological Advancements: Continued innovation and advancements in blockchain technology can drive Tron's growth and adoption.
In conclusion, Tron's recent 100% rally and reclamation of the 20 MA on the one-hour chart have ignited a wave of optimism among investors. However, it's crucial to approach this bullish momentum with a balanced perspective and consider the potential rewards and risks of investing in cryptocurrencies. Investors can make informed decisions about their Tron investments by staying informed and conducting thorough research.
Tron TRX price get ready to...Do you want a stable growth of your crypto deposit?
Then pay attention to CRYPTOCAP:TRX
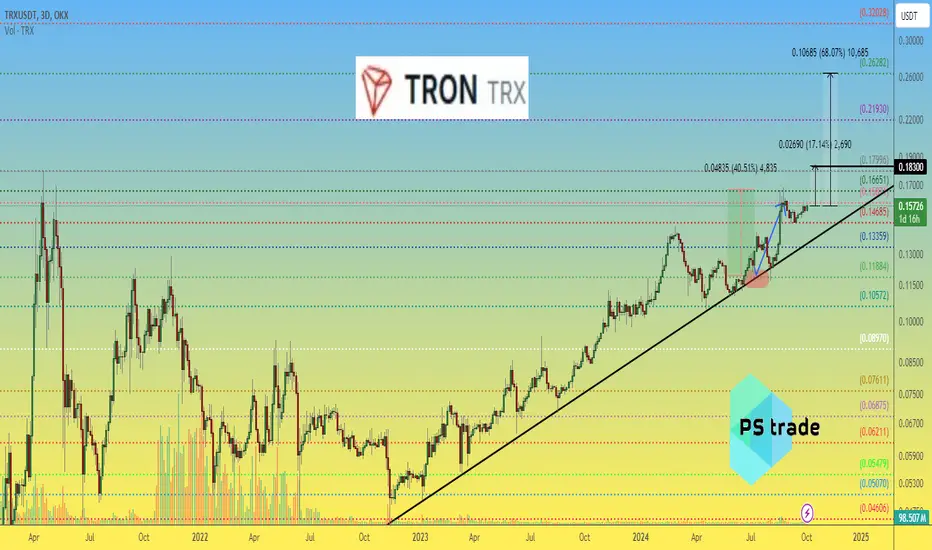
Despite the ambiguous reputation of Justin Sun, he has been on the crypto market for a very long time and the OKX:TRXUSDT chart shows that he loves his creation and supports its reputational price.
Therefore, we will not be surprised if the price of #TRON is one of the first of the old coins to update ATH in the near future, at least to $0.183, and ideally by $0.26.
By the way, our previous idea OKX:TRXUSDT gave us +40% 👇
_____________________
Did you like our analysis? Leave a comment, like, and follow to get more
TRON too hot to handelTRON is up almost 400% since November of 2022. I see a retracement happening very soon, just my guess.
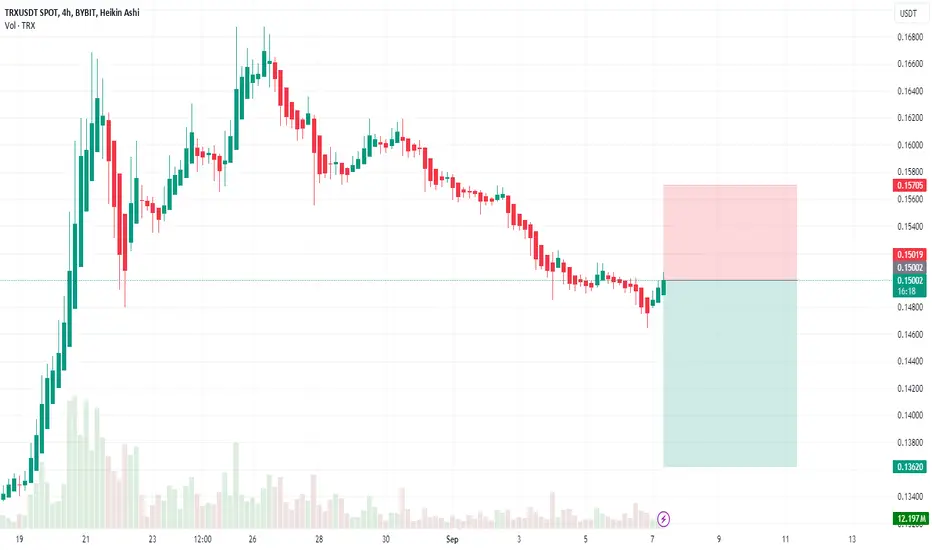
TRX (Crypto TRON-USD) SELL TF H4 TP = 0.1362On the H4 chart the trend started on Aug. 27 (linear regression channel).
There is a high probability of profit taking. Possible take profit level is 0.1362
Using a trailing stop is also a good idea!
Please leave your feedback, your opinion. I am very interested in it. Thank you!
Good luck!
Regards, WeBelievelnTrading
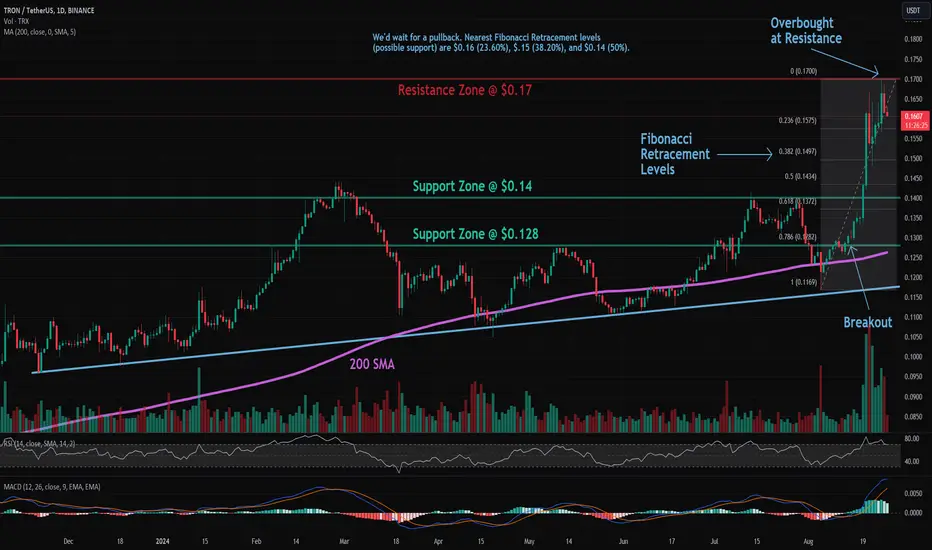
TRX (TRON): Overbought at ResistanceTrade setup: Price remains in an Uptrend. It bounced off of its long-term up trendline and 200-day MA, and resumed its uptrend. We removed it from our HOT list because it's overbought (RSI > 70) near $0.17 resistance, hence we're likely to see some profit taking near-term. We'd wait for a pullback. Nearest Fibonacci Retracement levels (possible support) are $0.16 (23.60%), $.15 (38.20%), and $0.14 (50%). Learn risk management in Lesson 9.
Pattern: Price is Overbought at Resistance. This trading strategy finds assets that are overbought (RSI > 70) and are near a resistance area, which means there's a high probability that price will get rejected and pull back near-term. Overbought conditions are typically reached when RSI hits 70 or more. Learn this trading strategy in Lesson 5.
Trend: Short-term trend is Strong Up, Medium-term trend is Strong Up and Long-term trend is Strong Up.
Momentum is Bullish but inflecting. MACD Line is still above MACD Signal Line but momentum may have peaked since MACD Histogram bars are declining, which suggests that momentum could be nearing a downswing. Price is neither overbought nor oversold currently, based on RSI-14 levels (RSI > 30 and RSI < 70).
Support and Resistance: Nearest Support Zone is $0.14, then $0.128. Nearest Resistance Zone is $0.17, then $0.20.

TRX (TRON): Overbought at ResistanceTrade setup : Price remains in an Uptrend. It bounced off of its long-term up trendline and 200-day MA, and resumed its uptrend. We removed it from our HOT list because it's overbought (RSI > 70) near $0.17 resistance, hence we're likely to see some profit taking near-term. We'd wait for a pullback. Nearest Fibonacci Retracement levels (possible support) are $0.16 (23.60%), $.15 (38.20%), and $0.14 (50%). Learn risk management in Lesson 9.
Pattern : Price is Overbought at Resistance . This trading strategy finds assets that are overbought (RSI > 70) and are near a resistance area, which means there's a high probability that price will get rejected and pull back near-term. Overbought conditions are typically reached when RSI hits 70 or more. Learn this trading strategy in Lesson 5.
Trend : Short-term trend is Strong Up, Medium-term trend is Strong Up and Long-term trend is Strong Up.
Momentum is Bullish but inflecting. MACD Line is still above MACD Signal Line but momentum may have peaked since MACD Histogram bars are declining, which suggests that momentum could be nearing a downswing. Price is neither overbought nor oversold currently, based on RSI-14 levels (RSI > 30 and RSI < 70).
Support and Resistance : Nearest Support Zone is $0.14, then $0.128. Nearest Resistance Zone is $0.17, then $0.20.
TRON breaks out of the cup & handle pattern, just as predicted!TRON is on the move, and has made some massive gains today. There could be some massive gains in this crypto over the next few months. This is a great sign!
Tron TRX price goes against the marketWhile the entire crypto market is falling, the TRX price is rising!)
Maybe this is the reaction of the #TRXUSDT price to the "rumors" that Justin Sun is working on a full-scale launch of #TRON-based memecoins?)
We will find out soon...
Nevertheless, as long as the #TRXUSD price is kept above $0.115-0.12, it will remain in a "long phase".
_____________________
Did you like our analysis? Leave a comment, like, and follow to get more
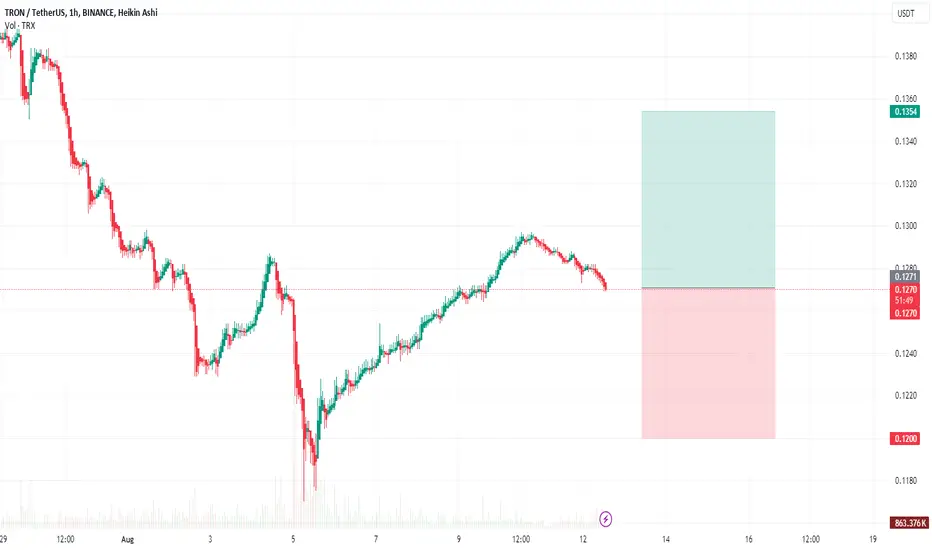
TRX (Crypto TRON-USD) BUY TF H1 TP = 0.1354On the H1 chart the trend started on Aug. 05 (linear regression channel).
There is a high probability of profit taking. Possible take profit level is 0.1354
Using a trailing stop is also a good idea!
Please leave your feedback, your opinion. I am very interested in it. Thank you!
Good luck!
Regards, WeBelievelnTrading
TRX (TRON): Overbought at ResistanceTrade setup : Price is in an Uptrend. It made Higher Lows (see blue trendline) and broke back above 200-day MA ($0.12) to signal trend reversal to uptrend. It's now approaching $0.145 resistance and getting overbought (RSI > 75), hence, we could see some profit taking in this area. Now we look for the right entry opportunity in Uptrend. We wait for price to either 1) break above $0.145 to signal continuation of uptrend, or 2) pull back near $0.12 support for another swing trade entry in Uptrend with +20% upside potential back to $0.145.
Pattern : Price is Overbought at Resistance. This trading strategy finds assets that are overbought (RSI > 70) and are near a resistance area, which means there's a high probability that price will get rejected and pull back near-term. Overbought conditions are typically reached when RSI hits 70 or more. Learn this trading strategy in Lesson 5.
Trend : Short-term trend is Strong Up, Medium-term trend is Strong Up and Long-term trend is Strong Up.
Momentum is Bullish (MACD Line crossed above MACD Signal Line) ABOVE days ago. Price is Overbought currently, based on RSI-14 levels (RSI > 70).
Support and Resistance : Nearest Support Zone is $0.11, then $0.10. Nearest Resistance Zone is $0.145.

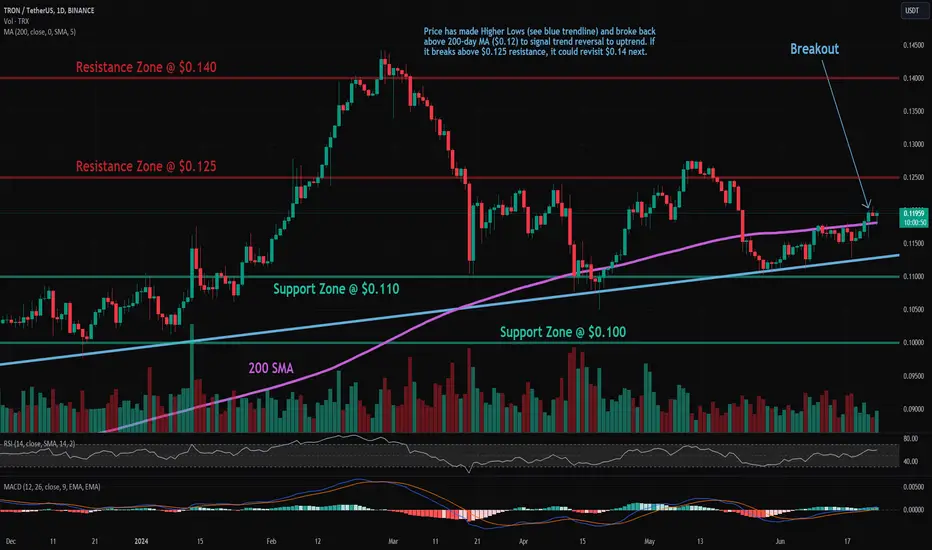
TRX: Resistance BreakoutTrade setup : Trends are mixed but improving. Price has made Higher Lows (see blue trendline) and broke back above 200-day MA ($0.12) to signal trend reversal to uptrend. If it breaks above $0.125 resistance, it could revisit $0.14 next.
Pattern : Resistance Breakout . Once a price breaks above a resistance zone, it signals that buyers have absorbed all the supply from sellers at this level and price can resume it's advance. Following a resistance breakout, the next closest resistance zone becomes a price target. Learn to trade key level breakouts in Lesson 7.
Trend : Short-term trend is Strong Up, Medium-term trend is Down and Long-term trend is Down.
Momentum : Price is neither overbought nor oversold currently, based on RSI-14 levels (RSI > 30 and RSI < 70).
Support and Resistance : Nearest Support Zone is $0.11, then $0.10. Nearest Resistance Zone is $0.125, then $0.14.
TRX ( TRON ) tm:1hHello traders.
I hope you doing well.
These areas are based on my personal strategy and I will share it with you.
Open a sell position on the supply area or open a buy position on the demand area.
Your entry point, stop loss, and target point are based on money management and the amount of money in your trading account.
But I promise you that by trading in the areas of my trading strategy, you will definitely make a profit, because these areas, although they seem simple, are my experience of 8 years of learning and trading.
I hope you will achieve maximum continuous profit with me by using supply and demand areas.
Good luck traders.
Mohammad Goodarzi

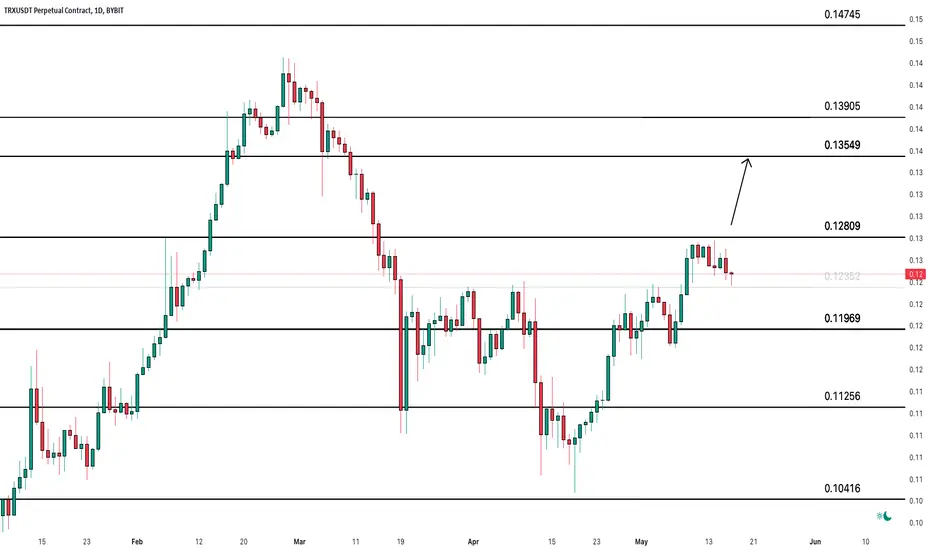
TRX: On the Verge of Breakout - Will Resistance Hold?TRX is going for a re-test at $0.12352, which could allow gathering strength to breach the $0.12809 resistance.
A successful breakout of $0.12809 could catapult TRX towards the $0.13549 mark.
A decline beneath $0.11969, the key daily support, will amplify bearish pressures to $0.10416.
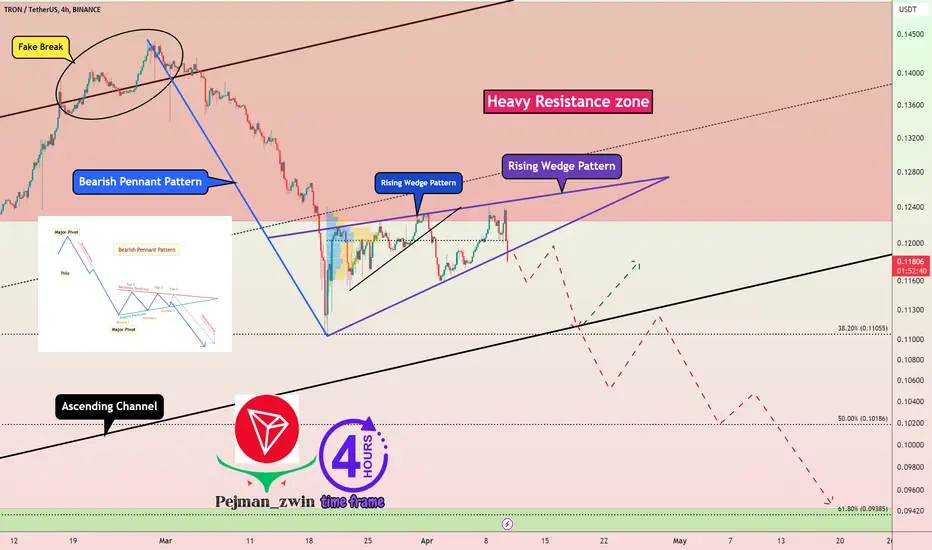
🚩TRX can Go Down By Bearish Pennant Pattern🚩🏃♂️ TRX is moving in the 🔴 Heavy Resistance zone($0.150-$0.122) 🔴 and Ascending Channel .
📈Also, TRX has managed to form two Classic Patterns ; the first pattern is the Rising Wedge Pattern , and the second pattern is the Bearish Pennant Pattern .
🔔Currently, TRX has managed to break the bottom line of the Rising Wedge Pattern, and I expect TRX to continue its decline , at least to the lower line of the ascending channel .
❗️⚠️Note⚠️❗️: An important point you should always remember is capital management and lack of greed.
TRON Analyze ( TRXUSDT), 4-hour time frame ⏰.
Do not forget to put Stop loss for your positions (For every position you want to open).
Please follow your strategy; this is just my Idea, and I will gladly see your ideas in this post.
Please do not forget the ✅' like '✅ button 🙏😊 & Share it with your friends; thanks, and Trade safe.
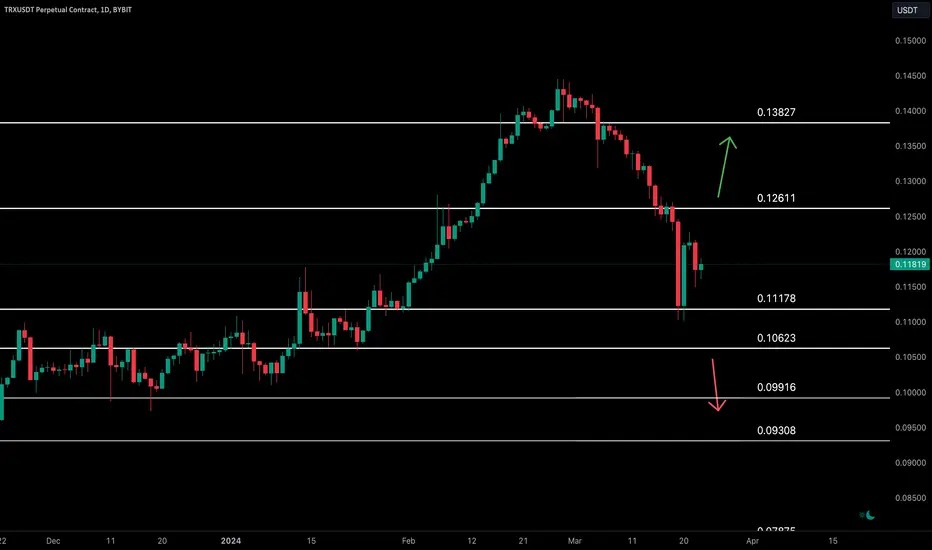
Cryptolean Tron TRX UpdateTron is trading in the wide daily range zone between $0.112 and $0.126.
A bullish move from the current price location reclaiming$0.126 will result in a slow upward move to $0.138.
As long as TRX in the daily chart is trading below $0.126, the bears are in control and will try to push price to the key daily support zone of $0.106-$0.112.
A bearsih break-out of this support zone will make TRX very bearish.