Direct Buy In Gold : Coming Currently gold is trading under falling wedge pattern which will explode soon once volume will come . Buying here is good idea imao
Trump
XAUUSD Market Update – July 30 Late NY Recap🔸Macro Context
Markets are still digesting Powell’s ongoing speech with no clear pivot signals. While FOMC tone remained cautious, no dovish surprise emerged. Trump’s upcoming comments keep geopolitical risks elevated. USD remains firm. Gold is reacting within key HTF demand as intraday volatility cools off.
🔸Bias Overview
Weekly Bias:
• Bearish rejection from the major supply wick 3439–3350
• Structure still below 3345, maintaining downside pressure
• Weekly RSI cooling off — no bullish divergence yet
Daily Bias:
• Lower high locked below 3345
• Price reentered the imbalance toward 3272
• Clean structure remains bearish unless we reclaim 3302
H4 Bias:
• Lower high formed at 3314
• Current price testing HTF Extreme Demand Base (3289–3272)
• Still bearish unless we see a confirmed M15 or H1 BOS from demand
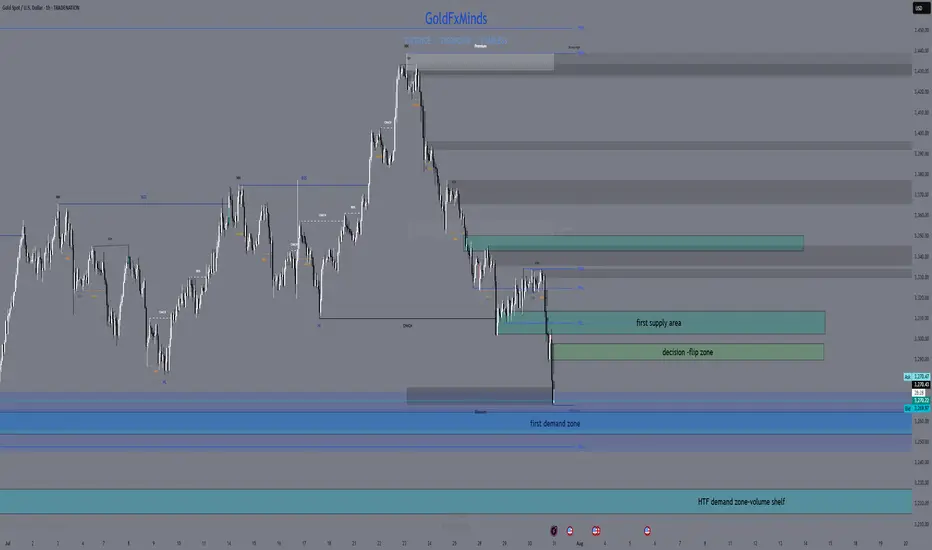
🔸Key Structural Zones
🔺Above Price (3272):
• 3289–3294
Decision Block – M30 OB + FVG. First sign of momentum shift if reclaimed.
• 3302–3314
Supply Reversal – H1 OB + previous BOS zone. EMA alignment adds pressure.
• 3345–3350
Major Rejection Zone – H4 origin of last leg down. Strong resistance area.
🔻Below Price (3272):
• 3254–3264
Imbalance + OB – H4 FVG + clean demand zone. Buy setup only on deep flush + reversal PA.
• 3227–3214
HTF Demand Base – Daily OB + historical volume shelf. Final structural floor before deeper downside opens.
🔸Battle Plan
▶ Scenario 1 – Bearish Breakout
If 3272 fails with momentum and no reversal signs, expect continuation into 3254–3264.
No long trades unless BOS confirms.
▶ Scenario 2 – Reactive Long from Demand
If price gives a strong reaction from 3272 with BOS on M15 or H1 and clears 3294, then a recovery into 3302 is possible. Only valid with confirmed PA + EMA shift.
▶ Scenario 3 – Choppy Rejection from 3294
If price tests 3294 but fails, watch for rejections back toward 3272. Scalpers can fade reactions if no bullish structure forms.
🔸Final Thoughts
Price is once again testing our Extreme Demand Base from July 28 (3289–3272). The zone remains valid — but execution depends entirely on confirmation. Bears still in control unless we reclaim 3302 cleanly.
No need to rush. Best RR setups are found at clean structural edges.
Patience = profits.
—💬 Drop your thoughts in the comments.
❤️ Like if you appreciate the precision.
🔔 Follow GoldFxMinds for more sniper-level updates.
With you all the way,
— GoldFxMinds
📊 Analysis based on Trade Nation TradingView charts.
Ursulization = Bureaucracy > Democracy (a.k.a. The Glasgow Kiss)🤝💥 Ursulization – Bureaucracy Replaces Democracy (a.k.a. The Glasgow Kiss) 🇺🇸🇪🇺
📍Background:
The media spun it as a "15% tariff agreement"…
But in reality, this wasn’t diplomacy — it was a disguised capitulation.
And the stage? None other than Scotland, ancestral ground of Donald J. Trump.
So when Ursula von der Leyen came seeking a gentle diplomatic handshake…
What she received instead was the infamous Glasgow Kiss — sudden, sharp, and unmissable.
💥 What’s a Glasgow Kiss?
A British slang term for a violent headbutt to the face —
No grace. No warning. Just raw force.
💬 The Real Story:
Ursula von der Leyen — unelected, unaccountable —
signed off on $1.4 trillion in U.S.-bound capital flows:
💸 $750B to buy American energy
🛠 $600B in U.S. infrastructure, defense & industry
All to sidestep 50% tariffs the Trump team had ready to roll.
But here's the kicker:
She wasn’t acting on behalf of European citizens.
She was speaking for the bureaucracy, not the people.
🔥 Welcome to Ursulization:
Where democracy is sidelined by unelected power.
Where negotiations happen in silence.
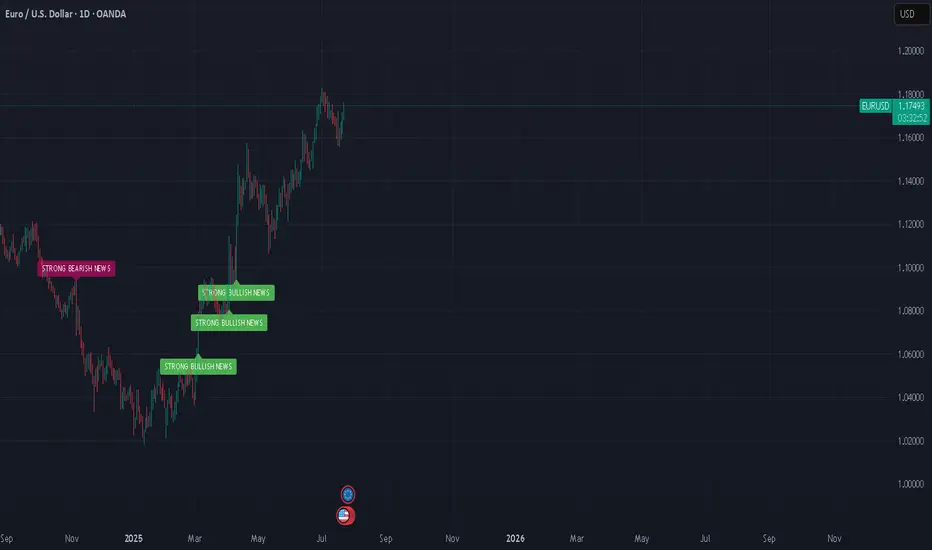
Where scandals like PfizerGate get buried while the euro breaks down.
📉 EUR/USD just lost key support at 1.14776 —
The chart shows t he cost of surrender.
💉 PfizerGate Reminder:
Ursula already faced heat for secretive vaccine contracts with Pfizer.
Now, she’s handing over Europe’s industrial backbone —
To Trump. In Scotland. With no public mandate.
📌 Conclusion:
Trump didn’t compromise — he collided.
Europe didn’t resist — it surrendered.
This wasn’t diplomacy.
It was a Glasgow Kiss — a collision between legitimacy and bureaucratic power.
👑 One elected by the people (Trump). One not elected at all (Woke agenda style Ursula).
💰 One walks away with trillions (Trump). The other, with silence (Ursula 'Von der Pfizinen never electenen'').
One Love,
The FXPROFESSOR 💙
ps. Till we can bring Democracy and Europe back.
Disclosure: I am happy to be part of the Trade Nation's Influencer program and receive a monthly fee for using their TradingView charts in my analysis. Awesome broker, where the trader really comes first! 🌟🤝📈


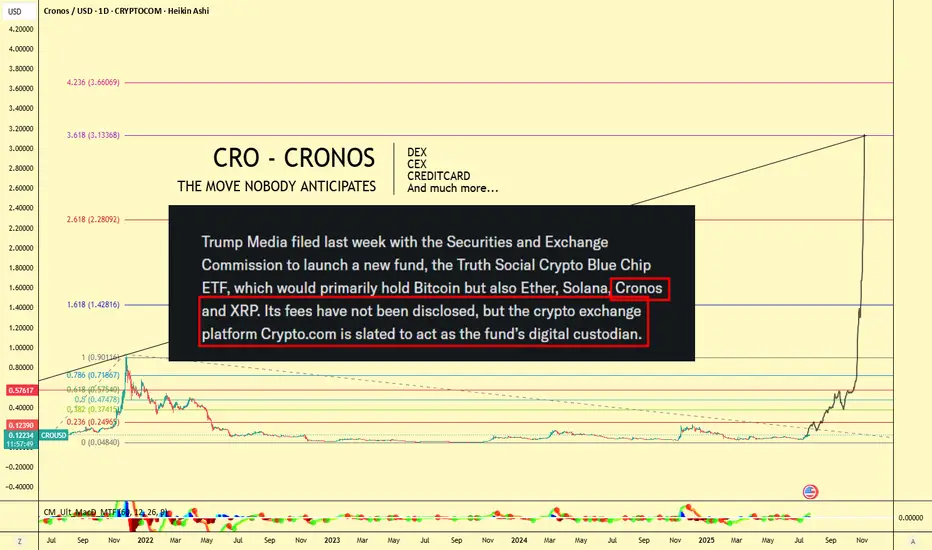
CRO (Crypto.com) $3 Target! Don't Miss This Move🪙 Ticker: OKX:CROUSDT
🕰 Chart: 1D (Heikin Ashi)
🔧 Tools Used: Fibonacci Extension, Fundamental News (ETF Filing)
🔍 Chart Analysis: Fibonacci Extension Targeting $3+
The Fibonacci Extension tool has been applied to the major CRO impulse wave from its peak near $0.90 (late 2021) to the 2022–2023 bottom at $0.0484, confirming a multi-year retracement and consolidation period.
Let’s break down the major Fib levels:
Extension Level Price Target
0.236 $0.2495
0.382 $0.3741
0.618 $0.5745
1.0 $0.9011
1.618 $1.4281
2.618 $2.2809
3.618 $3.1336
📌 Current Price: ~$0.12
🔥 Upside Potential to $3.13+ — a 25x move from current levels if full extension plays out!
📣 Fundamental Catalyst: CRO in Trump Media ETF
According to the chart note (sourced from SEC-related headlines):
"Trump Media filed with the SEC to launch a new ETF, the Truth Social Crypto Blue Chip ETF, which would primarily hold Bitcoin, but also Ether, Solana, Cronos (CRO), and XRP."
Even more important:
"Crypto.com is slated to act as the fund’s digital custodian."
This is massive fundamental validation for CRO — not just as a token, but as an ecosystem and financial infrastructure provider.
🌐 Why Crypto.com Matters: Utility, Ecosystem, Adoption
Crypto.com isn't just an exchange — it's a comprehensive Web3 ecosystem, which includes:
🔁 CEX (Centralized Exchange):
Buy, sell, stake, and trade hundreds of cryptocurrencies with high liquidity and low fees.
🔄 DEX (Decentralized Exchange):
Cronos Chain supports decentralized trading and DeFi apps — with low gas fees and EVM compatibility.
💳 Visa Credit Card Integration:
Crypto.com offers one of the most popular crypto Visa debit cards — earn cashback in CRO and enjoy perks like Spotify/Netflix rebates.
📱 Mobile Super App:
Buy/sell/stake/farm on-the-go with a seamless user interface.
📈 Earn & Lending Services:
Stake CRO or other assets for up to double-digit yields.
🤝 Strategic Partnerships
Crypto.com has been aggressively investing in brand and adoption:
🏟 Official partner of UFC, FIFA World Cup, and Formula 1
🏀 NBA’s Los Angeles Lakers Arena naming rights (Crypto.com Arena)
💼 Member of Singapore's regulated exchanges
🔐 ISO/IEC 27701:2019, PCI:DSS 3.2.1, and SOC 2 compliance — one of the most secure platforms in the industry
🧠 Conclusion: The Perfect Blend of TA + FA
With CRO being included in a potential U.S.-regulated ETF, the Crypto.com ecosystem booming, and technical patterns pointing to a Fib-based target above $3, CRO might be the sleeper play of the next bull run.
"The move nobody anticipates" might just be the most explosive one.
🎯 Short-Term Targets:
$0.25
$0.37
$0.57
🎯 Mid-Term Bull Targets:
$0.90 (prior ATH)
$1.42
$2.28
🎯 Full Cycle Extension:
$3.13
📢 Let me know in the comments:
Are you holding GETTEX:CRO ? What do you think about its inclusion in the ETF?
#CRO #CryptoCom #ETF #TrumpMedia #Altcoins #Bullrun #CryptoTrading #DeFi #FibTargets #CronosChain
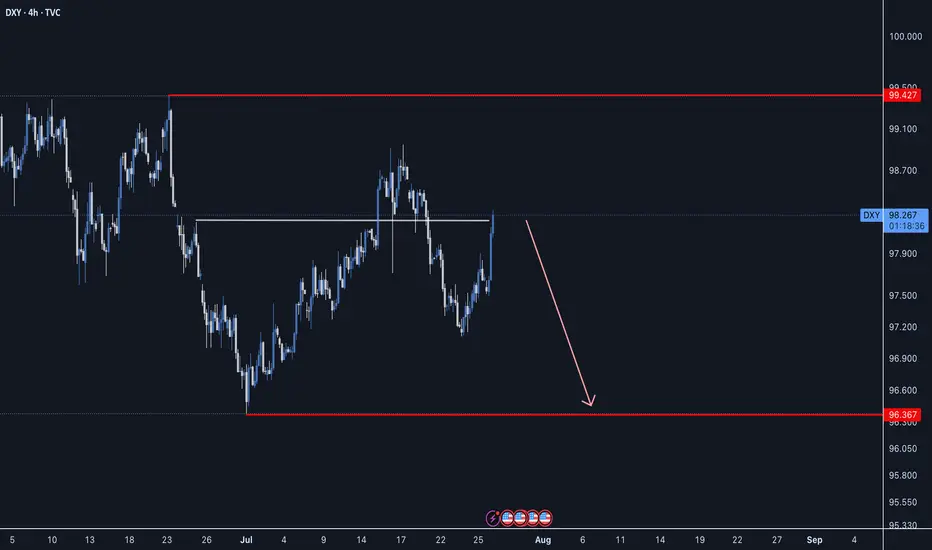
DXY - ABC Move still in playDXY has been moving not so much on technical factors lately but more so with what Mr. Trump says, we still could see a move lower with an ABC pattern.
Good Luck
Bitcoin - Will Bitcoin continue its upward trend?!Bitcoin is above the EMA50 and EMA200 on the four-hour timeframe and is in its medium-term ascending channel. Bitcoin’s current upward momentum has the potential to reach its previous ATH. If it corrects, you can look for Bitcoin buying opportunities from the identified support area, which is also at the intersection of the bottom of the ascending channel.
If this support is lost, the decline will continue to around $113,000, where you can again buy Bitcoin with a better risk-reward ratio.
It should be noted that there is a possibility of heavy fluctuations and shadows due to the movement of whales in the market, and capital management will be more important in the cryptocurrency market. If the downward trend continues, we can buy within the demand range.
Last week, a group of U.S. senators released an initial draft of a new legislative proposal aimed at creating a clearer regulatory framework for the digital asset industry in the United States. The proposal builds on the recently passed CLARITY Act in the House of Representatives and focuses on strengthening market structure, enhancing consumer protection, and expanding regulatory oversight.
According to the senators, the bill addresses key areas such as banking, disclosure requirements, securities classification, and measures to combat illicit financial activity.Senator Lummis, in highlighting the proposal, stressed the urgent need for legal clarity to support the growth of this emerging industry within the U.S. The legislation aims to facilitate the integration of digital assets into banking services and would allow financial holding companies to provide services based on such assets.
The draft also includes measures aimed at preventing illegal financial activities, such as improving regulatory standards and boosting inter-agency cooperation to identify and block misuse of digital assets.
In addition, the senators have issued a “Request for Information” (RFI) to support the legislative process and have invited the public to share their opinions on more than 35 related topics, encouraging broader engagement in shaping the bill.
Meanwhile, in Asia, Japan-based firm Metaplanet announced that it has added 780 BTC worth $93 million to its digital holdings. This acquisition brings the company’s total Bitcoin reserves to 17,132 BTC, valued at roughly $2 billion. Metaplanet is fast becoming one of the largest institutional Bitcoin treasuries in the region—potentially serving as a model for other firms across Asia.
At the same time, publicly traded U.S. companies have significantly ramped up their Bitcoin holdings. By the end of Q2 2025, these companies had accumulated nearly 900,000 BTC, marking a 35% increase over the previous quarter. This surge, driven primarily by firms such as MicroStrategy, has sent demand for Bitcoin soaring.
Some analysts believe that the $1.5 trillion in free cash flow held by companies within the S&P 500 index could spark a new wave of institutional Bitcoin buying.
Looking ahead, the upcoming week is packed with critical U.S. economic data. Alongside the Non-Farm Payroll (NFP) employment report and inflation metrics via the Personal Consumption Expenditures (PCE) index, the initial estimate for Gross Domestic Product (GDP) and various other indicators will be released—potentially offering a clearer picture of where the U.S. economy is heading.
The Federal Reserve remains primarily focused on inflation and labor market dynamics. June CPI data indicated signs of inflationary pressure caused by tariffs. If Thursday’s PCE report—particularly its core reading—confirms a similar trend, the Fed may decide against a rate cut in September. As a result, financial markets have priced in only about a 65% chance of a rate cut at that meeting.
SPX: Tariffs deal (un)certainty Investors' optimism continued to hold at the U.S. equity markets another week in a row. The S&P 500 posted another weekly winning streak, supported by solid earnings of companies included in the index. The index also reached another all time highest level, with Friday's level of 6.388, gaining around 1,5% for the week.
Tech companies were once again main contributors to the surge of the index. Alphabet posted better than expected quarterly results, supporting the surge in share price of 4%. Tesla shares gained 3,5% for the week. The company reported strong vehicle delivery numbers and progress in AI-driven autonomous driving technology. Analysts are noting that 82% of all companies included in the S&P 500 index, that have already reported quarterly results, have beaten the market expectations.
Alongside strong earnings reports, recent advancements in U.S. trade negotiations have contributed to market gains. Earlier this week, President Donald Trump announced a significant trade agreement with Japan, which includes a 15% reciprocal tariff arrangement—an important step toward redefining trade terms between the two nations. Additionally, the U.S. and Indonesia have reportedly reached a framework agreement for a trade deal, reflecting a broader U.S. effort to strengthen and stabilize trade partnerships in Asia. On Friday, President Trump expressed confidence that more trade agreements will be finalized ahead of the August 1 deadline for new tariffs. One of these possible deals involves the European Union. Investors have welcomed these developments, as they help reduce tariff-related uncertainties and ease concerns about escalating trade disputes that could disrupt global supply chains and impact corporate earnings.
The week ahead brings a bunch of important macro data for the U.S. as well as the FOMC meeting, where Fed members will discuss a potential change in interest rates. Markets are currently not expecting that the Fed will make a move at this meeting. Certainly, with JOLTs, NFP, PCE data in combination with the FOMC meeting, the week ahead might bring back some higher volatility in the US equity markets, in case of any unexpected news.

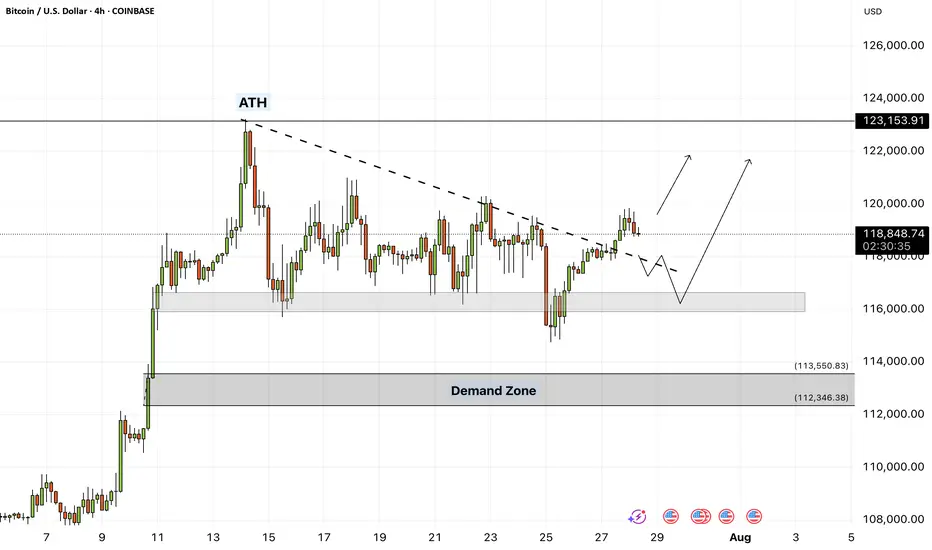
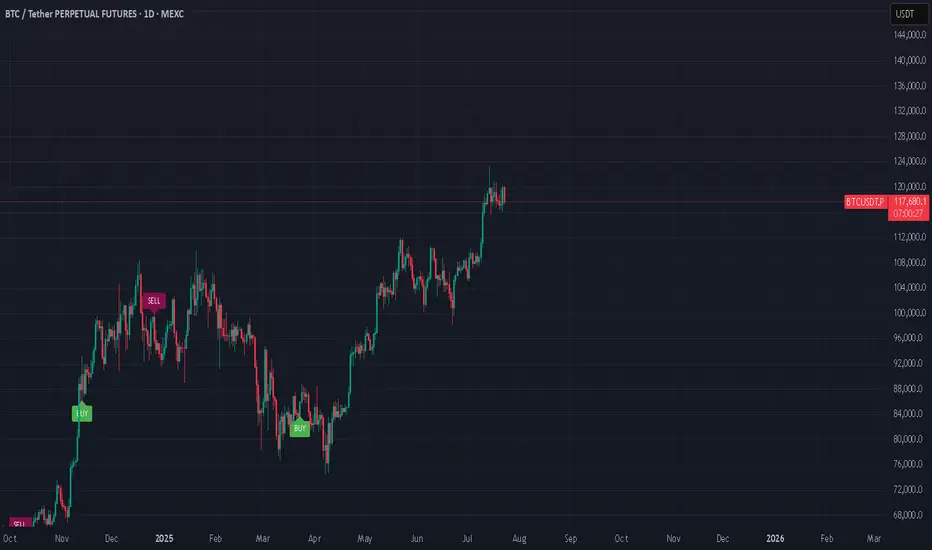
BTC - Trap, Tap, and Blast Off!BTC has been overall bullish, trading within the rising blue channel (1). After reaching a local high, it entered a short-term correction, forming a falling red channel (2).
👀All eyes are now on the key demand zone (3), which aligns with the lower bound of both the red channel and the rising blue structure.
🔎As long as this confluence holds, we anticipate a potential bullish impulse in August.
A retest of the $111,500–$112,000 zone could serve as the trigger for the next leg toward $128,000. Let’s see if BTC is gearing up for another breakout or if a deeper correction is in play.
🔔 Disclaimer: This analysis is for educational and informational purposes only. It does not constitute financial advice or a recommendation to buy or sell any asset. Always do your own research and manage your risk accordingly.
📚 Always follow your trading plan => including entry, risk management, and trade execution.
Good luck!
All strategies are good, if managed properly.
~ Richard Nasr

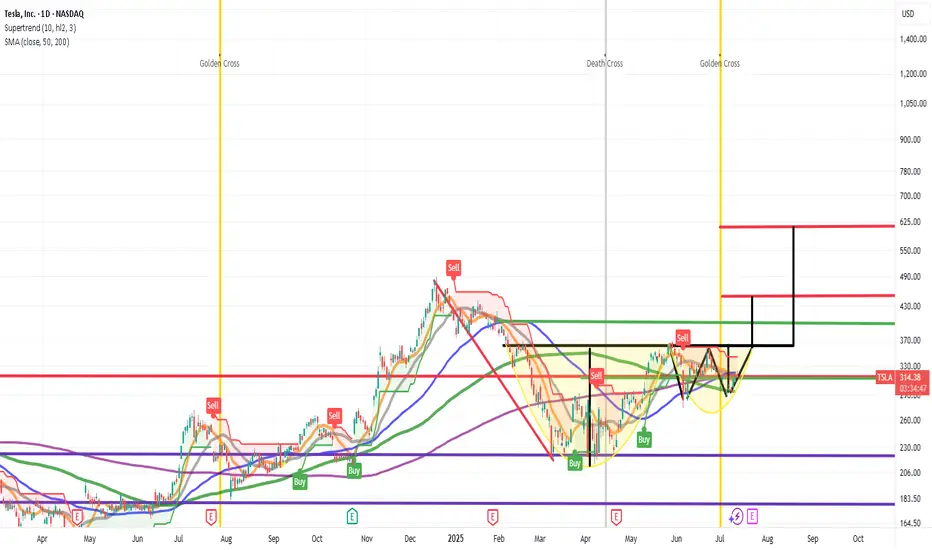
CUP AND HANDLE $TSLA TO $515 MINIMUMThe cup and handle is a bullish chart pattern commonly used by traders to spot potential buying opportunities. It features a rounded "cup" formation followed by a slight downward drift forming the "handle." This pattern typically signals a continuation of an upward trend once the handle completes its consolidation phase.
ROBOTAXI BOOM
BUY NOW NASDAQ:TSLL NASDAQ:TSLA
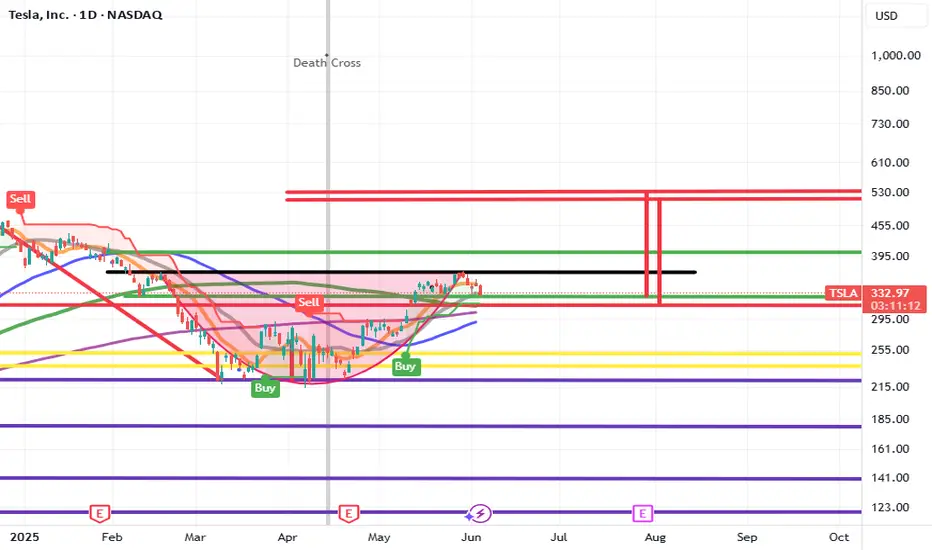
Cup & HANDLE + Mini Double Bottom: $TSLA to $610 ScenarioI maintain a bullish stance on Tesla ( NASDAQ:TSLA ), supported by a compelling combination of technical patterns and strong fundamental drivers. The current chart setup reveals a Cup and Handle formation complemented by a Mini Double Bottom, both of which are classic bullish continuation patterns. These suggest a potential breakout scenario that could drive NASDAQ:TSLA to $610 by year-end.
Technical Roadmap:
Gap Fill to $408: Anticipated earnings momentum, particularly from the Robotaxi segment, is likely to propel the stock to fill the previous gap at $408.
Consolidation at $450: Following the gap fill, I expect a consolidation phase forming a “box” around the $450 level.
Breakout to $610: A decisive breakout above $450 could trigger a strong rally toward the $610 target.
***Current Key Catalysts Supporting the Bullish Thesis:
Robotaxi Expansion: Tesla’s autonomous driving initiative is gaining traction, with Robotaxi developments expected to significantly boost revenue and margins.
India Market Entry: Tesla’s upcoming launch in India opens access to one of the world’s largest and fastest-growing EV markets.
In-House Chip Development & Dojo 2 Expansion: Continued investment in AI infrastructure and custom silicon enhances Tesla’s competitive edge in autonomy and robotics.
Tesla Diner Launch: The near-completion of Tesla’s themed diner adds to brand visibility and customer engagement.
Global EV Adoption: Tesla continues to benefit from rising EV demand across multiple international markets.
Optimus Robot Hype: Growing interest in Tesla’s humanoid robot project could unlock new revenue streams and investor enthusiasm.
Favorable Macro Trends: A declining interest rate environment supports higher valuations for growth stocks like Tesla.
Institutional Accumulation: Recent trading activity suggests that institutional investors are accumulating shares within the current range.
Grok AI Integration: The integration of Grok AI into Tesla vehicles could enhance user experience and differentiate Tesla’s infotainment ecosystem.
Investment Strategy:
I recommend initiating or increasing exposure to NASDAQ:TSLL (leveraged Tesla ETF) ahead of the upcoming earnings report. This could offer amplified returns if the bullish scenario plays out. Consider accumulating further on any dips, particularly during the consolidation phase around $450.
BUY NOW NASDAQ:TSLA NASDAQ:TSLL
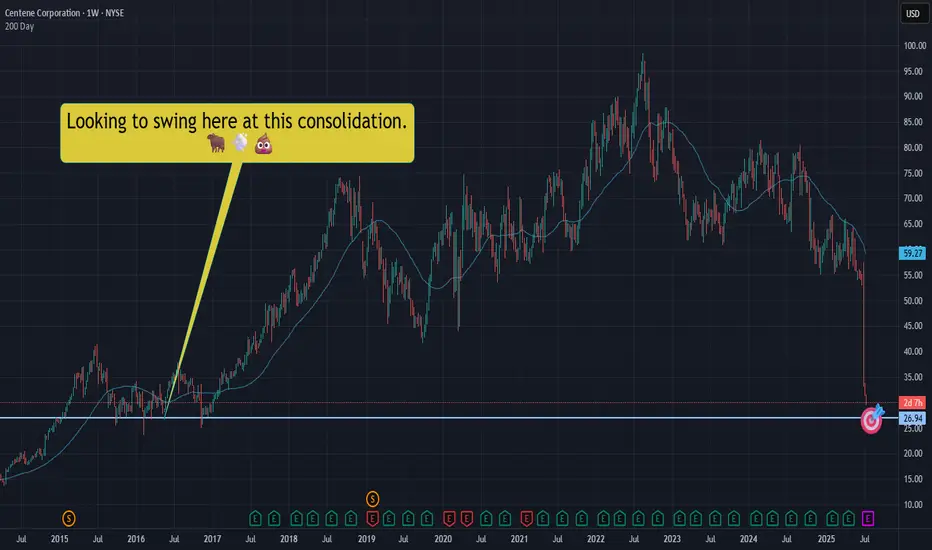
CNC|Let's take a swing at a falling dagger! NYSE:CNC slicing through the void, well.... like a falling dagger through a void.
Not trying to catch this bad boi, but we should expect a bounce at some point. Let's swing for a bounce in that $26.90ish area.
This is NOT a YOLO and I hope it's not an "oh no!" Let's keep our wits about us - starter position only. We can add if we need to, but let's just hope we sell and make some quick Christmas money.
THANK YOU FOR YOUR ATTENTION ON THIS MATTER
SHORT ON EUR/NZDEZ Has given a nice CHOC to the downside with plenty of sell side liquidity to be collected.
I will be selling EZ to the next level of demand looking to catch 300-500 pips

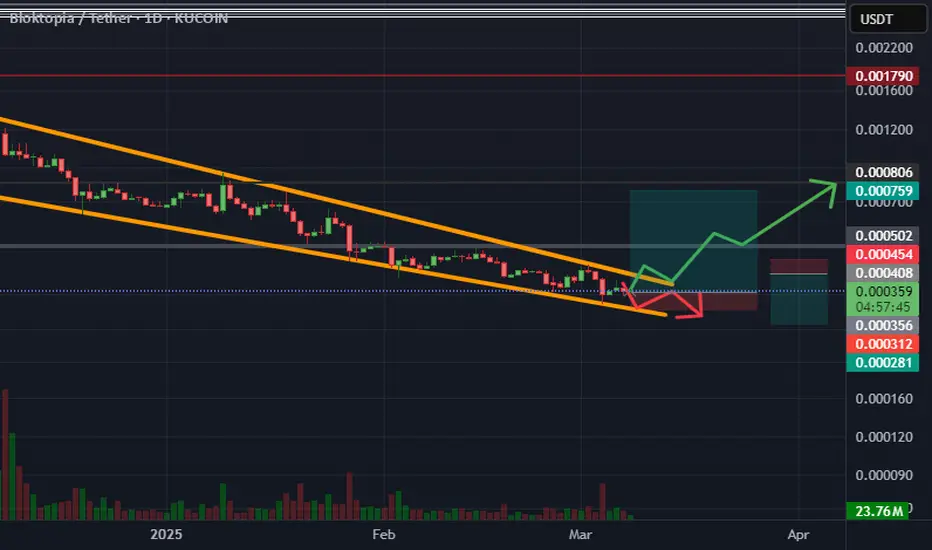
Blokblok usdt daily analyses
time frame daily
long position risk of ratio >9
target 0.00075$
if price breaks the upper line my long position will start. duration of this forecast is long
if it cannot break and move between orange lines my short position will be active. this duration is short
short position risk of ratio >2
target 0.00027$
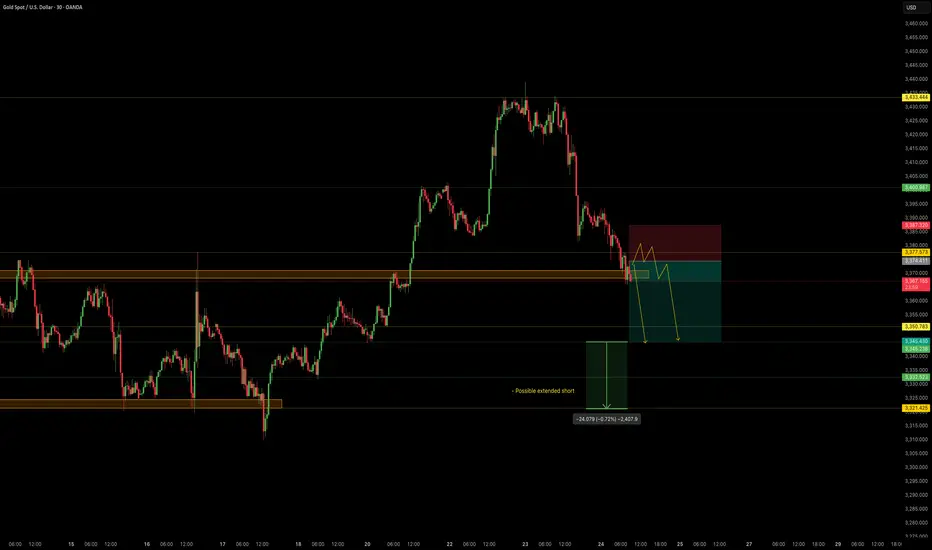
NordKern - XAUUSD InsightNordKern | Simplified Insight OANDA:XAUUSD – Short Opportunity Ahead
Gold is now near our important level at 3370, offering a shorting opportunity considering recent events and technical action.
Gold Price Decline – What's Behind It?
In the last two sessions (July 23–24), gold has retreated strongly owing to a set of global as well as market-specific circumstances:
1. Trade Deal Optimism
Advances in U.S.–Japan and U.S.–EU trade discussions lessened worldwide uncertainty, decreasing demand for gold as a safe-haven.
2. Higher U.S. Yields
Higher Treasury yields are rendering non-yielding assets such as gold less appealing, adding to downward pressure.
3. Technical & Profit-Taking
Following a recent rally, gold was exposed to selling. Stop-loss and profit-taking triggers hastened the fall.
Summary of Key Drivers
U.S. Trade Deals: Reduced geopolitical risk
Higher Treasury Yields: Decreased gold's relative attractiveness
Technical Selling: Enhanced the downward trend
Trade Setup – Bearish Bias
Entry : 3374.4
Stop Loss : 3387.3
Take Profit : 3345.4
Extended Target : 3322
Key Notes:
- Trade Deal Optimism: U.S.–Japan and U.S.–EU agreements eased global tensions, reducing demand for gold as a safe-haven asset.
- Yield Pressure: Rising U.S. Treasury yields made gold less attractive compared to interest-bearing alternatives.
- Technical Selling: Profit-taking and stop-loss triggers accelerated the decline after gold’s recent rally.
This setup remains tactically driven. Manage risk carefully and monitor for any renewed political shifts.
AUD/USD tests uptrend as Trump targets Powell at Fed siteThe US dollar is trading mixed after President Trump made a rare appearance at the Federal Reserve’s renovation site, in an attempt to distract from you know what.
While the visit had no formal policy announcements, Trump did try to further undermine Chair Jerome Powell by erroneously claiming the renovation cost had blown out to 3.1 billion by adding the cost of a building finished 5 years ago.
Meanwhile, AUD/USD could be of the most interest. Traders might like to watch to see if it can hold its uptrend after its downside breakout from yesterday. AUD/USD remains potentially supported above its 50-DMA, with momentum pointing to potential further upside beyond 0.6625.

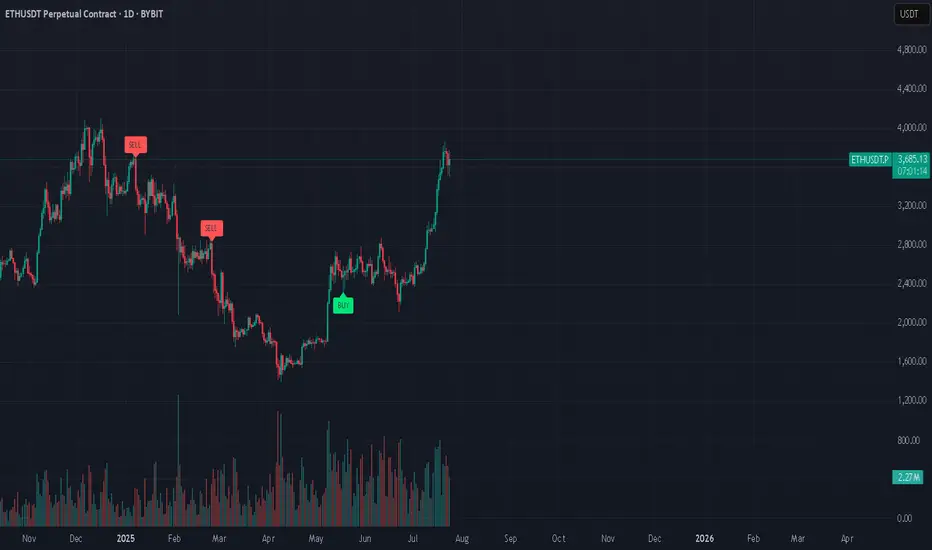
Huge Bear Trap next in line??Ethereum Exit Queue: 518,180 ETH
Half a million ETH is currently queued for unstaking on Ethereum...
Keep in mind, August 1st, Trump's Reciprocal Tariffs get in effect
Everyone's talking about BTC's new ATH, ETH's rally, XRP new ATH, but no one is talking about August 1st...
Manipulation is taking place. Stay safe, because a huge bear trap might be next in line (BTC back to 90K)
*NOT INVESTMENT ADVICE*
#crypto #ethereum #eth #btc #bitcoin #trading #xrp #trump #tariff #finance #economy
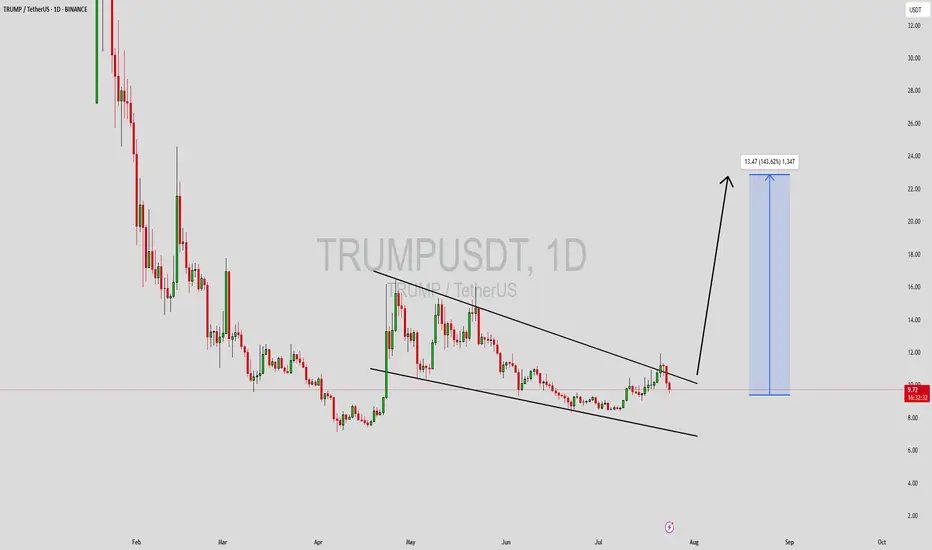
TRUMPUSDT Forming Falling WedgeTRUMPUSDT is currently forming a well-defined falling wedge pattern—a bullish reversal structure that often leads to significant upside breakouts. The price has been consolidating within narrowing trendlines and now appears to be approaching a breakout point. Historically, falling wedge patterns in the crypto market have led to aggressive rallies, especially when combined with rising volume and strong community sentiment. With good volume backing this setup, a breakout could trigger a sharp move to the upside, projecting an expected gain of 90% to 100%+ in the coming sessions.
Investor interest in the TRUMPUSDT project has been steadily increasing, likely fueled by the coin’s strong branding and community-driven momentum. Meme-based and politically themed tokens have seen explosive growth in recent bull cycles, and TRUMPUSDT may be positioning itself to capitalize on similar attention. With sentiment aligning positively and technicals flashing bullish signals, the coin is attracting both short-term swing traders and long-term speculative holders.
If TRUMPUSDT confirms a breakout above the upper wedge resistance with volume confirmation, we could see rapid price expansion. Traders should monitor key levels and consider re-entry on retests or strong bullish candles. The momentum shift is already becoming apparent, and this coin could turn into a trending asset in the meme-token segment very soon.
Keep this setup on your radar as it may provide high-reward opportunities. Monitor community updates, upcoming events, and broader meme coin momentum across the market for additional confirmation.
✅ Show your support by hitting the like button and
✅ Leaving a comment below! (What is You opinion about this Coin)
Your feedback and engagement keep me inspired to share more insightful market analysis with you!
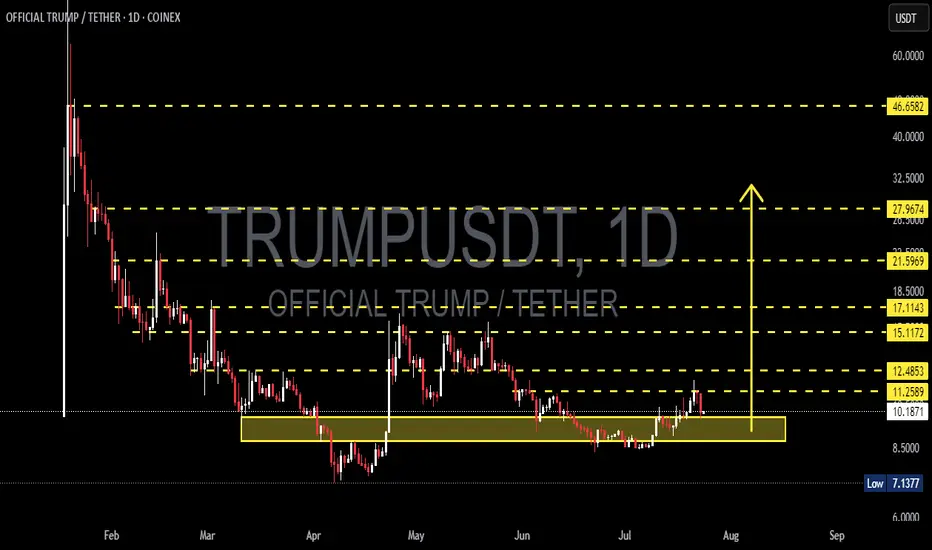
TRUMPUSDT: Massive Reversal Incoming? Reaccumulation Zone!
📉 Current Market Outlook:
TRUMPUSDT is currently positioned at a highly strategic technical level. After an extended downtrend since February—dropping from the 60 USDT region to a low of around 7.13 USDT—price has now stabilized and entered a strong reaccumulation zone between 8.50 and 10.20 USDT.
This zone has acted as a reliable support range and shows signs of smart money accumulation, as evidenced by volume spikes and strong price reactions off this base.
---
🧠 Technical Pattern & Structure:
🔸 Base Accumulation / Reaccumulation Rectangle
Price has been consolidating in a tight horizontal range, forming a classic reaccumulation pattern, often seen before major breakouts.
🔸 False Breakdown – Bull Trap Reversal Setup
The brief dip below 8.50 USDT (to 7.13) followed by a strong recovery suggests a potential “shakeout” phase to remove weak hands before a rally.
🔸 First Higher Low Formation
Recent price action has formed a higher low, a key structural signal of a potential trend reversal from bearish to bullish.
---
🟢 Bullish Scenario (Primary):
If price continues to hold above the reaccumulation zone and breaks above 12.48 USDT with strong volume:
Short-Term Targets:
🔹 15.11 USDT
🔹 17.11 USDT
Mid-to-Long Term Targets (if bullish momentum sustains):
🔸 21.59 – 27.96 USDT
🔸 Ultimate target: 46.65 USDT (retest of previous major supply zone)
📈 Potential upside: Over 200% from current levels
---
🔴 Bearish Scenario (Alternative):
If the price fails to hold above the demand zone (drops below 10.00 USDT):
Possible retest of key supports:
🔹 8.50 USDT
🔹 7.13 USDT (major swing low)
⚠️ A confirmed breakdown could signal a continuation of the macro downtrend.
---
🔍 Key Levels to Watch:
Price Level Type Notes
7.13 USDT Major Support Previous swing low
8.50–10.20 USDT Demand Zone Reaccumulation / strong buyer interest
11.25 – 12.48 USDT Key Resistance Breakout trigger zone
15.11 – 17.11 USDT Minor Resistance First bullish targets
21.59 – 27.96 USDT Extension Targets Bullish breakout continuation
46.65 USDT Major Supply Historical resistance zone
---
🧠 Conclusion:
TRUMPUSDT is showing early signs of a macro reversal, with clear accumulation structure and breakout potential forming above a well-defined base. If confirmed by volume and price structure, the upside could be significant.
However, traders should remain cautious and watch for volume confirmation and failure points around key support.
#TRUMPUSDT #CryptoBreakout #AltcoinSetup #BullishReversal #TechnicalAnalysis #ReaccumulationZone #SmartMoneyMoves #PriceActionCrypto #AltcoinAnalysis#CryptoSignals #AltseasonReady
Tariffs incoming...July 23: Markets are booming.
August 1st: Tariffs.
I'm just saying, it might be a nice discount...
#market #finance #tariff #trump #crypto #forex #stocks #economy #trading
Trump did it again!Donald Trump did exactly what he did in his previous term: Dollar Devaluation .
Reason? Strengthening the US exports.
Will it work? We'll see.
What's your thoughts?
#dollar #forex #euro #devaluation #trump #exports #trading #algo