What Happens the Day Jerome Powell Is Fired or Quits?A sudden exit by Fed Chair Jerome Powell would create both a political and monetary shock.
While the Chair is technically protected from arbitrary removal. Recent reports confirm that President Trump and his allies are scrutinising the Fed’s $2.5 billion renovation project—potentially laying the groundwork for a “for cause” dismissal.
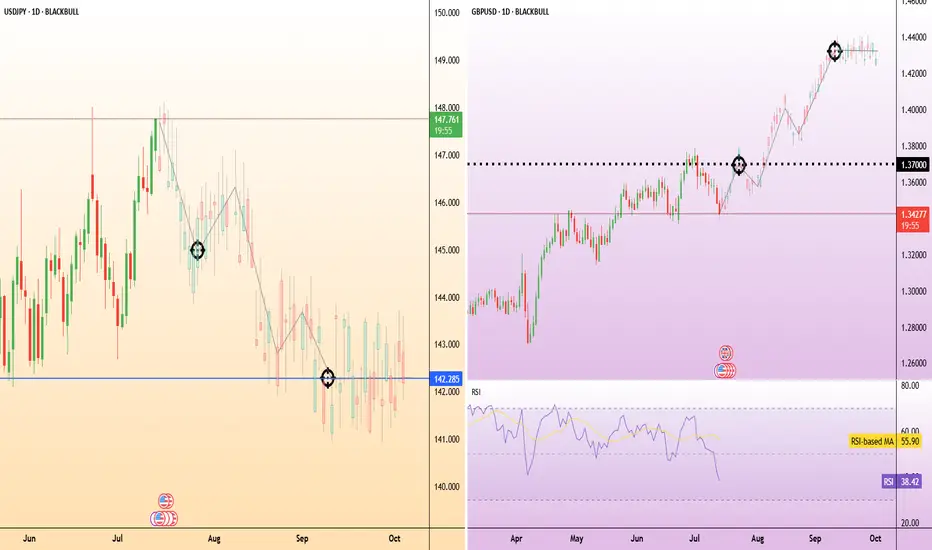
A surprise departure would undermine confidence in the Fed’s independence. The U.S. dollar could fall sharply across major pairs.
USD/JPY could fall toward ¥145, with safe-haven demand favouring the yen. However, the reaction may be less severe than in pairs like Swiss franc which we have noted in the past is the potentially preferred safe haven. A panic selloff could extend to 142.20—a prior consolidation floor.
GBP/USD could surge as traders anticipate a more dovish Fed stance under the new Trump-stooge Fed Chair. From a technical perspective, GBP/USD is maybe already oversold and potentially poised for a potential rebound anyway—Powell’s resignation or firing could potentially exacerbate this. The first level to watch being a return to 1.3700, assuming the likely expectation of Fed rate cuts rise.
Trump
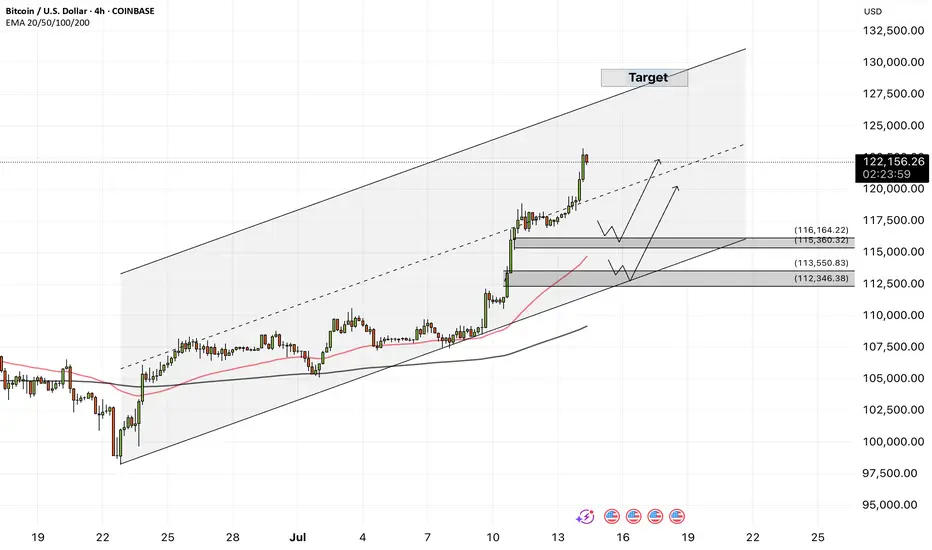
Bitcoin - Bitcoin, Unrivaled in the Market!Bitcoin is above the EMA50 and EMA200 on the four-hour timeframe and is in its ascending channel. Bitcoin’s current upward momentum has the potential to reach the target of $130,000. If it corrects, Bitcoin buying opportunities can be sought from the specified demand zones.
It should be noted that there is a possibility of heavy fluctuations and shadows due to the movement of whales in the market and compliance with capital management in the cryptocurrency market will be more important. If the downward trend continues, we can buy within the demand area.
In recent days, Bitcoin has managed to set a new historical high by crossing the $118,000 level; a jump that followed the strong accumulation of institutional capital, the upward trend of spot ETFs and the remarkable consolidation of such indices. This growth is not only the result of technical conditions or short-term market excitement, but is a clear reflection of the structural maturity of the Bitcoin ecosystem in the second half of 2025. A careful and comprehensive examination of the fundamental parameters shows that Bitcoin is moving differently than in the past: slower, but with much stronger support. On the other hand, more than $205 million in Bitcoin short selling positions have been liquidated following the jump in the price of Bitcoin and its crossing the $122,000 level.
First, the flow of investment from Bitcoin spot ETFs has broken records over the past week. In one day, more than $1.18 billion entered these funds, and the total annual inflow of these financial instruments has reached more than $51 billion. This is while ETFs such as IBIT (managed by BlackRock) and FBTC (managed by Fidelity) are attracting hundreds of Bitcoins daily, without causing any negative divergence in price indices. This phenomenon clearly shows that the participation of institutional investors through regulated channels is not only stable, but also accelerating. Along with this flow of capital, the parameters of the chain also paint a picture of a market with a balance of supply and demand. The MVRV ratio, an indicator for measuring market profitability, fluctuates between 2.2 and 2.34, meaning that the market is in a reasonably profitable state, but is still some way from the warning zone of profit saturation. Meanwhile, long-term holders (LTHs) are also continuing to accumulate. Long-term wallet holdings have reached a record high of 14.7 million BTC, representing nearly 70% of the total supply. In the last quarter alone, more than 13,000 BTC have been added to this group’s reserves.
On the other hand, the SOPR indicator, which measures realized profit ratio, shows that profit-taking is taking place at a gentle slope in the market, away from heavy selling pressure. This logical trend of profit-taking is a testament to mature investor behavior. Bitcoin flows to exchanges are also at very low levels; Bitcoin held on exchanges now account for just 1.25% of the total supply—the lowest level in over a decade. This significant reduction in potential selling pressure has kept Bitcoin’s price stable in the face of short-term volatility.
Behaviorally, the market is also showing signs of maturation. The number of daily active addresses has remained stable, but unlike during the buying frenzy, we are no longer seeing retail traders rushing into exchanges or mass wallet outflows. In other words, on-chain activity has stabilized, similar to the behavior of traditional mature markets—markets driven by data and structure, not emotion. From a macro perspective, the outlook for Bitcoin in the medium term is also positive. Many analysts and institutions, including Global X ETFs, see Bitcoin’s growth to $200,000 within the next 12 months as achievable. Technical analysis from some sources has also outlined the $140,000 range as the next price target in the next 100 days, provided that the VIX volatility index remains low and macroeconomic data maintains its current trajectory. However, a more conservative scenario sees a price consolidation in the $95,000-$100,000 range if geopolitical pressures increase or ETF inflows weaken.
Overall, Bitcoin is moving ahead in the summer of 2025 not only on the back of crypto market excitement, but also on the back of strong fundamentals and structured institutional capital inflows. Accumulation by long-term holders, a steady decline in supply on exchanges, a reasonable profit-taking balance, and a formal investment structure via ETFs have all combined to bring the market to a stable state and ready for further increases. If this trend holds, levels of $125,000-$140,000 in the short term, and a range of $180,000-$200,000 by the end of the year, are not far off!
On the other hand, BlackRock’s Bitcoin ETF (IBIT) managed to record the fastest growth in history among all ETFs, surpassing $80 billion in assets in just 374 days! For comparison, it should be noted that the S&P500 Index ETF needed about 5 times this time! BlackRock now holds about 706,000 Bitcoins (equivalent to 56% of the total ETF share).
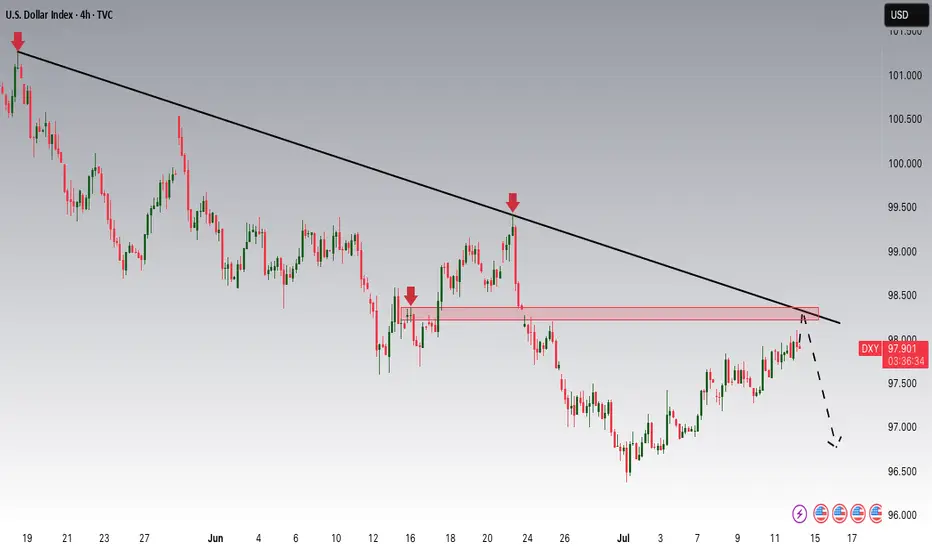
DXY Potential DownsidesHey Traders, in today's trading session we are monitoring DXY for a selling opportunity around 98.300 zone, DXY is trading in a downtrend and currently is in a correction phase in which it is approaching the trend at 98.300 support and resistance area.
Trade safe, Joe.
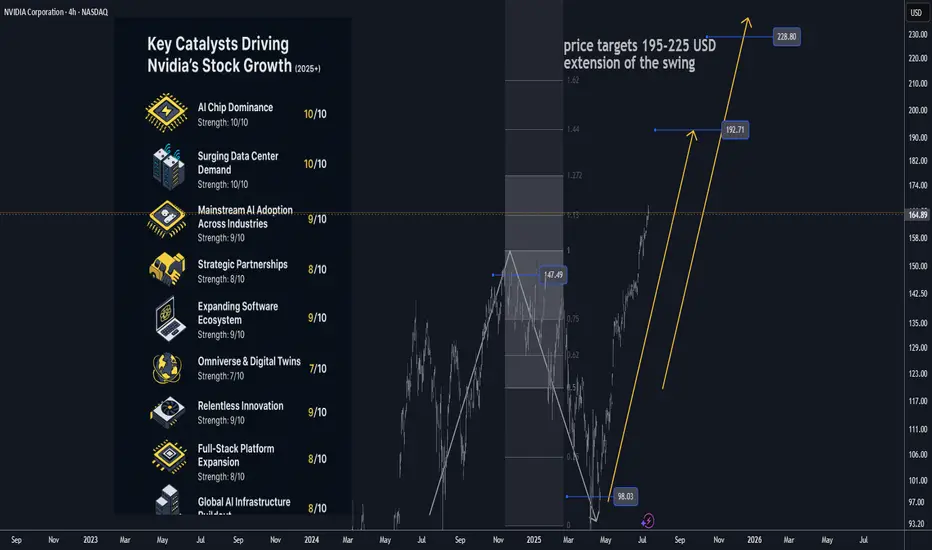
Nvidia (NVDA) 2025+ Catalysts & Risks: Analyst Views🚀 Nvidia (NVDA) 2025+ Catalysts & Risks: Analyst Views
🔑 Key Catalysts Driving Nvidia’s Stock Growth (2025+)
1. 🏆 AI Chip Dominance
Nvidia maintains >90% market share in data-center AI chips (Blackwell, Hopper, Rubin). Its CUDA ecosystem and relentless innovation keep it as the “default” supplier for advanced AI, giving NVDA massive pricing power.
2. 🏗️ Surging Data Center Demand
Cloud and enterprise AI spending remains white-hot. Tech giants (Meta, Microsoft, Amazon, Google) are collectively pouring $300B+ into 2025 AI CapEx. Data center revenues are at all-time highs; analysts expect this uptrend to extend through 2026 as “AI infrastructure arms race” persists.
3. 🌐 Mainstream AI Adoption
AI is now integrated in nearly every industry—healthcare, finance, logistics, manufacturing, retail. As companies embed AI at scale, NVDA’s hardware/software sales rise, with “AI everywhere” tailwinds supporting 15–25% annual growth.
4. 🤝 Strategic Partnerships
Big wins: Deals with Snowflake, ServiceNow, and massive sovereign/international AI collaborations (e.g., $B+ Saudi Arabia/“Humain” order for Blackwell superchips; UAE, India, and Southeast Asia ramping up AI infrastructure using Nvidia).
5. 🚗 Automotive/Autonomous Vehicles
NVDA’s automotive AI segment is now its fastest-growing “new” business line, powering next-gen vehicles (Jaguar Land Rover, Mercedes, BYD, NIO, Lucid) and expected to surpass $1B+ annual run rate by late 2025.
6. 🧑💻 Expanding Software Ecosystem
Nvidia’s “full stack” software (CUDA, AI Enterprise, DGX Cloud) is now a sticky, recurring-revenue engine. Over 4M devs are building on Nvidia’s AI SDKs. Enterprise AI subscriptions add high-margin growth on top of hardware.
7. 🌎 Omniverse & Digital Twins
Industrial metaverse and simulation/digital twin momentum is building (major partnerships with Ansys, Siemens, SAP, Schneider Electric). Omniverse becoming the industry standard for 3D AI/simulation, unlocking new GPU/software demand.
8. 🛠️ Relentless Innovation
Blackwell Ultra GPUs debuting in late 2025, “Rubin” architecture in 2026. Fast-paced, aggressive product roadmap sustains Nvidia’s tech lead and triggers constant upgrade cycles for data centers and cloud providers.
9. 📦 Full-Stack Platform Expansion
Grace CPUs, BlueField DPUs, and Spectrum-X networking mean Nvidia is now a “one-stop shop” for AI infrastructure—capturing more value per system and displacing legacy CPU/network vendors.
10. 🌏 Global AI Infrastructure Buildout
Recent US export rule rollbacks are a huge tailwind, opening up new high-volume markets (Middle East, India, LatAm). Nvidia remains the “go-to” AI chip supplier for sovereign and enterprise supercomputers outside the US, supporting continued global growth.
________________________________________
📈 Latest Analyst Recommendations (July 2025)
•Street Consensus: Overwhelmingly bullish—~85% of analysts rate NVDA as “Buy/Overweight” (rest “Hold”), with target prices often in the $140–$165 range (post-split, as applicable).
•Target Price Range: Median 12-month PT: $150–$160 (representing ~20% upside from July 2025 levels).
•Key Bullish Arguments: Unmatched AI chip lead, accelerating enterprise AI adoption, deep software moat, and a robust international/sovereign AI order pipeline.
•Cautious/Bearish Notes: Valuation premium (45–50x P/E), high expectations priced in, geopolitical and supply chain risks.
________________________________________
⚠️ Key Negative Drivers & Risks
1. 🇨🇳 US–China Tech War / Chip Export Restrictions
• US restrictions: While the Biden administration eased some export bans in May 2025 (allowing more AI chip exports to Gulf/Asia partners), China remains subject to severe curbs on advanced NVDA AI chips.
• Workarounds: Nvidia is selling modified “China-compliant” chips (H20, L20, A800/H800), but at lower margins and lower performance.
• Risk: If US tightens controls again (post-election), China sales could fall further. Chinese firms (Huawei, SMIC, Biren) are also racing to build their own AI chips—posing long-term competitive risk.
2. 🏛️ Political/Regulatory Risk
• Election year: A US policy shift (e.g., harder tech stance after Nov 2025 election) could re-restrict exports, limit new markets, or disrupt supply chains (especially TSMC foundry reliance).
3. 🏷️ Valuation Risk
• NVDA trades at a substantial premium to tech/semiconductor peers (45–50x fwd earnings). Any AI “spending pause” or earnings miss could trigger sharp volatility.
4. 🏭 Supply Chain & Capacity Constraints
• As AI chip demand soars, there’s ongoing risk of supply/delivery bottlenecks (memory, HBM, advanced packaging), which could cap near-term revenue upside.
5. 🏁 Competitive Threats
• AMD, Intel, and custom in-house AI chips (by Google, Amazon, Microsoft, Tesla, etc.) are scaling up fast. Loss of a hyperscaler account or a successful open-source software alternative (vs CUDA) could erode Nvidia’s dominance.
6. 💵 Customer Concentration
• A small handful of cloud giants account for >35% of revenue. Delays or pullbacks in their AI spending would materially impact results.
________________________________________
📝 Summary Outlook (July 2025):
Nvidia’s AI chip monopoly, software moat, and global AI arms race create a powerful multi-year growth setup, but the stock’s high valuation and US-China chip tension are real risks. Analyst consensus remains strongly positive, with most seeing more upside as data-center and enterprise AI demand persists—but with increased focus on geopolitical headlines and potential supply chain hiccups.
________________________________________
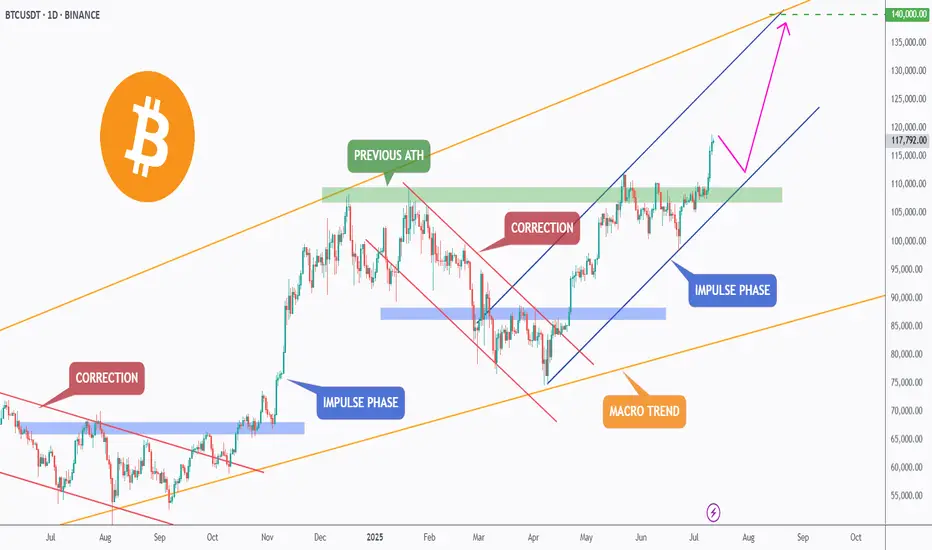
BTC is Back in Price Discovery Mode — Targeting $140K!After a clean break above the previous all-time high, Bitcoin has officially entered a new impulse phase, trading within a steep rising channel.
The green zone around the previous ATH is now acting as a strong support zone, confirming the shift in market structure.
🟠 The macro trend remains intact, and bulls are clearly in control.
🌀 Corrections continue to offer opportunities for trend-following entries, and if momentum holds, BTC could be on its way toward the $140,000 mark — the upper boundary of the macro channel.
Until then, every dip is a gift in this bullish cycle. 🔥
🧠 Trade with the trend. Manage your risk. Stay ready.
📚 Always follow your trading plan regarding entry, risk management, and trade management.
Good luck!
All Strategies Are Good; If Managed Properly!
~Richard Nasr
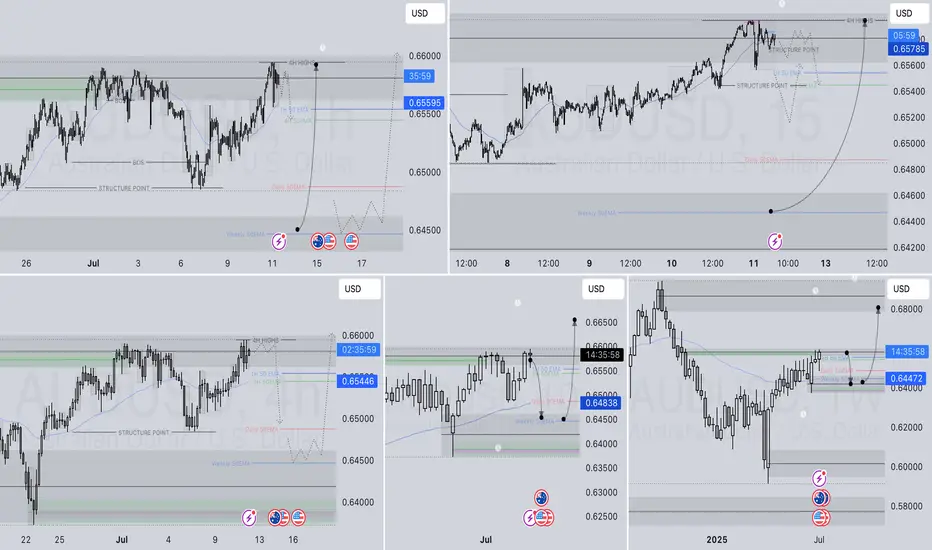
AUDUSD SHORT & LONG FORECAST Q3 D11 W28 Y25AUDUSD SHORT & LONG FORECAST Q3 D11 W28 Y25
It’s Fun Coupon Friday! 💸🔥
Professional Risk Managers👋
Welcome back to another FRGNT chart update📈
Diving into some Forex setups using predominantly higher time frame order blocks alongside confirmation breaks of structure.
Let’s see what price action is telling us today! 👀
💡Here are some trade confluences📝
✅Daily Order block identified
✅4H Order Block identified
✅1H Order Block identified
🔑 Remember, to participate in trading comes always with a degree of risk, therefore as professional risk managers it remains vital that we stick to our risk management plan as well as our trading strategies.
📈The rest, we leave to the balance of probabilities.
💡Fail to plan. Plan to fail.
🏆It has always been that simple.
❤️Good luck with your trading journey, I shall see you at the very top.
🎯Trade consistent, FRGNT X
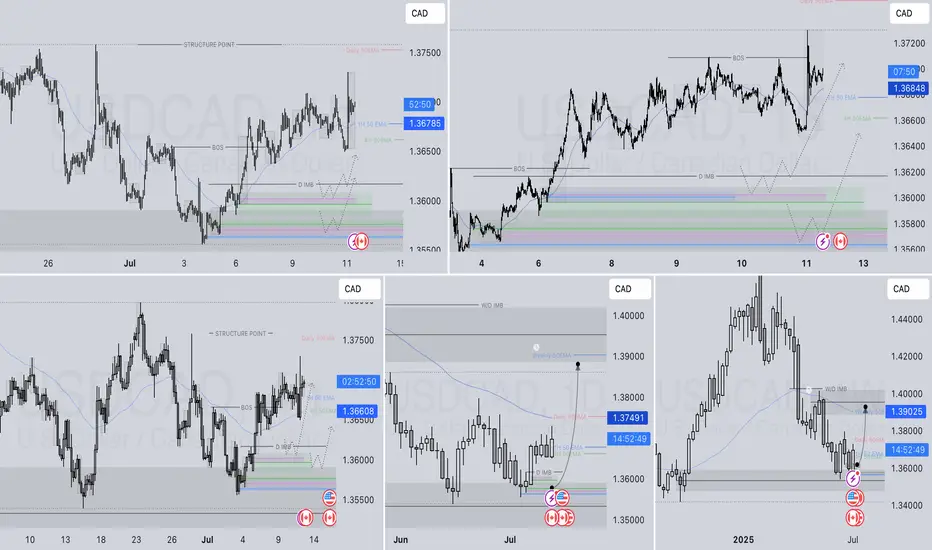
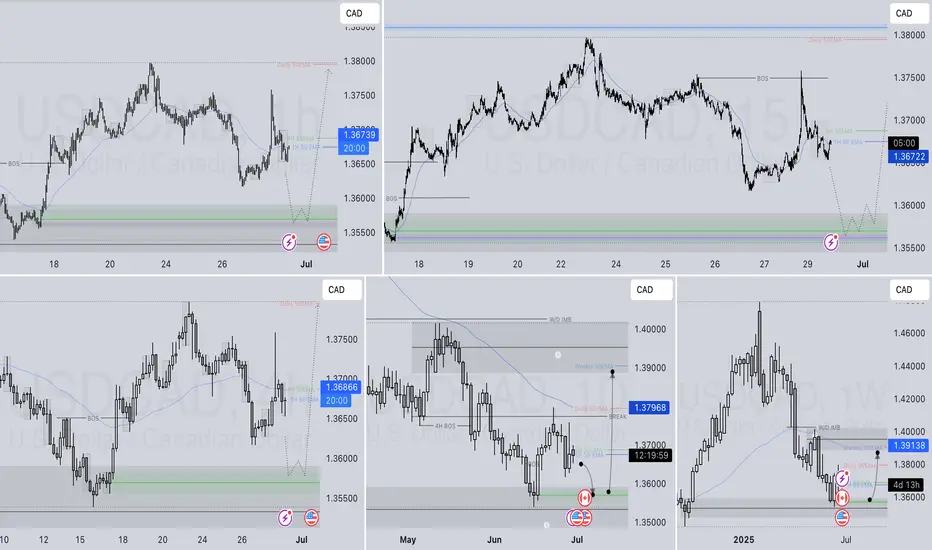
USDCAD LONG DAILY FORECAST Q3 D11 W28 Y25USDCAD LONG DAILY FORECAST Q3 D11 W28 Y25
It’s Fun Coupon Friday! 💸🔥
Professional Risk Managers👋
Welcome back to another FRGNT chart update📈
Diving into some Forex setups using predominantly higher time frame order blocks alongside confirmation breaks of structure.
Let’s see what price action is telling us today! 👀
💡Here are some trade confluences📝
✅Daily Order block identified
✅4H Order Block identified
✅1H Order Block identified
🔑 Remember, to participate in trading comes always with a degree of risk, therefore as professional risk managers it remains vital that we stick to our risk management plan as well as our trading strategies.
📈The rest, we leave to the balance of probabilities.
💡Fail to plan. Plan to fail.
🏆It has always been that simple.
❤️Good luck with your trading journey, I shall see you at the very top.
🎯Trade consistent, FRGNT X
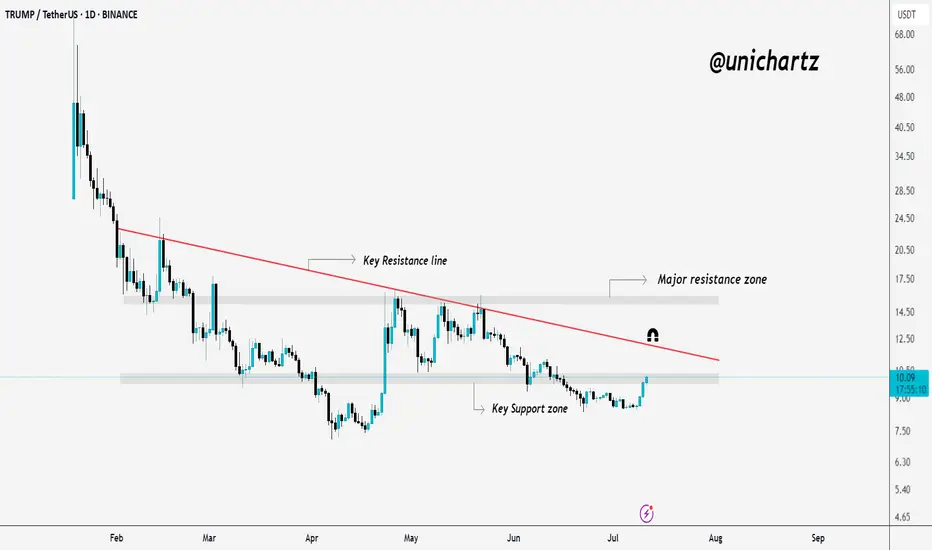
TRUMP/USDT Eyeing a Breakout – Key Levels Ahead!Trump is currently trading just below the resistance zone.
If we see a daily candle close above this key area, it could trigger a move toward the red trendline, and possibly even into the major resistance zone above.
Eyes on the breakout!
DYOR, NFA
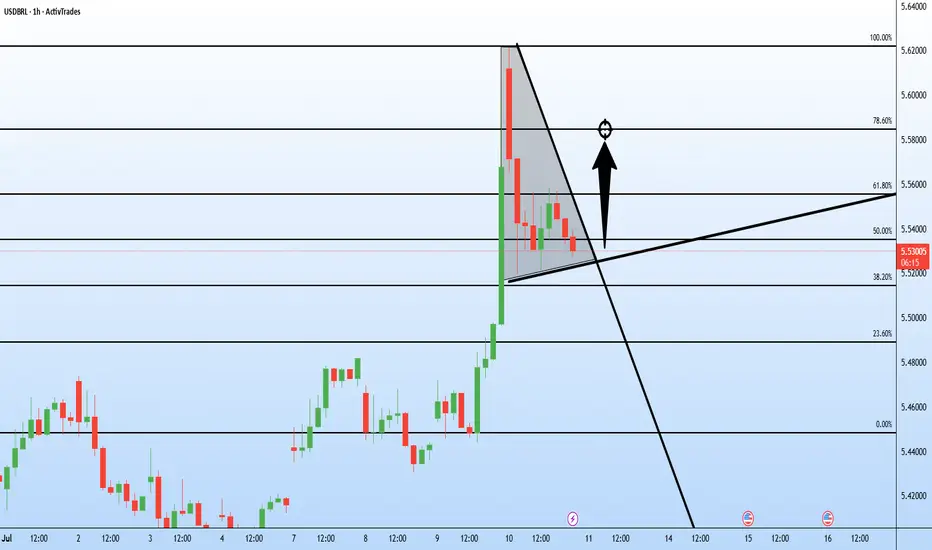
Trump’s 50% tariff sparks USD/BRL breakout The Brazilian real weakened sharply against the U.S. dollar after US President Trump announced 50% tariffs on Brazilian exports, effective 1 August.
In response, Brazilian President Luiz Inacio Lula da Silva announced Brazil would retaliate with the same rate on U.S. imports. Trump has already pledged to retaliate if Brazil retaliates.
USD/BRL rallied from just under 5.44 to a high near 5.63. On the 1-hour chart, the pair is now retracing but perhaps consolidating in a narrow range between the 61.8% and 38.2% Fibonacci zones.
With tariffs set to begin in under a month and both sides not ready to back down, USD/BRL remains sensitive.
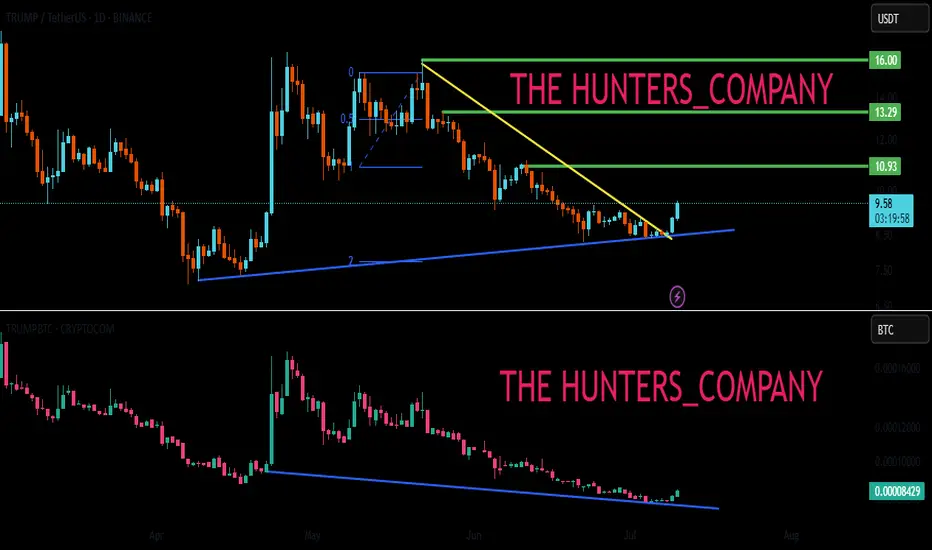
TRUMP BUY ???Hello friends🙌
🔊As you can see in the picture, we have brought you two Trump charts:
1_TRUMP/USDT, in which we see an upward trend.
2_TRUMP/BTC, in which we see a downward trend.
✔Now what is the conclusion? When this negative divergence occurs, it means that money flows from Bit to Tether, and we can expect good growth from it to the specified targets, given the price reaching important support and its return📈
🔥Join us for more signals🔥
Trade safely with us.
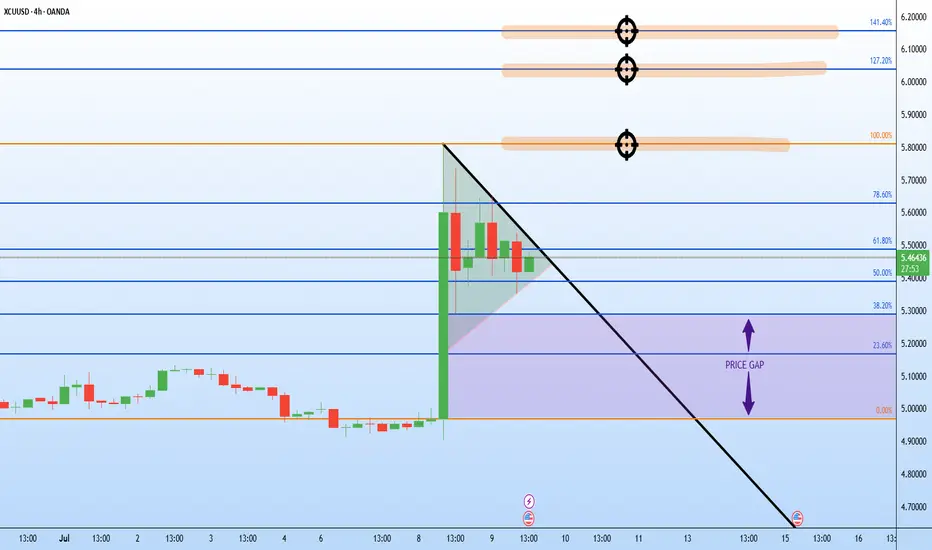
Gap below… but copper’s breakout still in playCopper markets erupted higher this week following President Trump's proposal to impose a 50% tariff on copper imports. The price ripped from just above $5.20 to nearly $5.80 in a single 4-hour candle.
Now, copper could be forming a bullish flag or pennant on the 4-hour timeframe. After the vertical spike, price is consolidating in a tight, potentially downward-sloping channel between ~$5.45 and ~$5.60.
If confirmed with a clean breakout above the flag’s upper trendline - perhaps near $5.62—the next leg could project toward the previous high near $5.80
There’s also a gap below current price action, between $5.20 and $5.35, formed during the explosive move up. While gaps can act as support zones, they also tend to get revisited.
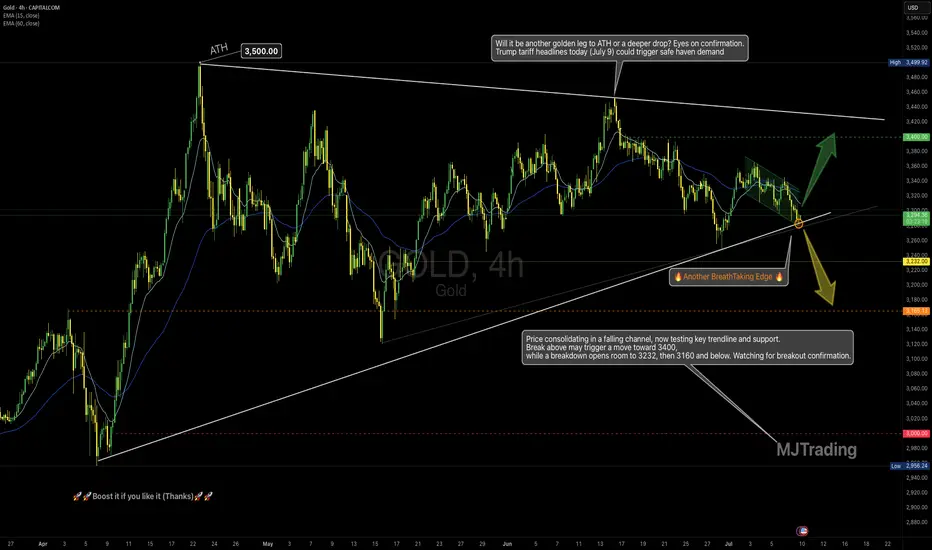
Gold at a Decision Point-Just as Tariff Headlines Return(July 9)📌
4H Technical Outlook by MJTrading
Price is compressing inside a falling channel, nested within a large symmetrical triangle, and now sits right at a high-stakes confluence zone — a perfect intersection of dynamic EMAs, rising trendline support, and local structure.
This could be a pivot point for the next major leg.
🧭 Key Scenarios:
🟢 Bullish Breakout Potential:
If price breaks above the falling channel and holds above $3,310–$3,320:
🎯 Target: $3,400, and eventually upper triangle resistance near $3,480–$3,500
✅ Watch for impulsive breakout + retest confirmation
🟡 Bearish Breakdown Risk:
If the rising trendline gives way and price closes below $3,275 (High Risk) and $3,245(Low Risk):
🎯 Targets: First $3,232, then key level $3,166
⚠️ Further weakness may expose $3,000 psychological support
🔍 Why It Matters:
• Symmetry + compression = potential volatility expansion
• Trump tariff headlines today (July 9) could trigger safe haven demand
• Strong historical respect of these trendlines
• EMAs aligning around decision zone
“Another BreathTaking Edge” — because this is one of those moments where market structure whispers louder than words.
🗣 Boost if you find value, and follow MJTrading for more clean setups.🚀🚀
#XAUUSD #Gold #TradingView #TechnicalAnalysis #ChartPatterns #PriceAction #BreakoutTrade #Forex #MJTrading
Zoom in to get closer to battlefield:
Zoom out to see where we are:
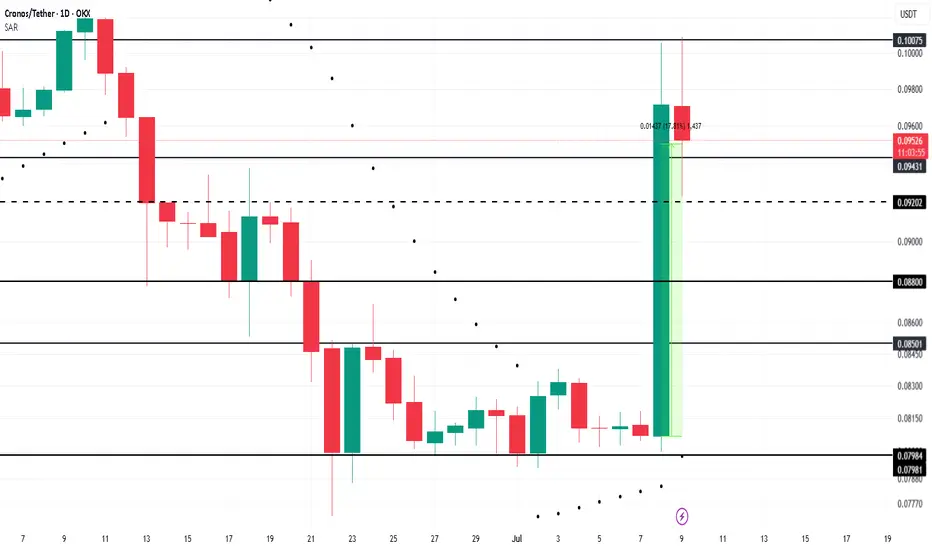
Cronos Rallies 18% After Truth Social Files for Blue-Chip ETFOKX:CROUSDT is a leading candidate for a Binance listing this month, following the proposed Crypto Blue-Chip ETF filed by Truth Social with the SEC. The fund includes 70% Bitcoin, 15% Ethereum, 8% Solana, 5% Cronos, and 2% XRP , positioning Cronos as a key asset in the fund.
Of the tokens in the proposed fund, only Cronos (CRO) is not currently listed on Binance. If the SEC approves the Crypto Blue-Chip ETF, Binance could fast-track the listing of Cronos . This move would likely draw more liquidity and investor interest toward CRO, fueling its price growth.
OKX:CROUSDT price surged by 17.8% over the last 24 hours, signaling strong momentum. If the ETF listing is approved and Binance acts swiftly, CRO could break through key resistance levels, potentially surpassing $0.1007. This upward movement would benefit investors, continuing the positive trend for the altcoin.
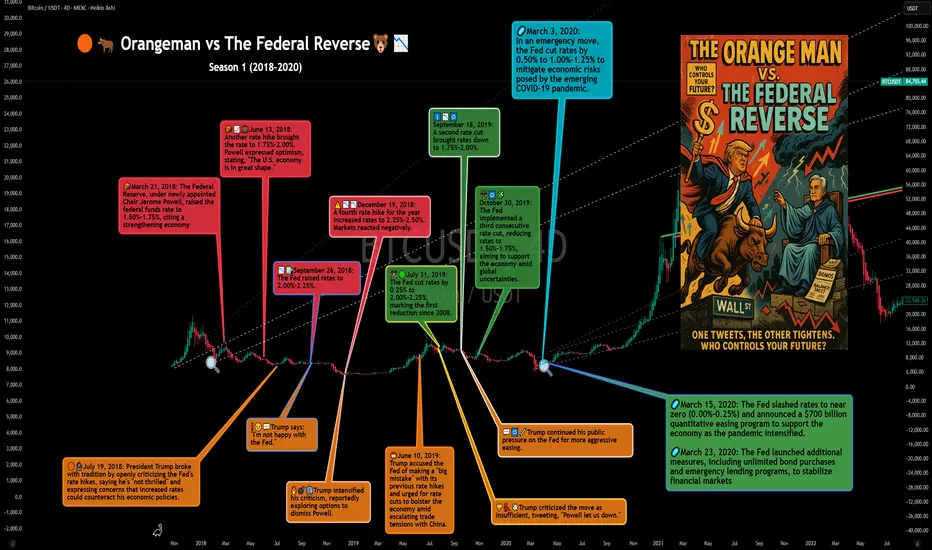
Orangeman vs The Federal Reverse: Season 1 (2018–2020)It all started in 2018... 🎬
🧱📈💼 March 21, 2018: Jerome Powell steps in as the new Fed Chair. Almost immediately, the Fed hikes rates from 1.50% to 1.75%, citing a strong U.S. economy.
💬📊🇺🇸 June 13, 2018: Another hike to 2.00%. Powell says the U.S. economy is “in great shape.” But markets? Not so thrilled.
🗣️📉🇺🇸 July 19, 2018: Enter The Orangeman—President Trump publicly attacks the Fed's policy, breaking tradition. He’s “not thrilled” with the hikes.
📉🏦 September 26, 2018: Yet another hike to 2.25%. The Fed stays firm. Trump? Getting louder.
❗😠💬 "I'm not happy with the Fed." – Trump
⚠️📉📉 December 19, 2018: Fourth hike of the year to 2.50%. Markets tank. Rumors swirl: Trump wants Powell gone.
🔥💣👔 Behind the scenes: Trump reportedly explores ways to dismiss Powell. The pressure is on.
📛🇺🇸📉 June 10, 2019: The battle heats up. Trump calls the hikes a “big mistake” and demands rate cuts.
✂️📉📉 July 31, 2019: Powell blinks. The Fed cuts rates by 0.25%—first cut since 2008. Trump tweets:
👎🐦💸 “Powell let us down.”
⬇️📉🔁 September 18, 2019: Second cut.
⚖️🔁🧩 October 30, 2019: Third consecutive cut. The Fed pivots completely. The Orangeman’s influence is undeniable.
🦠🧪📉 March 2020: COVID strikes. The Fed responds with emergency rate cuts.
🌀🧻💸 March 15 & 23, 2020: Rates slashed to near zero. QE infinity unleashed. Powell goes full printer mode. Bitcoin begins to stir...
Season 1 closes with markets melting down, a pandemic, and the Fed surrendering to zero rates.
But The Orangeman isn’t done...
And The Federal Reverse still lurks in the shadows.
Next up: tariffs, China, currency wars, and another campaign trail. 🐉💵⚔️
Season 2 is coming.
Stay tuned...
One tweets.
The other tightens.
Who controls our future?
One Love,
The FXPROFESSOR 💙
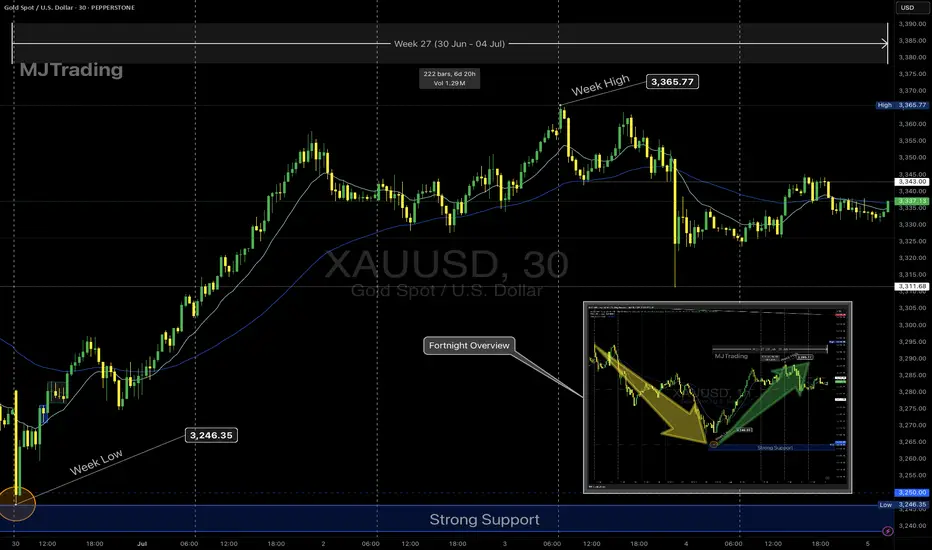
Gold Weekly Recap – Week 27 (30 Jun – 04 Jul)🟡 XAUUSD | MJTrading
Overview
Gold (XAUUSD) staged a significant recovery this week after retesting a critical support zone. Price action reflected strong buying interest at lower levels, followed by consolidation near mid-range resistance.
🔹 Key Levels:
Strong Support Zone: 3,246 – 3,250
Weekly Low: 3,246.35 (30 June)
Weekly High: 3,365.77 (3 July)
Closing Price: ~3,343
🔹 Price Action Summary:
✅ Early Week Retest & Reversal
After the prior week’s decline, gold opened the week near the major support area around 3,246. This zone acted as a strong demand pocket, triggering a swift rejection and initiating a bullish reversal.
✅ Sustained Rally to Resistance
Price climbed steadily, riding the 15-period EMA to reach the weekly high of 3,365.77 on 3 July. This move represented a nearly 4% recovery off the lows, fueled by renewed safe-haven flows and short covering.
✅ Midweek Consolidation
Following the rally, gold entered a sideways consolidation phase between 3,340 and 3,365. EMA flattening reflected a pause in momentum as traders assessed the next directional catalyst.
✅ Late-Week Pullback
Toward the end of the week, price tested the 3,310–3,320 area before modestly bouncing into the Friday close. Overall, the market maintained a cautiously bullish tone while holding above the prior support.
🔹 Technical Perspective:
🔸 Bias: Cautiously Bullish
Price defended the strong support and printed a higher low structure.
Sustained closes above 3,300 maintain the bullish outlook.
🔸 Near-Term Resistance:
3,365–3,390 remains the immediate supply zone to monitor for breakout attempts.
🔸 Key Support:
The 3,246–3,250 area continues to be the primary downside line in the sand.
🔹 Special Note – 4th July US Bank Holiday
Trading volumes were notably lighter on Thursday, 4th July, due to the US Independence Day holiday. This contributed to reduced liquidity and muted volatility, with many traders and institutions off desks. The thinner market conditions likely influenced the late-week pullback and consolidation, as participation was limited heading into the weekend.
🔹 Sentiment & Outlook
The decisive rebound from support suggests that buyers are defending value zones aggressively. However, failure to close the week above 3,365 leaves gold vulnerable to another retest of mid-range levels if fresh catalysts don’t emerge.
Traders should watch for:
A clean breakout above 3,365 to confirm continuation higher.
Any sustained weakness below 3,300 as a signal of fading bullish momentum.
🧭 Next Week’s Focus:
Monitoring whether the consolidation evolves into accumulation or distribution.
Watching for a breakout or deeper pullback
Reactions to upcoming economic data
EMA alignment: If the 15 EMA continues to track above the 60 EMA, it supports a bullish bias.
Chart Notes:
The main chart highlights this week’s action, while the inset provides a fortnight overview of the broader decline and recovery for context.
Thank you for your time and your support...
🚀🚀Boost it if you like it (Thanks)🚀🚀
#Gold #XAUUSD #GoldTrading #Forex #Commodities #TechnicalAnalysis #PriceAction #TradingRecap #MJTrading #GoldForecast #MarketReview #WeeklyRecap #TradingView
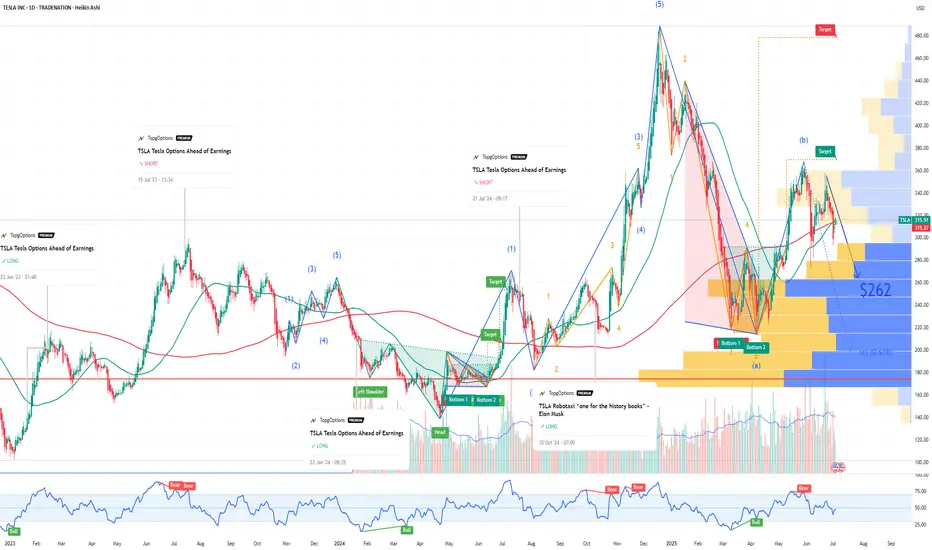
TSLA bearish: Musk vs Trump! Subsidy Spotlight & Sentiment RisksIf you haven`t bought TSLA before the recent breakout:
Now you need to know that Tesla (TSLA) is sitting around $315, but the vibe is getting shakier. Elon Musk’s feud with Donald Trump — complete with jokes about “putting the DOGE on him” if deported — might feel like another meme moment, but it spotlights Tesla’s huge dependency on federal and state support.
Estimates show Tesla could face up to $48 billion in lost government contracts and incentives over the next decade if the political tide turns. With Trump’s base calling out “green subsidies” as wasteful, Tesla’s funding pipeline could get squeezed — just as competition ramps up and margins get tighter.
Key Bearish Points
1) Political Risk Is Real
Musk’s public fight with Trump is a double-edged sword: he risks losing goodwill on both sides of the aisle. If the next administration decides to gut EV credits, Tesla could take a huge hit — far more than its rivals who rely less on U.S. incentives.
2) Subsidy Dependence
Tesla’s success is partly built on a foundation of tax credits, carbon credits, and favorable policies. $48B in potential lost value is nothing to shrug off — especially when competitors like BYD are gaining ground.
3) Bearish Technical Setup
TSLA’s chart is rolling over inside a bearish channel. It recently failed to hold the $330 level and now sits around $315. A clean breakdown below $300 could open the door to your target zone at $262 — a major support area from earlier this year.
Catalysts:
Any new comments from Trump’s camp about EV subsidies
Weak delivery/margin numbers from Tesla
Broader tech/equity pullback
Musk’s crypto distractions no longer propping up sentiment
Disclosure: I am part of Trade Nation's Influencer program and receive a monthly fee for using their TradingView charts in my analysis.
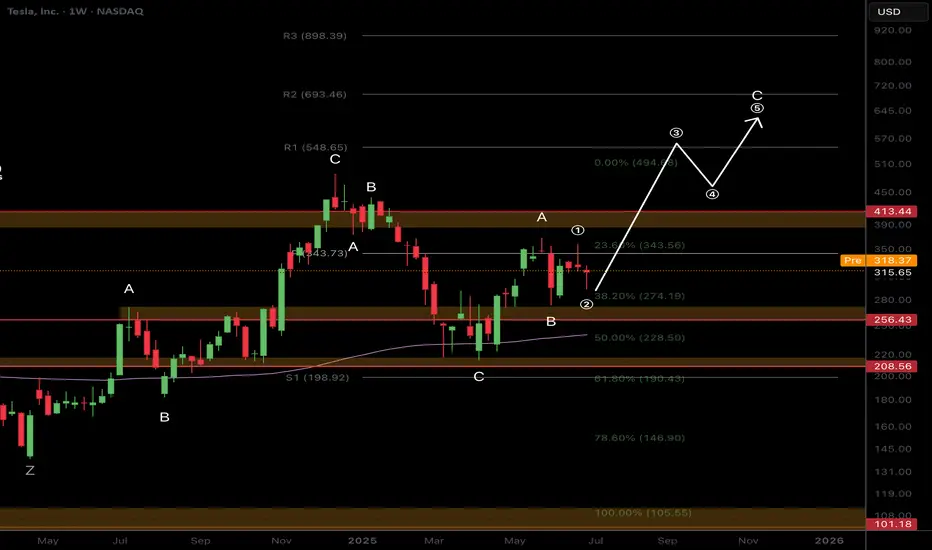
$TSLA Time to Fade or..?NASDAQ:TSLA (like NASDAQ:GOOG ) is standing out to me as bullish, yet, corrective Elliot Waves a higher degree series of ABCs appear to be underway.
A final wave C appears to be underway which would take price too all time highs in an expanded flat correction pattern. My count could be wrong and the interference could be from the increase it sentiment volatility connected to the US headlines lately and Trump posting on socials. Things may get back to normal after the summer and a clearer pattern may emerge.
Price is struggling to get past the weekly pivot point bullishly or the weekly 200EMS bearishly and is trapped within that range.
For now long term target is the R2 daily pivot at $693 as the higher probability is continued upside
Safe trading
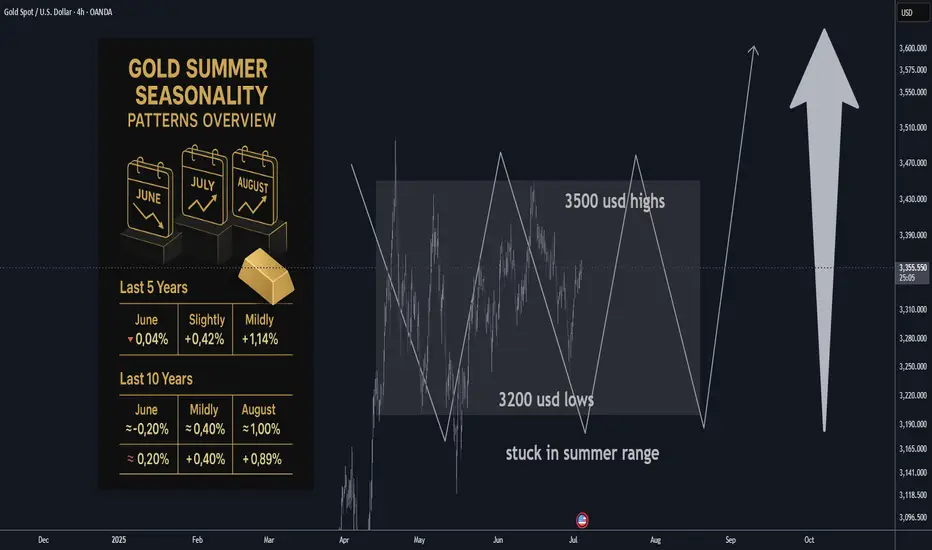
Gold Market Update: Stuck in summer time range / SeasonalityGold is stuck so far last 4-6 weeks in tight range trading conditions
due to summer time seasonality also strong gains previously
expecting range locked conditions in July as well here's an
overview of 5 years and 10 years of seasonality data by month
until at least August expecting dead market conditions it's best
to focus on trading the range or trading with automated algo instead.
Here are the two tables showing month-over-month percent changes in gold prices (London PM fix USD/oz) for June, July, and August:
| Year | June Close | July Close | August Close | June % | July % | August % |
| ---- | ---------: | ---------: | -----------: | -----: | ------: | -------: |
| 2023 | 1,942.90 | 1,951.02 | 1,918.70 | –0.04% | +0.42% | –1.68% |
| 2022 | 1,836.57 | 1,732.74 | 1,764.56 | –5.65% | +1.80% | +1.80% |
| 2021 | 1,834.57 | 1,807.84 | 1,785.28 | –1.47% | –1.48% | –1.22% |
| 2020 | 1,761.04\* | 1,771.65\* | 1,968.16\* | +8.66% | +11.19% | +10.99% |
| 2019 | 1,342.66\* | 1,413.39\* | 1,523.00\* | +5.29% | +7.95% | +7.74% |
| 2018 | 1,270.00\* | 1,230.00\* | 1,194.00\* | –1.09% | –3.15% | –3.02% |
| 2017 | 1,257.00\* | 1,243.00\* | 1,280.00\* | +0.72% | –1.10% | +2.93% |
| 2016 | 1,255.00\* | 1,364.00\* | 1,322.00\* | +3.24% | +8.67% | –3.11% |
| 2015 | 1,180.00\* | 1,172.00\* | 1,116.00\* | –2.06% | –0.68% | –4.69% |
| 2014 | 1,320.00\* | 1,311.00\* | 1,312.00\* | –0.65% | –0.68% | +0.08% |
🔍 Summary Highlights
June has been weak more often than not—negative in 6 of the past 10 years.
July shows modest gains overall—positive in 7 of the last 10.
August is the strongest summer month—positive 6 times out of the past 10, with several double-digit y/y gains (like +10.99% in 2020).
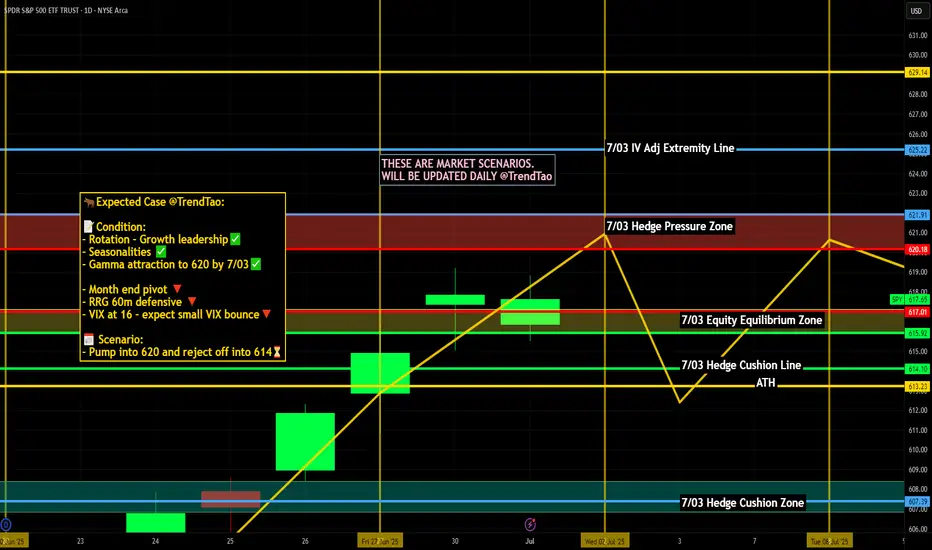
Nightly $SPY / $SPX Scenarios for July 2, 2025🔮 Nightly AMEX:SPY / SP:SPX Scenarios for July 2, 2025 🔮
🌍 Market-Moving News 🌍
🏭 U.S. Manufacturing Remains Under Pressure
The ISM Manufacturing PMI for June rose slightly to 49.0 from 48.5 in May—still in contraction territory. Tariff-induced uncertainty and rising input costs continue to weigh on factory activity, with new orders still weak and employment contracting
📈 Global Factory Rebound Led by India & Europe
While U.S. factories struggle, India hit a 14-month high in its manufacturing PMI at 58.4, and euro‑zone factory orders stabilized at 49.5—the first sign of recovery in over three years. Asia-Europe divergence may shift global capital flows .
🏦 Powell Says Tariffs Are Delaying Rate Cuts
Fed Chair Powell warned at the ECB forum in Sintra that elevated inflation—driven in part by Trump-era tariffs—has postponed the timeline for U.S. rate cuts. The Fed’s dot-plot now indicates only two cuts for 2025, with markets adjusting accordingly
💵 Dollar Nears 3½-Year Lows
The U.S. dollar weakened further, trading near a three-and-a-half-year low amid soft PMI data, a dovish Fed tilt, and renewed optimism over U.S.–Canada trade talks
📊 Key Data Releases & Events 📊
📅 Wednesday, July 2:
(No major scheduled U.S. economic data)
Market focus shifts to upcoming Nonfarm Payrolls on July 3, Powell's remarks, and trade-talk headlines.
⚠️ Disclaimer:
This information is for educational and informational purposes only and should not be construed as financial advice. Always consult a licensed financial advisor before making investment decisions.
📌 #trading #stockmarket #economy #manufacturing #Fed #inflation #charting #technicalanalysis
Gold Bounces from Demand Zone – Next Targets in Sight!By analyzing the gold chart on the 4-hour timeframe, we can see that today, price once again dipped into our key demand zone (Bullish Rejection Block) between $3245 and $3262, where it faced strong buying pressure and rallied up to $3296.
Currently, gold is trading around $3281, and as long as price holds above $3273, we expect further upside. The next potential targets are $3294, $3300, and $3309.
🎥 If you enjoyed this video analysis and found it helpful, please show your support with a LIKE and COMMENT below!
These video-style breakdowns take time and effort, and I’ll only continue them with your support 🙌
Your engagement is my biggest motivation to keep going 💛
Thanks for being part of the journey!

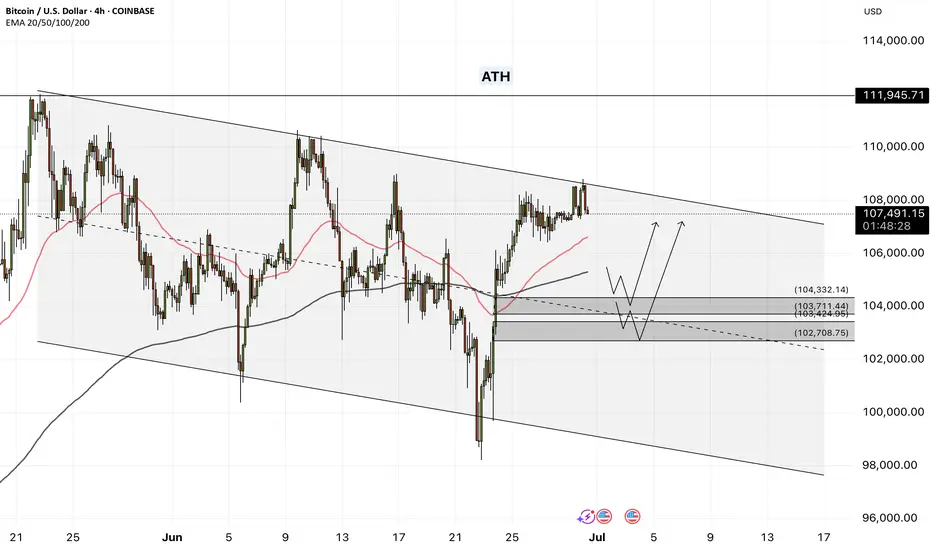
Bitcoin - Will Bitcoin Hit a New ATH?!Bitcoin is trading above the 50- and 200-EMAs on the four-hour time frame and is within its short-term descending channel. Bitcoin can be bought from the demand zone indicated. A break of the channel ceiling would pave the way for Bitcoin to rise to a new ATH.
It should be noted that there is a possibility of heavy fluctuations and shadows due to the movement of whales in the market and compliance with capital management in the cryptocurrency market will be more important. If the downward trend continues, we can buy within the demand range.
In recent days, Bitcoin has been trading in a range of around $107,000, and the market is going through a consolidation phase with complex but deeply fundamental characteristics. What matters at this point is not just the current price, but the precise mix of capital flows, the behavior of major players, on-chain data, and macroeconomic ratios that shape Bitcoin’s short- and medium-term trajectory. Overall, although Bitcoin’s rapid growth after the halving has stopped, internal market signals point to a continuation of the upward trajectory in a more stable framework.
The first important component is the significant influx of institutional capital into the market via ETFs. In the past week, according to CoinShares, more than $1.24 billion in new capital entered crypto products, with Bitcoin accounting for more than $1.1 billion. This marks the 10th consecutive week of capital inflows into the market, bringing the total inflows for 2025 to over $15 billion. Prominent ETFs such as BlackRock’s IBIT and Fidelity’s FBTC are attracting hundreds of Bitcoins per day, indicating steady institutional demand that has weathered the momentary volatility and is more focused on long-term asset building.
Alongside this capital inflow, the Onchain data also paints a mixed but highly interpretable picture. While the average active address rate has declined slightly and the MVRV (market value to realized value) has fallen from 2.29 to 2.20, these changes are more indicative of profit-taking by investors than selling pressure! In fact, rather than fear of a correction or crash, the market is witnessing a “gentle shift of ownership” between short-term and long-term holders. UTXO data also shows a roughly 5% increase in Bitcoin held for over 8 years, a strong sign of long-term accumulation and a decrease in the willingness to sell at current prices!
This can be seen as a period of supply and demand equilibrium; a period in which large investors have entered, but on the other hand, some older players are taking reasonable profits. This has led to a kind of price consolidation, which in June showed itself with only 2% growth—the weakest monthly growth since July last year. However, CoinDesk and Glassnode analysts rightly emphasize that this consolidation is not a sign of market weakness, but rather evidence of the maturity of Bitcoin’s price behavior. The price is reacting to data rather than becoming emotional.
From a macroeconomic perspective, Bitcoin remains highly sensitive to the Federal Reserve’s monetary policy, the value of the dollar, and interest rates. While the market is still waiting for interest rate cuts in the second half of the year, Bitcoin will remain in a quasi-expectant state until then, reacting to macro data, short-term and reactive. However, given that most ETFs follow long-term accumulation models, any stabilization in interest rates or easing geopolitical pressures could trigger a new wave of upside. Common analyst scenarios predict a range of $120,000-$130,000 for Bitcoin by the end of the summer if current conditions are maintained and capital inflows continue. In summary, Bitcoin is now at a stage where the dynamic combination of institutional accumulation, supply and demand balance, and on-chain data has transformed it from a purely risky asset into a strategic investment vehicle. The market has moved beyond the emotional phase and entered a phase of stability and maturity. This is a promising sign for long-term investors, provided that risk management is maintained and sensitivity to macro events is maintained. Bitcoin is preparing for the next stage of its rally—but unlike in the past, this time it is standing on the shoulders of fundamentals that are much stronger than at any time in the asset’s history.
ETFs with the most volume traded on Friday
Total: $501M
BlackRock: $153M
Fidelity: $165M
Grayscale: $0M
USDCAD LONG DAILY FORECAST Q3 D30 W27 Y25USDCAD LONG DAILY FORECAST Q3 D30 W27 Y25
Professional Risk Managers👋
Welcome back to another FRGNT chart update📈
Diving into some Forex setups using predominantly higher time frame order blocks alongside confirmation breaks of structure.
Let’s see what price action is telling us today! 👀
💡Here are some trade confluences📝
✅Daily Order block identified
✅4H Order Block identified
✅1H Order Block identified
🔑 Remember, to participate in trading comes always with a degree of risk, therefore as professional risk managers it remains vital that we stick to our risk management plan as well as our trading strategies.
📈The rest, we leave to the balance of probabilities.
💡Fail to plan. Plan to fail.
🏆It has always been that simple.
❤️Good luck with your trading journey, I shall see you at the very top.
🎯Trade consistent, FRGNT X
TLSA Catalyst Ranking and Market Update: June 2025Here's an updated/revised outlook for TSLA including all the primary
catalyst ranking and analyst ratings and overview of latest developments
🔋 1. EV Demand Growth
Strength: 9/10 → 9/10
Global electric vehicle adoption remains the dominant pillar. Tesla faces softer comp in Europe (–40.5% drop in May) wsj.com, but overall trend remains firmly upward. 🌍
🚗 2. Affordable Entry Level Model
Strength: 8.5/10 → 8.5/10
Tesla still on track to launch a < $25K EV in first half of 2025. Any delays or execution issues could pressure sentiment.
⚡ 3. Battery Cost & Margin Improvement
Strength: 8/10 → 8/10
Margins saw slight relief Q1, driven by cost cuts f, but macro headwinds persist.
🤖 4. Autonomy & Robotaxi Rollout
Strength: 7.5/10 → 8.5/10
Robotaxi debuted in Austin in June, sparking a ~10% one-day stock surge. Benchmark raised its target to $475/buy on the rollout—strong tailwind.
🚩 5. Competition
Strength: 7/10 → 6.5/10
Rivals like Xiaomi’s new YU7 are gaining ground. Tesla must maintain differentiation.
📉 6. Trade Policies & Tariffs
Strength: 6.5/10 → 6.5/10
Still relevant due to Tesla’s global footprint, though less front-page than before.
💰 7. Incentives & Subsidies
Strength: 6/10 → 6/10
U.S. IRA tax credit policies remain supportive; evolving eligibility remains a swing factor.
🛢️ 8. Commodity Costs
Strength: 5.5/10 → 5.5/10
Raw-material swings affect margins. Inventory hedges help but not wholly mitigate.
📈 9. Fed & Interest Rates
Strength: 5/10 → 5/10
A higher-rate environment still limits valuation multiples for growth-tier companies.
🎭 10. Musk Profile & Governance
Strength: 4/10 → 5/10
Analysts (e.g., Bradley Tusk) warn of being “massively overvalued” tied to Musk’s persona. Musk’s renewed focus on Tesla vs. other ventures (DOGE, SpaceX) will be watched.
________________________________________
🚀 Refreshed Catalyst Rankings
Rank Driver Score
1 EV demand growth 9
2 Affordable model 8.5
3 Battery costs/margins 8
4 Autonomy/robotaxi execution 8.5
5 Competition 6.5
6 Trade & tariffs 6.5
7 Regulatory incentives 6
8 Commodities 5.5
9 Fed Rates 5
10 Musk reputation/governance 5
________________________________________
📊 Latest Analyst Ratings & Targets
• Benchmark / Mickey Legg: Buy, target $475 (from $350) — cites robotaxi safety-first rollout, automation upside
• Wedbush / Dan Ives: Outperform, target $500 — labels TSLA as an “embodied AI compounder”
• Morgan Stanley / Adam Jonas: Buy, target $410 — bullish on AI/self driving positioning
• Cantor Fitzgerald / Andres Sheppard: Overweight, target $355 — optimism rooted in robotaxi and FSD rollout
• UBS / multiple: Sell, target $215–225 — skeptical on demand and valuations
Consensus snapshot (FactSet):
• Mean price target ≈ $311–$312
• Mean rating between Hold–Buy (~2.7/5)
________________________________________
🗞️ Recent Headlines
• “Tesla completes first fully autonomous Model Y delivery ahead of schedule”
• “Tesla robotaxis launch in Austin” boosting momentum
• “EU Tesla sales slump” May registrations down 40.5%
• “Tesla fires longtime insider as Europe slump deepens”
________________________________________
🔍 Summary Outlook
Tesla shares are navigating a volatile interplay of strong tech promise and unfolding execution risks:
• Overweight view (Legg, Ives): Robotaxi rollout and AI thrust fuel upside. Automation transition seen as transformative.
• Bullish base (Jonas, Sheppard): AI, FSD rollout, affordable model support core thesis.
• Skeptical view (UBS, Tusk): Slumping deliveries in Europe/China, heavy valuation, Musk's external focus seen as emotional dampener.
Upcoming triggers to watch:
1. Q2 delivery and production results (mid July).
2. Robotaxi rollout execution/regulatory clearance.
3. Margin trajectory as costs evolve.
4. FSD reliability and expansion in new markets.
________________________________________
✅ What This Means for You
• Bull case: Robotaxi + AI momentum may drive TSLA back toward targets in the $475–500 range.
• Bear case: Weak deliveries, macro and competition pressures could cap shares or trigger pullback toward prior support ($330–350).
• Neutral: Watch near-term delivery and autonomy news to shape next move.
