TRUMP TRADE PLANLooking forward to accumulate trump in the grey zone. It will have massive pumps during the memecoin rally!
Lets see the price action in the grey zone and do some DCA.
Trumpcoin

TRUMP!!!Hello friends
Considering the good growth we had, you can see that the price could not continue the growth of the hood and it has fallen. Now it is suspected of a head and shoulders pattern. I repeat, it is suspected of a head and shoulders pattern. The pattern has not yet formed.
If the price breaks the designated resistance, the price can move to the specified targets and if the resistance is broken, I will update it for you.
*Trade safely with us*
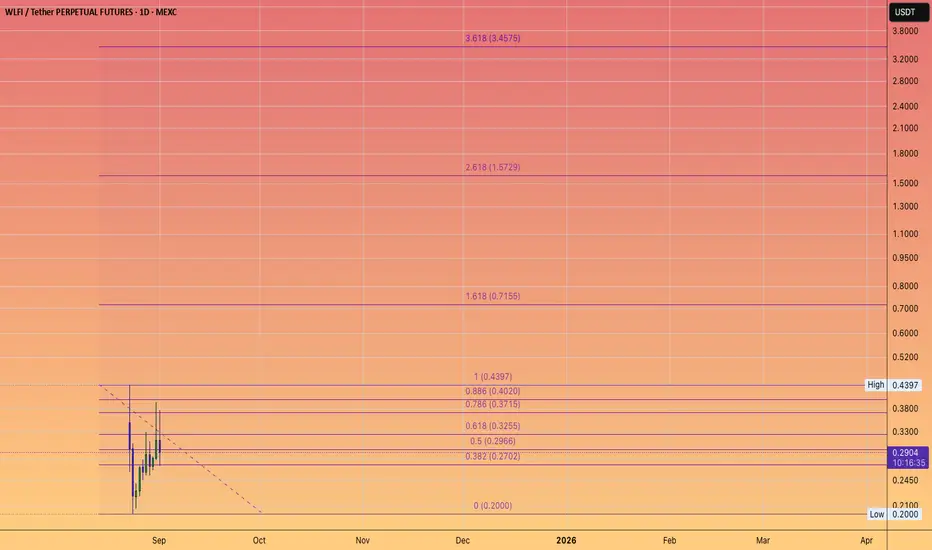
WORLD LIBERTY FINANCE HAS LAUNCHED!Will it kick off this Bull market into hyperdrive?
Here are the Fib extensions based on the Futures price action so far.
Can it break a dollar?
Has it cemented #ETHEREUM as the dominant layer 1 for serious money?
Whilst relegating #SOLANA to gen Z high speed casino?
We shall find out in the coming 6 months.
This Is Why TRUMP Price Didn’t Surge After Alaska MeetingBINANCE:TRUMPUSDT is currently trading at $9.17, holding above the support level of $9.04. This range-bound movement suggests that the price could continue consolidating between the $9.04 support and the resistance of $9.63. The market’s indecisiveness points to a period of low volatility.
However, if the outflows continue, BINANCE:TRUMPUSDT could fall through the $9.04 support and fall to the next support level of $8.43. This would extend the losses and put further downward pressure on the price, signaling a potential decline.
On the other hand, if BINANCE:TRUMPUSDT manages to flip the $9.63 resistance level into support, it could make its way towards $10.00 . This would require a change in investor sentiment, likely driven by renewed confidence in the asset's potential.

Jul 20 | Crypto-market reviewNew Crypto-Sunday market review video, where I share my current analysis on the trend structures of BTC, ETH, SOL, XRP, HYPE and other alt- and mem-coins of interest to my, highlighting key support and resistance zones to watch in the coming sessions.
Charts featured in the video
BTC
ETH
XRP
(!) SOL
(!) HYPE
(!) TRUMP
BRETT
(!) FET
RENDER (Weekly)
(!) DOG
(!) MOG
Thank you for your attention and I wish you happy Sunday and great trading week!
If you’d like to hear my take on any other coin you’re tracking — feel free to ask in the comments (just don’t forget to boost the idea first 😉)

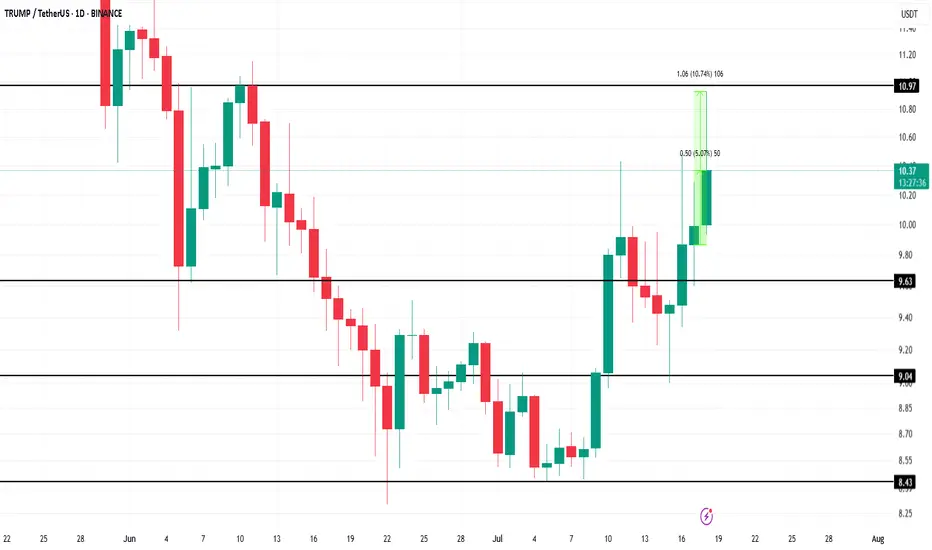
TRUMP Token's $950 Million Unlock Sparks Short-Lived Price RallyBINANCE:TRUMPUSDT recently saw its first major token unlock in six months, which flooded the market with fresh supply. The 90 million TRUMP tokens unlocked today are much smaller than the previous unlock in January, yet they still increased liquidity significantly.
However, the lack of response to the unlock, despite the substantial capital entering the market, further indicates a cooling of investor enthusiasm around the meme coin
BINANCE:TRUMPUSDT price rose by 5% today, trading at $10.39 at the time of writing. It briefly surged by 10% during the intraday high , but the rally was short-lived, and the price retraced.
If BINANCE:TRUMPUSDT fails to breach the $10.97 resistance level again, the coin could face potential corrections to $9.63 , making recovery difficult. The token will need strong demand to push past this resistance and secure more gains.
However, should BINANCE:TRUMPUSDT capitalize on broader market bullish momentum, it could break past $10.97 and reach $11.00 . This would likely invalidate the current bearish outlook and provide an opportunity for a further rise to $12.18.
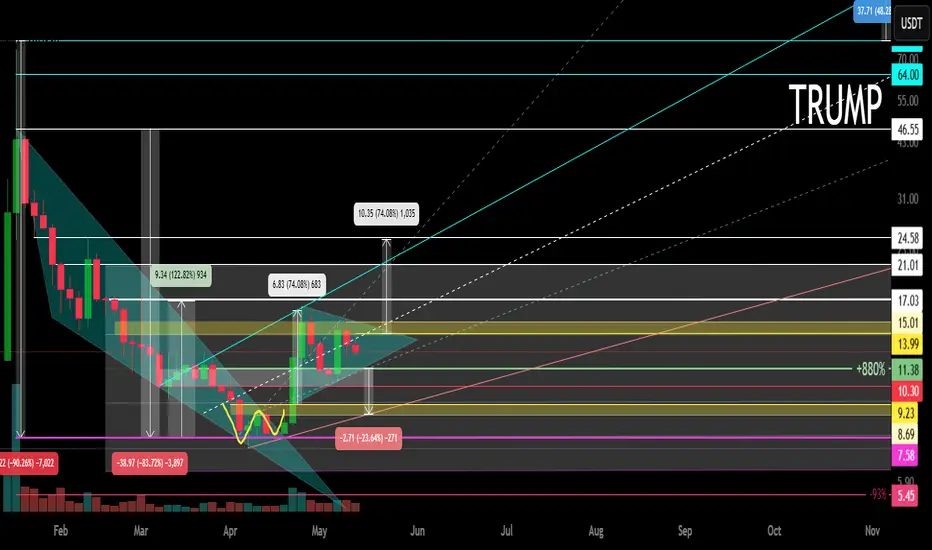
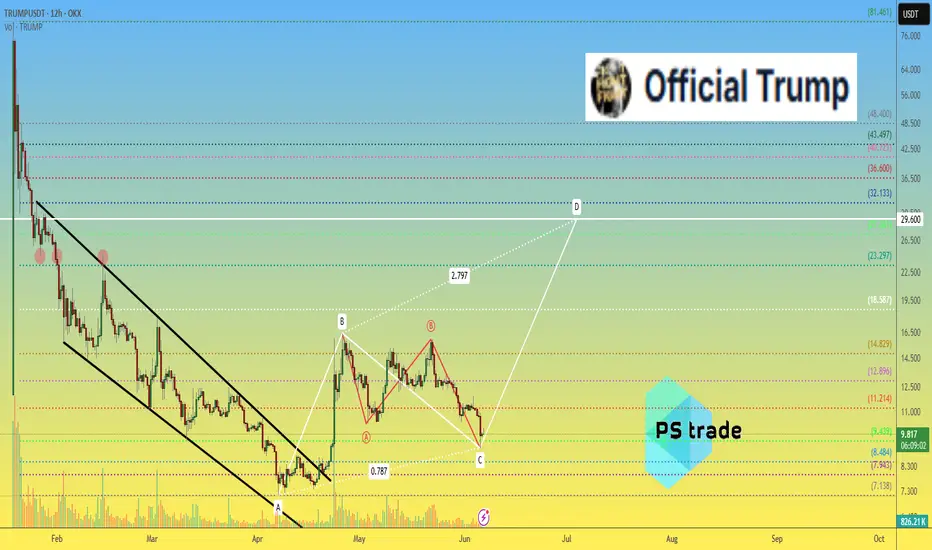
OFFICIAL TRUMP Main trend. 16 05 2025Logarithm. Time frame 3 days. After a super pump and a drive of "stupid money", a descending channel was formed on a natural dump. The price came out of it. Now a triangle is forming. The price is clamped. The reversal zones and percentages to the key support/resistance levels are shown extremely accurately according to TA.
If there is no aggressive exit in the medium term, then there will be consolidation and, as a consequence, the formation of a horizontal channel "sholtai / chattai", its key zones are shown.
Now, this "cryptocurrency" is now on 16 05 2025 in 41st place by capitalization.
Reductions from the price highs are about -90%.
From the liquid zone about -84%.
These are not the minimum values of the decline of such hype cryptocurrencies. Just take this into account in your money management. For clarity, the level zones and the % of potential decline if the trend breaks again are shown on the chart (pull the chart down).
Even with such a decline, the price is now at a huge profit. I am not speaking for the creators of the cryptocurrency, but for the first speculators and "investors" who may not have sold everything on the hype.
For the creators of the cryptocurrency, perhaps these are manipulators close to the Trump family, for them, any sale is super profit. But in order to sell, you need to maintain liquidity, and from time to time make interest in speculation and asset retention by investors, that is, do pumps and hype. Use this, and do not be greedy...
Levels and zones, pump/dump, which the price will "feel" are shown in advance. Click "play" on the chart and move the chart up. With a high degree of probability, the hype and pumping of the price of this cryptocurrency will be repeated, given the hype and the long term of the political figure whose name this cryptocurrency bears. Now it is a Trump dump, in the future it will become a Trump pump for some time.
Do not forget to sell on the next hype. If you understand that you are very greedy, and the news background affects you, then sell in parts, or use stop losses to protect profits.
There is no need to guess the minimums and maximums. It is important to know these zones, and have an acceptable average price, from the position of the trend, and its potential. It is regulated by the distributed entry volume (in advance) at potential reversal zones.
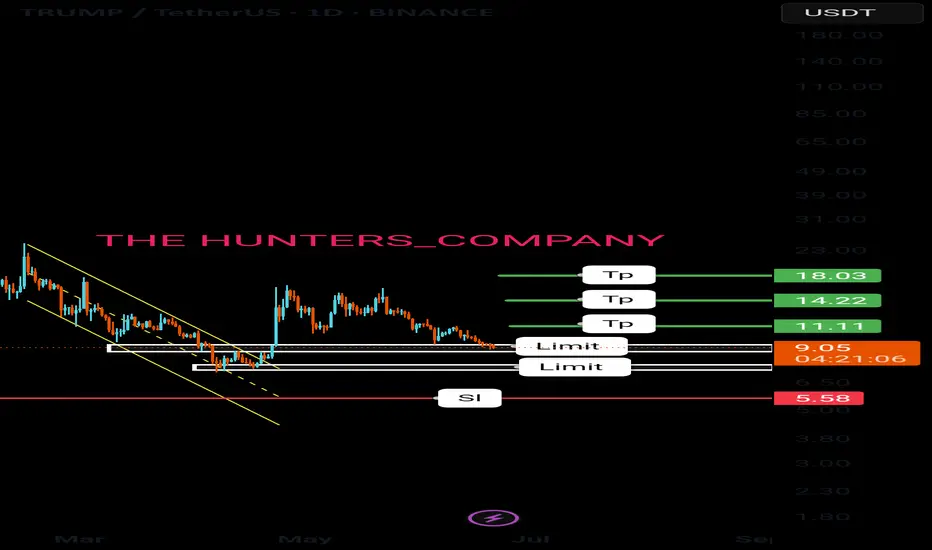
Trump's signalHello friends🙌
🔊Given the good growth we had, you can see that the price has hit resistance and you can see that the upward waves are getting weaker, which indicates that we are likely to have a correction until the support areas are identified...
You can buy in the identified support areas in steps and with capital management and move with it to the specified targets.
🔥Join us for more signals🔥
*Trade safely with us*

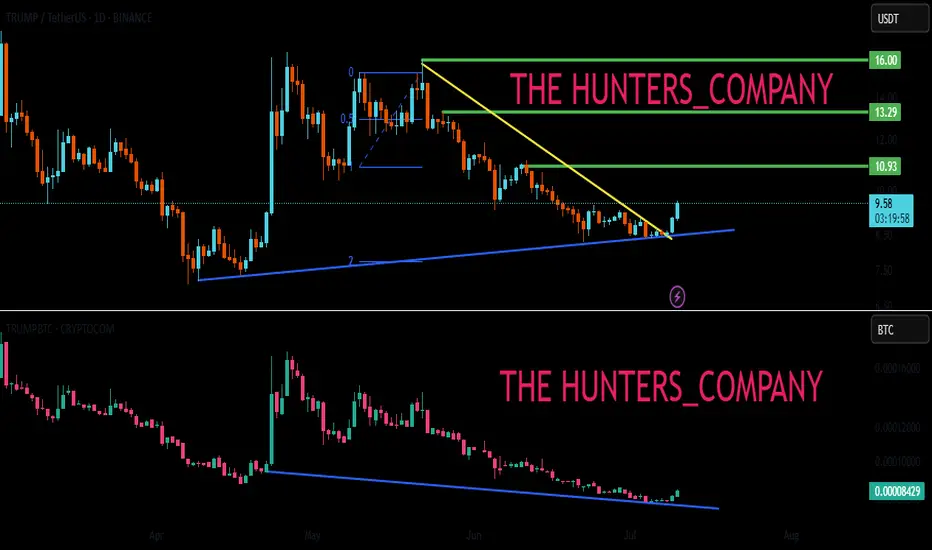
TRUMP BUY ???Hello friends🙌
🔊As you can see in the picture, we have brought you two Trump charts:
1_TRUMP/USDT, in which we see an upward trend.
2_TRUMP/BTC, in which we see a downward trend.
✔Now what is the conclusion? When this negative divergence occurs, it means that money flows from Bit to Tether, and we can expect good growth from it to the specified targets, given the price reaching important support and its return📈
🔥Join us for more signals🔥
Trade safely with us.
Trump:New update(don't miss it)hello friends👋
This time we came with the analysis of Trump's famous coin meme, which you requested a lot.
Well, as you can see, by making a double floor, the price has broken its downward channel and has grown well.
After the price growth, we saw the price suffering and then the price correction, which caused the formation of an upward pattern.
Now, according to the successful formation of this ascending pattern, it should be seen whether the buyers support the price in the specified support areas or not...
Pay attention that our trend is upward and the pattern made also shows an upward trend, that's why we have identified the support areas for you to enter the transaction step by step with risk and capital management.
🔥Follow us for more signals🔥
*Trade safely with us*
TRUMPUSDT In my opinion, we could still see a further 10% drop, considering the market’s cyclical nature — though it does feel like we’re near the bottom at this point.
Based on the indicators below, MACD and CCI are also showing signs of compression, similar to what we're seeing in the technical analysis.
Overall, I think by June 20th we’ll have a clearer picture of where the breakout from these triangle formations is headed

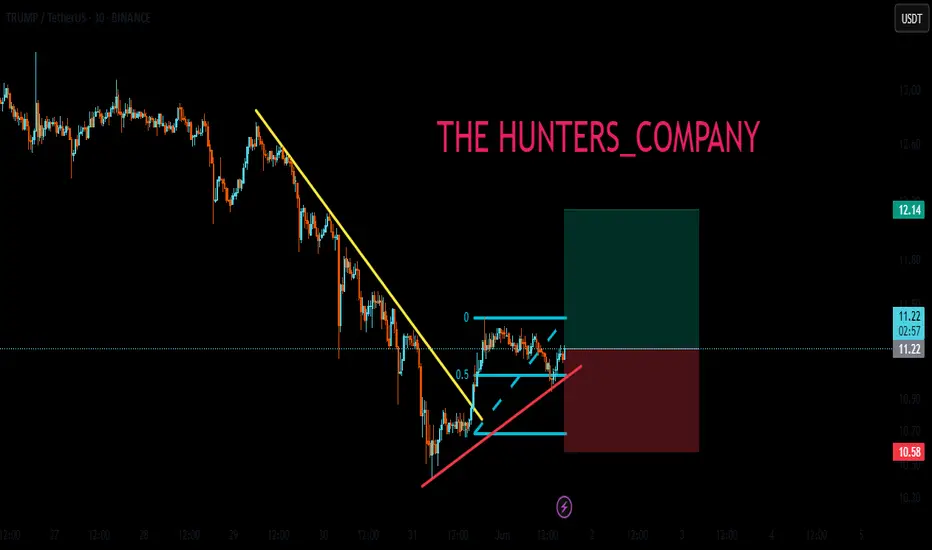
Live Trump TradeHello friends
Based on the analysis and research we have concluded that it is possible to enter into a transaction with risk and capital management, given the entry of buyers and the price pullback.
*Trade safely with us*
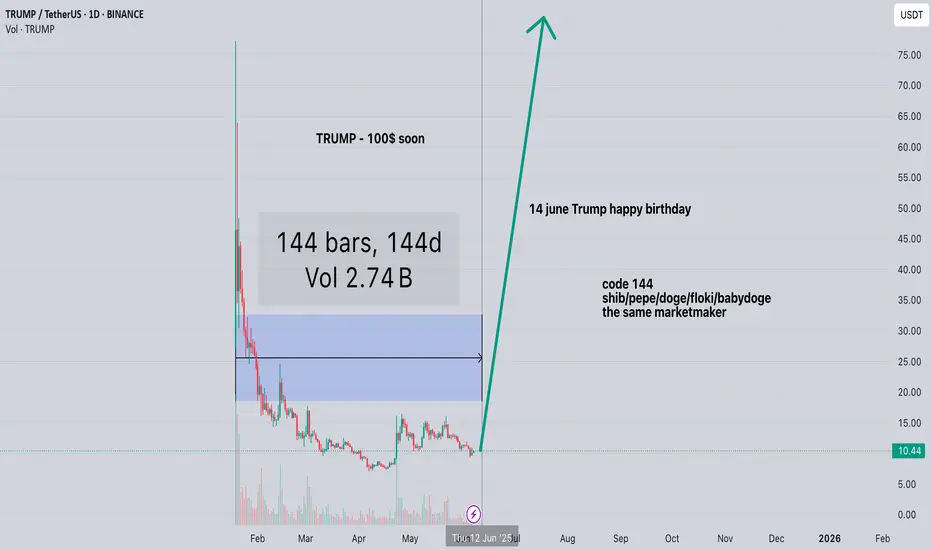
TRUMP to $100? Code 144 and Trump's Birthday I want to share my unique hypothesis, which no one has discussed before. I noticed an interesting pattern: on the 144th day after listing, a pump began for meme tokens like SHIB, PEPE, DOGE, FLOKI, and BABYDOGE.
I call this "Code 144" — and I believe the same scenario could repeat with the TRUMP token, especially considering June 14th is Donald Trump's birthday. This is the perfect media opportunity to trigger a FOMO wave, especially if it coincides with this critical 144th day.
📌 What’s important:
The same pump pattern on these coins' charts (possibly controlled by the same market maker);
TRUMP is currently in an accumulation phase;
The US election hype could amplify the effect;
I expect a pump near June 14th, as part of the "Code 144."
The target for TRUMP, based on this scenario, is $100 as a short-term spike due to the hype.
⛔ This is not financial advice, but my personal idea based on observing past cycles of meme tokens. I’m sharing it to document the hypothesis and check it against time.
TRUMPUSDT price analysis✊ It seems that the price of $Trump will only skyrocket when #Trump is impeached!
And we're keeping our fingers crossed that this happens as soon as possible... Mr. #Musk, you have nothing to lose — spill the beans!
As a Ukrainian classic wrote: “I gave birth to you — I will kill you.”
🕯 As for the price of OKX:TRUMPUSDT , it is moving very harmoniously and according to the canons of TA, regardless of who makes some “news throws” and does it on time or not.
And this is not surprising, as the crypto market titan Justin Sun has invested in it. His reputation is controversial, but he knows how to defend his “creations” and investments, pump them up, and make money on them.
So, it's purely hypothetical to assume that the price of $Trump will continue to rise, but this is by no means a call to invest in the red-haired jerk's coin. ✊
_____________________
Did you like our analysis? Leave a comment, like, and follow to get more
#TRUMP/USDT#TRUMP
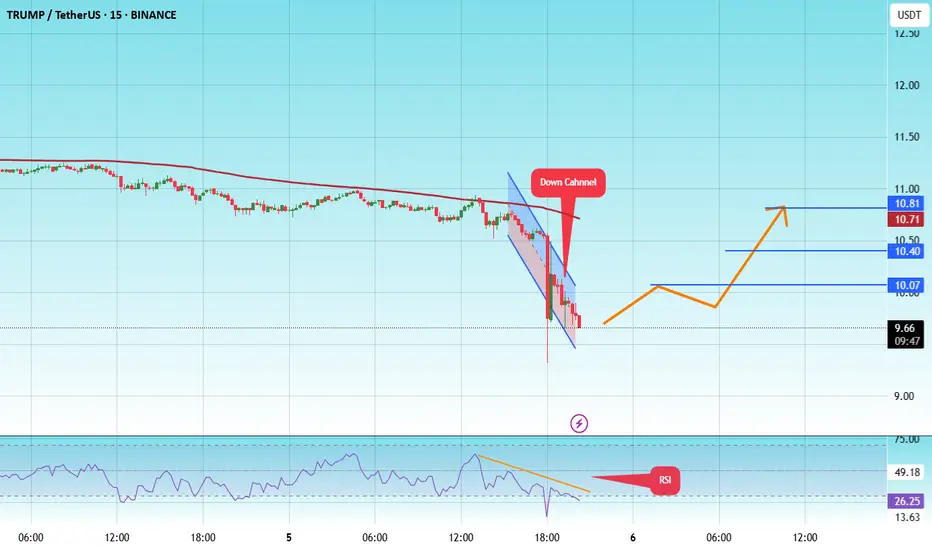
The price is moving within a descending channel on the 1-hour frame and is expected to break and continue upward.
We have a trend to stabilize above the 100 moving average once again.
We have a downtrend on the RSI indicator that supports the upward move with a breakout.
We have a support area at the lower boundary of the channel at 9.53, acting as strong support from which the price can rebound.
Entry price: 9.70
First target: 10.07
Second target: 10.40
Third target: 10.70
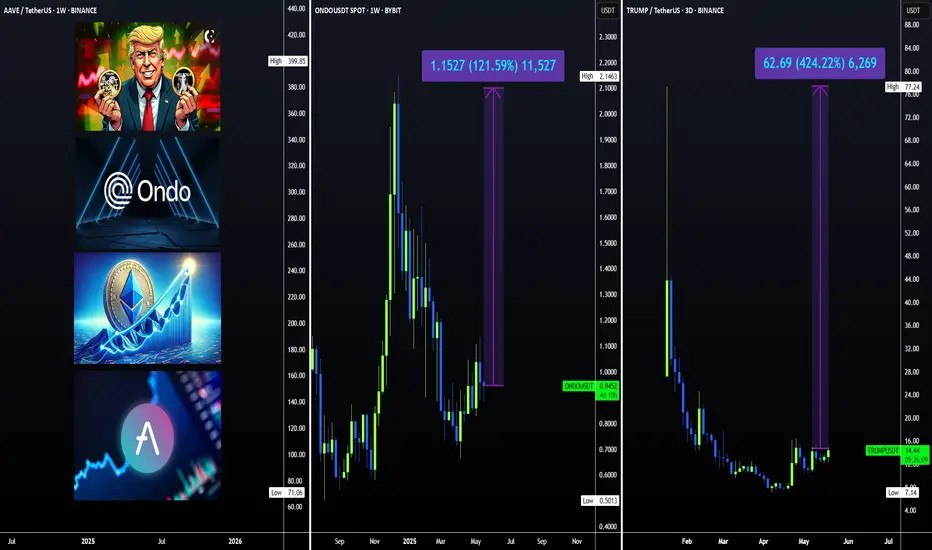
THESE ALTS can +100% | ALTSEASON PART2️⃣Altseason usually happens when BTC trades close towards a new ATH, as it is doing now, and takes some time to stall/trade sideways
Now this season is working a little differently. Usually ETH makes its way towards new highs, but we haven't seen that just yet. Ethereum has HUGE upside potential still.
It's hard to say just how high Ethereum can go, but what we do know is that it's still 88% away from the previous ATH, and due for a new one...
ENA is another alt with big upside potential, from it's previous peak its more than 200% away:
Solana has made a strong V-shaped recovery and if ETH is primed for new ATH, SOL is sure to follow:
TRUMPcoin may be memecoin, but the again so is PEPE! Still big upside after a long while of range trading here:
World Liberty Financial STABLECOIN | Everything YOU Need to KnowWorld Liberty Financial (WLFI), a DeFi lending protocol launched in 2024 and notably associated with the Trump family, is currently executing a key operational test for its new stablecoin, USD1.
This U.S. dollar-pegged stablecoin was introduced in March 2025 and backed by Treasuries and cash equivalents. It has already seen rapid adoption, surpassing $2.1 billion in circulation.
To validate their on-chain distribution systems ahead of a wider rollout, WLFI is conducting a test airdrop, proposing to send a small and fixed amount of USD1 to all existing $WLFI token holders on the Ethereum Mainnet. A governance vote on this proposal, set to conclude this Wednesday, May 14th shows overwhelming community support, with over 99.9% approval which is signalling confidence in the initiative's technical goals and community reward aspect.
Investors should note that while the vote seems assured, critical details like the exact USD1 amount per wallet and the precise airdrop date are yet to be announced, pending the vote's finalization. Also, WLFI retains discretion to modify or cancel this test distribution. This operational step occurs against a backdrop of significant scrutiny surrounding WLFI, stemming from its high-profile political connections, reported investigations, and potential conflicts of interest highlighted in various media outlet.
this test airdrop represents a practical infrastructure check and a community engagement tactic for WLFI as it builds out the ecosystem for its rapidly growing USD1 stablecoin. For current $WLFI holders, it presents a small token distribution contingent on final details announced after May 14th. For prospective investors, it's an operational milestone to observe, weighing the technical progress and market adoption of USD1 against the unique regulatory and political risks associated with the World Liberty Financial project.
____________
BYBIT:WLFUSDT
A bet on US geopolitical power I lomged trump some time ago. I won't say at what price but i think this will pump a bit today as the dinner snapshot approaches. Some normie influenzas are convincing their followers to short it into the snapshot but i think except for some minor corrections there will be no major crash to $8 or whatever. This token is slowly and steadily going to creep back up to $100 price. whenever trump solves global conflicts such as india-pakistan, ukraine- israel etc. It'll positively influence the price of this token. A bet on $trump is a bet on $trump's presidency. Whether he will prove to be a good president or not is upto you. Regardless, keks will be had.
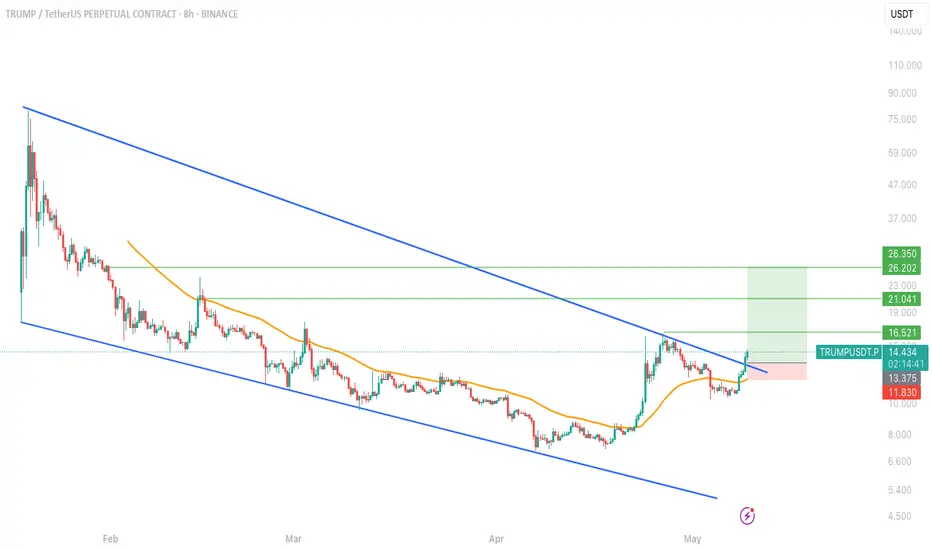
$TRUMPUSDT Breakout Alert!$TRUMP has officially broken above its descending trendline after holding firm support around $11.8. The price also reclaims the 100 EMA (orange line), signaling strength and potential for a trend reversal.
📈 Technical Highlights:
Downtrend breakout confirmed ✅
Retest of resistance turned support around $13.3 ✅
Targets in sight:
• TP1: $16.52
• TP2: $21.04
• TP3: $26.35
This breakout setup remains valid as long as TRUMPUSDT holds above $13.3. A clean trendline flip often leads to explosive follow-throughs.
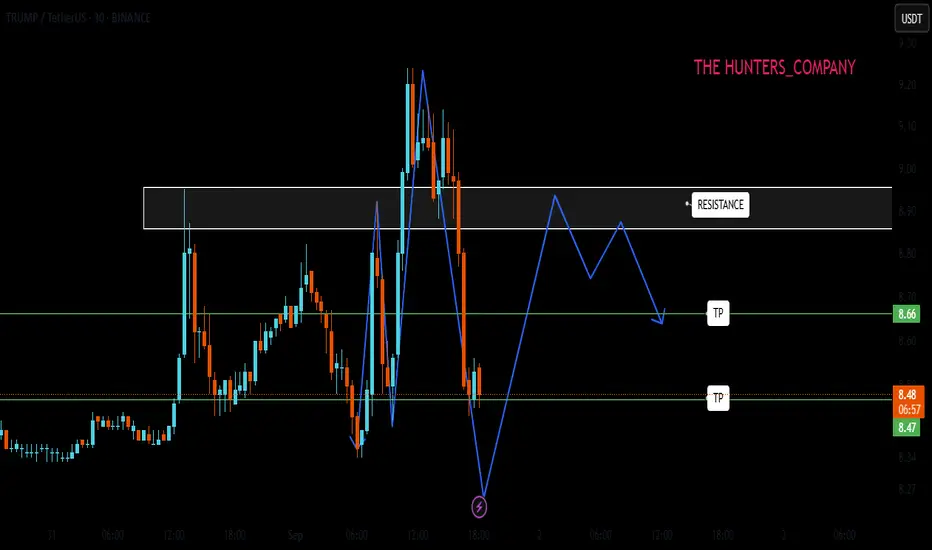
TRUMPUSDT LongTRUMP buy signal on M15 Timeframe. Triangle pattern was succesfully broken on bullish side. Now bullish target is 8.66 level, Risk reward 1/5. On higher TimeFrame bullish target is 9.4 level.

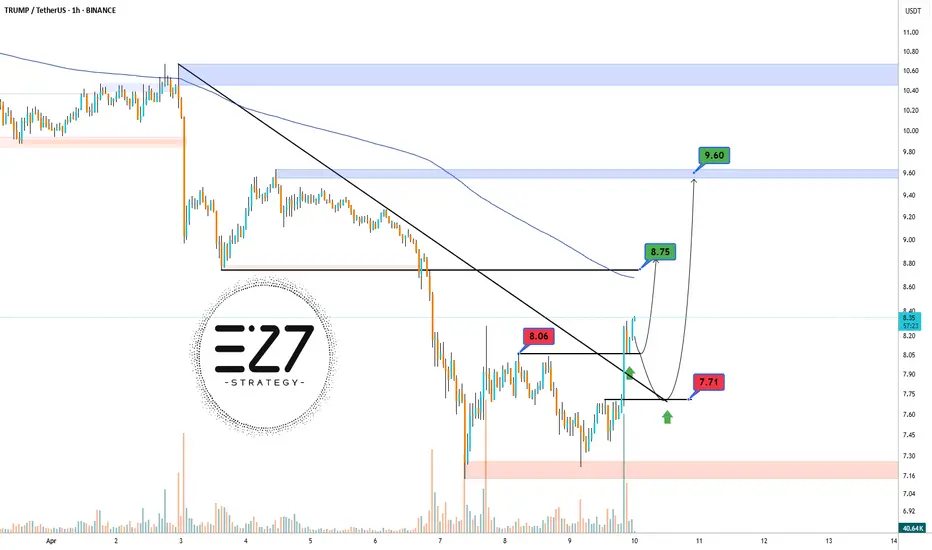
Trump token bullishKey Levels: The main resistance is at 10.40 dollars , and the main support is at 7.71 dollars . The descending trendline keeps the price below it, and the 200-period moving average above the price confirms the bearish trend .
Closer Zones: A nearby resistance is observed at 8.06 dollars, overlapping with the trendline. The closer support is at 7.71 dollars. A break above 8.06 dollars could push the price toward 9.60 dollars .
Intermediate Level: On the way up, the 8.25 dollars level acts as an intermediate resistance.
Target: Based on the previous move of 2.50 dollars, the potential upside target is around 9.60 dollars .
Conclusion: A breakout above the nearby resistance could signal a weakening bearish trend and the start of an upward move .
BTC/USDTBINANCE:BTCUSDT
CRYPTOCAP:BTC is respecting my levels perfectly 📈 88K target hit ✅
We’ve just tapped into a major resistance zone—so a short-term pullback could be on the table 📉⚠️
#Altcoins might see a bit of cooling off too, but if BTC manages a clean retest around the 85K–85.5K range, that’d be a bullish confirmation 📍
"Disclaimer : Not Financial Advice"

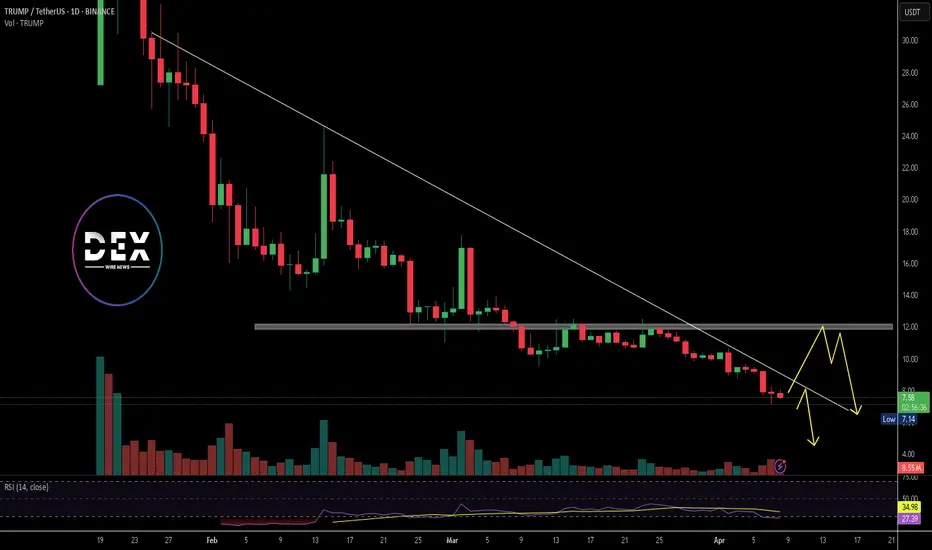
$TRUMP token Crumbles as Major Support Breaks, Is an ATL Next? TRUMP, the meme token inspired by former President Donald Trump, is currently priced at $7.52. The token has gained 5.03% in the last 24 hours. Its market capitalization stands at $1.5 billion, with a daily trading volume of $415.5 million, a drop of nearly 60.12% in the last 24 hours.
TRUMP was launched to commemorate Trump’s viral "FIGHT FIGHT FIGHT" moment in July 2024. That day, he survived a deadly incident and raised his fist in defiance. The moment triggered a movement that birthed this meme token. It symbolizes resilience and leadership, attracting thousands to its growing community. The token is now freely tradable on the blockchain, with increasing interest in both trading and long-term holding.
Technical Analysis: Price Faces Trendline Rejection and Heavy Resistance
TRUMP has been in a strong downtrend since reaching highs at $77. A descending trendline continues to cap upward moves, with the price breaking below key support at$12. Resistance is seen around the descending trendline and the horizontal support at $12. This level was previously a support and is now acting as a ceiling for price recovery. The daily RSI is currently at 27.19 indicating oversold conditions. This could trigger a short-term bounce toward $10–$12.
However, the trend remains bearish. The price has failed multiple times to break above the downtrend line. If the price breaks below $7 with volume, further drop could follow. A successful bounce might lead to a retest of $12.