#TRUMPUSDT — Breakdown or Reversal Confirmation🚀 BYBIT:TRUMPUSDT.P — Breakdown or Reversal Confirmation? Full Breakdown on 1H & 4H!
Let’s start by analyzing the charts on different timeframes:
✅ On the 1H chart , we clearly see a reversal pattern — Inverted Head & Shoulders — and the neckline breakout has already occurred. The volume on the breakout is high, which confirms the strength of the signal.
➡️ The target for this pattern is around $10.75–$10.80, which also aligns with the upper VPOC level from the previous range.
➡️ The POC level for BYBIT:TRUMPUSDT.P is $10.159, which may now act as support — this can be a potential entry zone.
➡️ Nearest resistance is at $10.40. A breakout above this level could trigger an impulse move towards $10.75–$10.80.
✅ On the 4H chart , a bearish flag is forming, which could potentially push the price lower — but this scenario hasn't played out yet.
➡️ There's also a local double bottom, confirmed by a price bounce. A retest of the flag’s lower boundary will be a key moment.
Let’s break down the patterns:
✅ 1. Inverted Head & Shoulders (1H) – A classic bottom reversal formation.
➡️ The neckline breakout occurred on increased volume — a key confirmation for a long setup.
✅ 2. Volume (Volume Profile & Bars) – Strong volume spike during the breakout confirms buyer interest.
✅ 3. Price broke out of consolidation – We’ve seen an impulsive breakout and the price is holding above the neckline.
✅ 4. Local Market Structure Break (MSB) – A shift from local downtrend to an emerging uptrend.
📍 Key Point: If the price holds above $10.40, this confirms a breakout from the descending channel, increasing the chance of reaching $10.75–$11.00.
📍 Price must also stay above $10.15 and not fall back into the previous range. A retest and bounce from this level would serve as further confirmation.
📢 If the price drops back below $10.15 and breaks $9.87, the “Inverted Head & Shoulders” pattern will be invalidated. In that case, a bearish trend will likely resume and a short toward $9.50–$9.00 could be considered.
📢 On the 4H chart, the risk of the bearish flag playing out still remains. We are monitoring the structure closely — a sharp pullback is possible.
📢 The volume zone around $10.15–$10.20 is key. As long as the price stays above it — the long scenario remains dominant.
🚀 As of now, BYBIT:TRUMPUSDT.P has strong technical reasons to support a long bias, especially if it holds above $10.40 — that would open the door to $10.75–$11.00.
Risks remain — particularly around the 4H bearish flag — but for now, bullish momentum prevails.
🚀 BYBIT:TRUMPUSDT.P still holds upside reversal potential — LONG scenario remains the priority!
Trumpcoin

Official Trump price analysis$Trump coin will probably only go off when and if Trump wins the Nobel Peace Prize. And for this to happen, his activities and rhetoric must change completely... at the moment, it looks "on the verge of fantasy."
Meanwhile: A major investor lost money on TRUMP again - this time $3.3m, he sold 743,947 TRUMP for $7.92m, but did so at a loss.
The irony is that at the very beginning of trading this token, he earned $11.82 million. However, a series of unsuccessful trades resulted in serious losses - now his total loss on $TRUMP has reached $15.7 million.
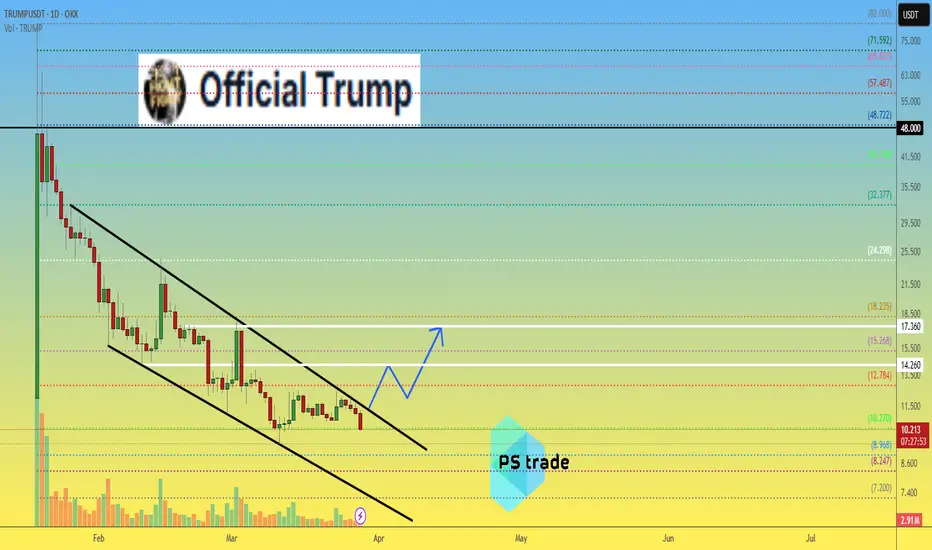
1️⃣ If by some miracle OKX:TRUMPUSDT manages to break out above the trend price, then we can dream of $14.26 and $17.36
2️⃣ А if, again, he writes, or says, or does something stupid, which is more likely for this personality.... then #Trump at $7-7.2, why not.
Ten times less than the highs... that's where the success is!)
Breaking: $TRUMP Token Dips 10% Reverting to $10 ZoneThe price of OFFICIAL TRUMP coin ($TRUMP) tanked 10% today, falling back to the $10 region. The asset ever since peaking to an all time high of $76, faced insane selling pressure losing about 80% of total value together with its compatriot $MELANIA coin.
For Weeks now, $TRUMP has been circumventing in the $10- $12 zone albeit the crypto market was most of the time in a bloodbath season. For $TRUMP coin, should the bulls push the token above the 38.2% Fibonacci retracement point, that may be the catalyst the token needs to spark a bullish renaissance as hinted by the Relative Strength Index (RSI) at 30- pointing at the disparity $TRUMP has to capitalise and make a bullish move.
Similarly, the 1-month low is serving as support point for $TRUMP should extreme selling pressure push the token lower.
OFFICIAL TRUMP Price Live Data
The live OFFICIAL TRUMP price today is $10.21 USD with a 24-hour trading volume of $517,239,338 USD. OFFICIAL TRUMP is down 8.71% in the last 24 hours. The current CoinMarketCap ranking is #45, with a live market cap of $2,041,294,317 USD. It has a circulating supply of 199,999,430 TRUMP coins and a max. supply of 999,999,993 TRUMP coins.

TRUMP/USDT:BUY LIMITHello friends
Given the price growth, now that the price is correcting, you can buy in steps and be careful to ensure that capital management is followed.
*Trade safely with us*
TRUMP(UPDATE)Hello friends
Given the good price growth, now in the pullbacks that the price makes, we can buy in the specified support areas and move with it to the specified targets.
Of course, with capital and risk management...
*Trade safely with us*
Just In: $TRUMP Dips 5% Down to $10.86 Pivot Trump token a coin created in the start of the year 2025 that saw a noteworthy uptick surging from a low of $3 to almost $80 dips 5% today retracing to the $10.888 support point amidst general crypto landscape.
The 78.6% Fibonacci retracement point is acting as support point for $TRUMP a break below that level could lead to the 1-month low axis as the RSI is weak presently at 37.
Similarly, a break above the 38.2% Fibonacci retracement point could spark a bullish reversal move or a temporary reprieve albeit the crypto market is volatile at the moment.
OFFICIAL TRUMP Price Live Data
The live OFFICIAL TRUMP price today is $10.84 USD with a 24-hour trading volume of $476,149,181 USD. OFFICIAL TRUMP is down 5.55% in the last 24 hours, with a live market cap of $2,167,125,027 USD. It has a circulating supply of 199,999,527 TRUMP coins and a max. supply of 999,999,993 TRUMP coins.

#TRUMP/USDT#TRUMP
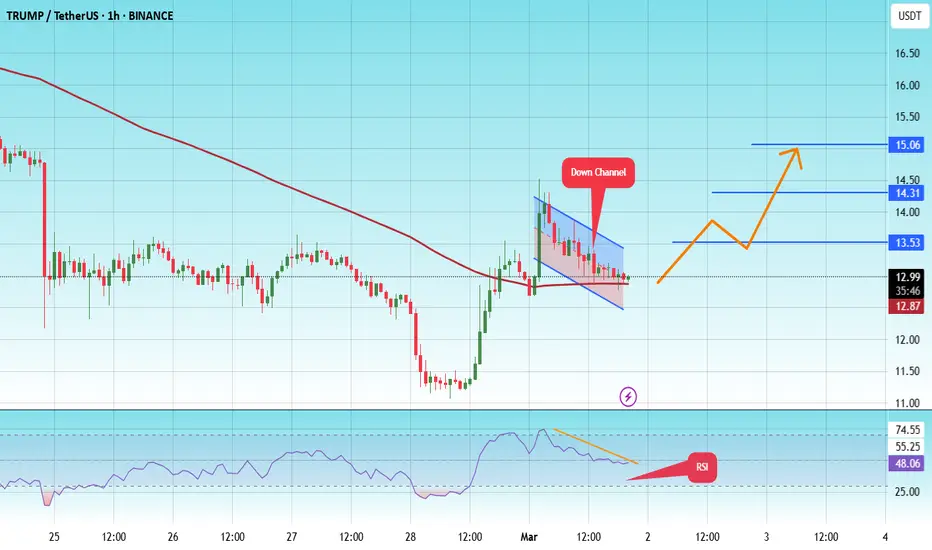
The price is moving in a descending channel on the 1-hour frame and is expected to continue upwards
We have a trend to stabilize above the moving average 100 again
We have a descending trend on the RSI indicator that supports the rise by breaking it upwards
We have a support area at the lower limit of the channel at a price of 12.50
Entry price 13.00
First target 13.53
Second target 14.31
Third target 15.06
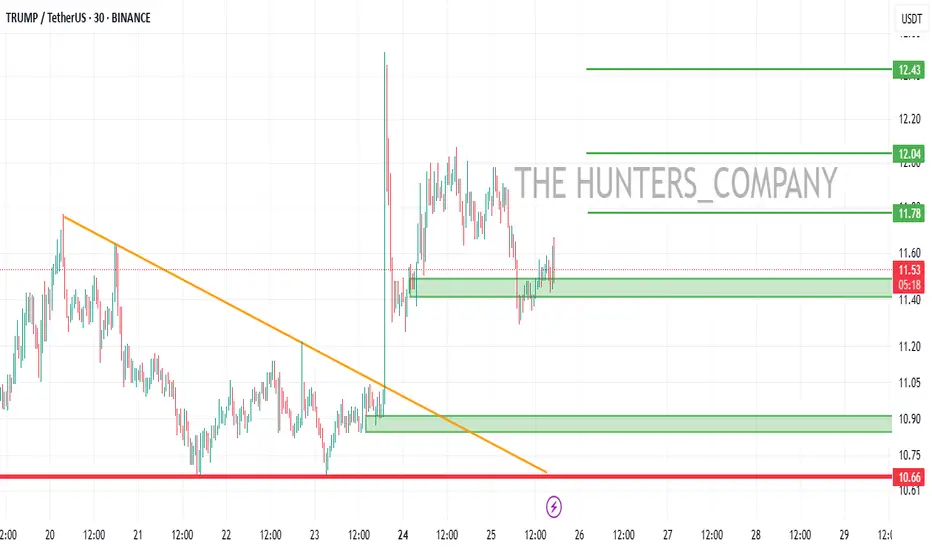
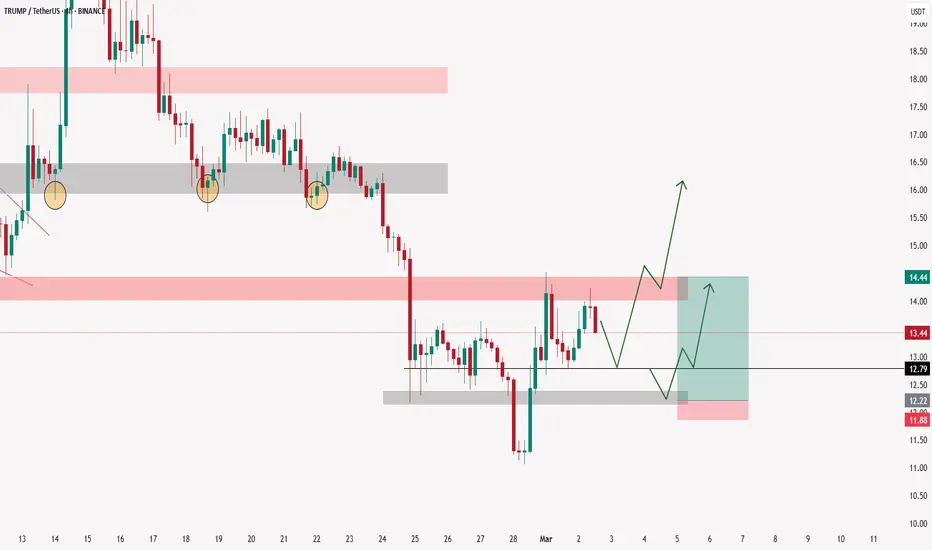
TRUMP COIN NEXT POSSIBLE MOVES AND TRADE IDEAS !!$TRUMP Coin Update & Possible Moves!!
• Two Support areas are marked on chart 12.80$-12.30$ where you are able to build trade on it🫡
Warning : That's just my idea if i take trade i will Update.. DYOR Before Taking any action🚨
D
$TRUMP Coin on the Verge of a Major Breakout: Can It Reach $30?The cryptocurrency market is buzzing with excitement as $TRUMP coin approaches a critical resistance level. Currently trading near $17, the token has already broken a significant Break of Structure (BOS), hinting at a potential bullish surge. If $TRUMP successfully breaches this resistance point, technical indicators suggest a remarkable 200% rally, pushing the price toward $30.
Technical Analysis
A closer look at $TRUMP’s daily chart reveals key bullish signals:
The $17 mark has proven to be a significant resistance level. A confirmed breakout could trigger a strong uptrend, with $30 as the next major target. The Relative Strength Index (RSI) is currently at 48, indicating neutral momentum. However, with buying pressure increasing, RSI could soon move into the bullish zone, reinforcing the uptrend.
The token's recent candlestick formations suggest a bullish engulfing pattern, which often precedes a strong rally. The $11 price point has emerged as a crucial support level. If this level holds, bulls could maintain momentum. However, a break below $11 may lead to a strong sell-off.
Trump Organization’s Metaverse & NFT Plans
The Trump Organization has officially filed a trademark application for 'TRUMP' to launch a metaverse and NFT trading platform. This development aligns with the growing trend of Web3 adoption by prominent figures and institutions.
A metaverse and NFT ecosystem tied to the Trump brand could significantly increase interest in $TRUMP coin, driving speculative demand and institutional involvement. If the project gains traction, it could serve as a major long-term growth factor for the token’s valuation.
What’s Next for $TRUMP Coin?
With both technical and fundamental indicators aligning, $TRUMP coin is at a pivotal moment. The key level to watch remains the $17 resistance. A decisive breakout could ignite a major rally toward $30, while failure to hold above support at $11 might trigger a correction.

#TRUMPUSDT – Bearish Scenario, Expecting a Downward Breakout📉 SHORT BYBIT:TRUMPUSDT.P from $12.492
🛡 Stop Loss: $12.785
⏱️ 1H Timeframe
⚡️ Trade Plan:
✅ The BYBIT:TRUMPUSDT.P price continues to decline after a recent sharp drop.
✅ The chart shows that the asset is consolidating below POC (Point of Control) at $13.105, indicating seller dominance.
✅ The price is testing a support level, and a breakdown could trigger a stronger bearish move.
🎯 TP Targets:
💎 TP 1: $12.305
🔥 TP 2: $12.110
⚡️ TP 3: $11.966
📢 A close below $12.492 would confirm the downward move.
📢 POC at $13.105 is a key volume area that now acts as resistance.
📢 Increasing volume on the decline supports the bearish trend.
📢 Securing partial profits at TP1 ($12.305) is a risk-management strategy.
🚨 BYBIT:TRUMPUSDT.P remains under pressure – monitoring for a confirmed breakdown and securing profits at TP levels!

TRUMP - LONGRisky trade on TRUMP, it should bounce in these areas. I don't recommend using too much capital. Protect the trade soon.

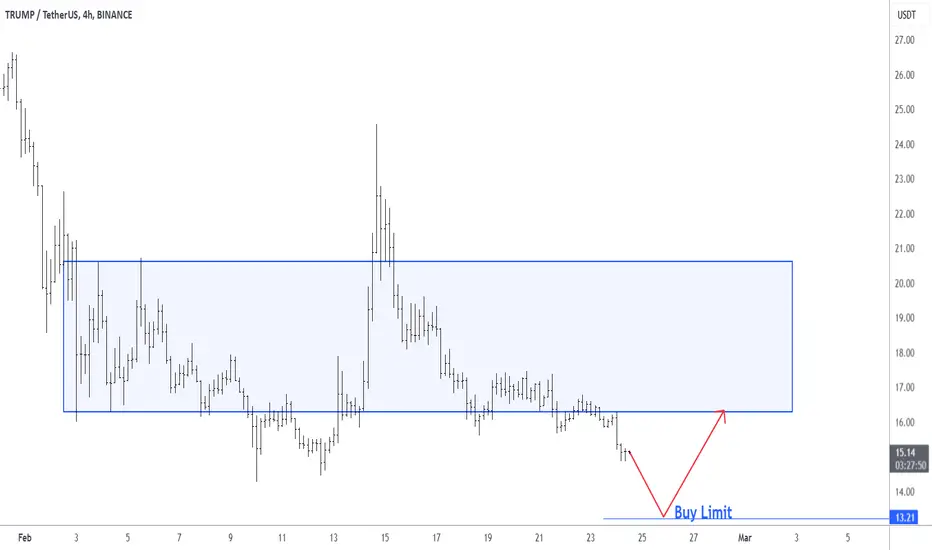
TRUMPUSDT Buy LimitTrump Coin has a signal at the 13.2 level. A buy limit order can be placed at this level for a long-term position. The current consolidation range is between the 16 and 20.5 levels, and it is likely that the price will return inside this consolidation range after a retest of the 13.2 level.
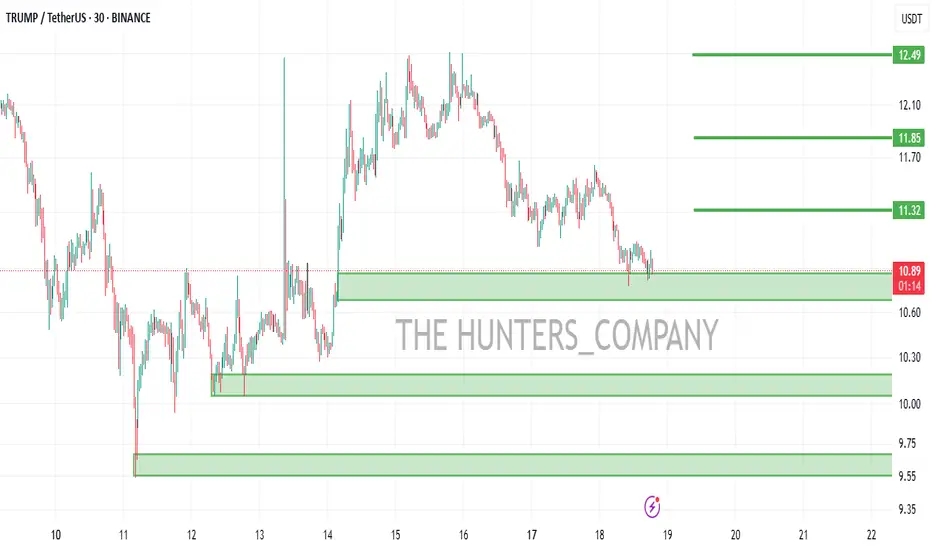
TRUMP COIN PRICE PREDICTION AND POSSIBLE TRADE SETUP !!$TRUMP Coin Update!!
• Near me buyer's are still interested in $TRUMP Coin...
•And i am bullish on it until its trading now above 16$.
• Possible trade ideas are clearly mentioned on a chart.
• First setup is little bit risky so don't use high fund if you build trade on it...
Warning : That's just my analysis DYOR Before taking any action🚨

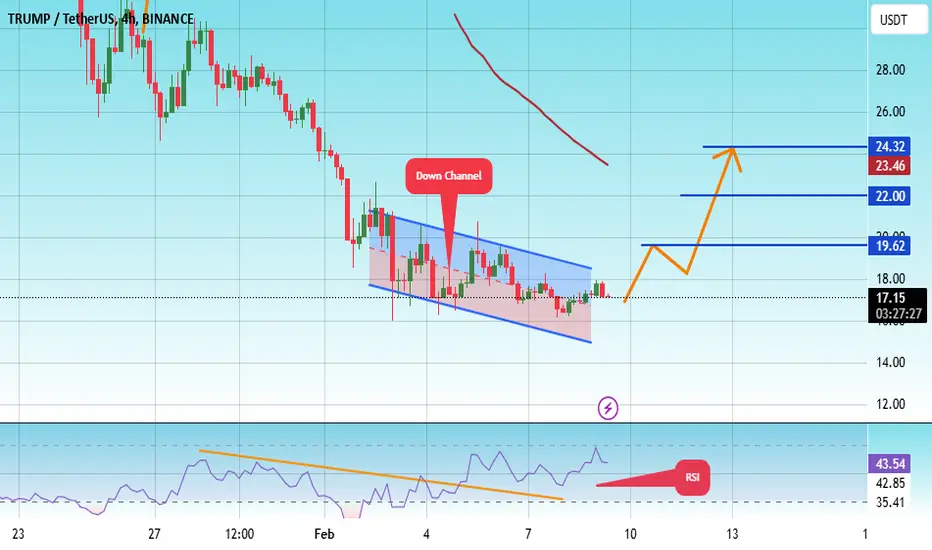
#TRUMP/USDT#TRUMP
The price is moving in a descending channel on the 1-hour frame and is adhering to it well and is heading to break it strongly upwards and retest it
We have a bounce from the lower limit of the descending channel, this support is at a price of 15.35
We have a downtrend on the RSI indicator that is about to break and retest, which supports the rise
We have a trend to stabilize above the Moving Average 100
Entry price 17.14
First target 19.62
Second target 22.00
Third target 24.32
TRUMP/USDT BACK TO $20?Trump showing on a low time frame new uptrend volume, This volume can build a new low time target for Trump as $20 USD +
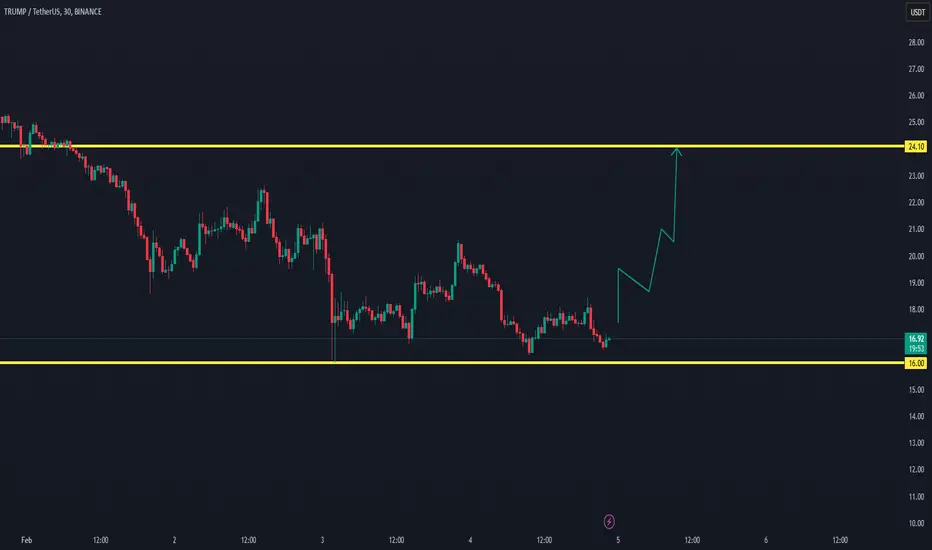
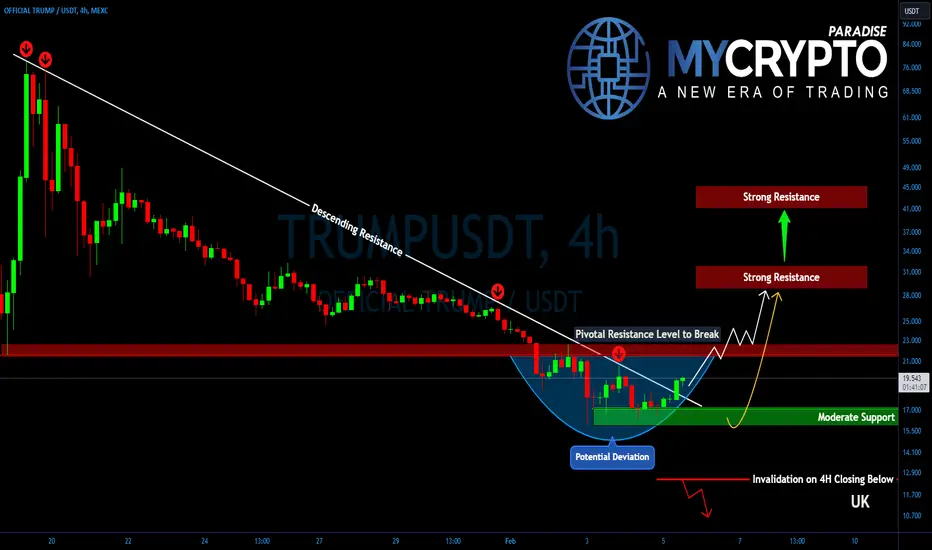
Is TRUMPUSDT Ready for a Major Breakout?Yello, Paradisers! After an extensive downtrend, #TRUMPUSDT is finally showing signs of life, breaking above its descending resistance. Could this be the start of a powerful move higher? A potential deviation pattern is forming, which might act as a trigger for upside momentum—here’s what you need to know.
💎#TRUMP is now approaching a critical resistance zone between $21.20 and $22.80—this is the level that needs to be breached for bulls to take full control. A clean breakout here could send TRUMP soaring toward the $29.50 - $30.50 region, where the first significant resistance awaits. Some profit-taking is expected at this level, so bulls need to push with conviction.
💎Moreover, if buyers can overwhelm the $30.50 zone, TRUMP could enter a massive rally toward $40 - $44, where the 50% Fibonacci resistance sits. This is a major level that demands caution, as it has the strength to trigger a reversal.
💎On the downside, TRUMP is establishing a solid support zone at $17.00 - $16.15. If this level holds in the next few hours, bulls could launch a strong push higher. This zone has already absorbed selling pressure, making it a key area for bulls to defend.
Paradisers, as always, patience and precision are key in this market. This isn’t a time for reckless trades—let the levels guide you, trade strategically, and stay disciplined.
MyCryptoParadise
iFeel the success🌴
TRUMP coin dropped 77% as i warned youTRUMP coin dropped 77% as i warned you
what should we do the next??

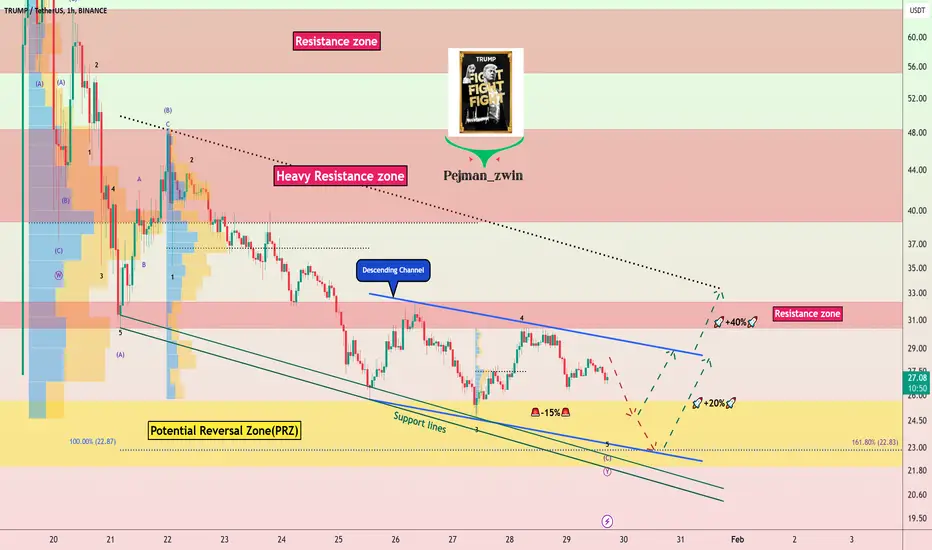
TRUMP Token Analysis: Is This Best Buy Zone Before a +40% PUMP!?Today, I decided to re-analyze the OFFICIAL TRUMP token( BINANCE:TRUMPUSDT ) for you; if you want to have the TRUMP token in your portfolio, in what range can you buy this token, and at what prices can you sell it with a profit or even prevent further loss?
TRUMP Token started correcting after all the hype, after the news of the launch of the Official Melania Meme token ( BINANCE:MELANIAUSDT.P ) and has dropped more than -60% from its All-Time High(ATH) .
TRUMP Token is moving near the upper line of the descending channel and the Resistance zone($32-$30) .
According to the theory of Elliott waves , the TRUMP token seems to be completing microwave 5 of microwave c of the main wave Y . The main wave Y could end in a Potential Reversal Zone(PRZ) and be another opportunity to buy TRUMP Token , of course, with capital management in mind .
I expect the TRUMP token to start rising again after the -15% decline from the close of the lower high line of the descending channel and the Support lines and at least a +20% increase .
Note: Of course, the FOMC Statement, Federal Funds Rate decision, and Press Conference can affect the general trend of the crypto market and the TRUMP token.
Note: If the TRUMP token goes below $22.00, there is a possibility that the fall will continue.
Note: However, concerns have been raised about supply concentration, with 85% of the tokens controlled by Trump's team, who have reportedly liquidated approximately $500 million worth of tokens. This situation poses potential risks for retail investors.
What do you think about the TRUMP token? Can the TRUMP Token rise again, or is it forming a Dead Cat Bounce Pattern ?
Please respect each other's ideas and express them politely if you agree or disagree.
OFFICIAL TRUMP Analyze (TRUMPUSDT), 1-hour time frame.
Be sure to follow the updated ideas .
Do not forget to put Stop loss for your positions (For every position you want to open).
Please follow your strategy and updates; this is just my Idea, and I will gladly see your ideas in this post.
Please do not forget the ✅' like '✅ button 🙏😊 & Share it with your friends; thanks, and Trade safe.
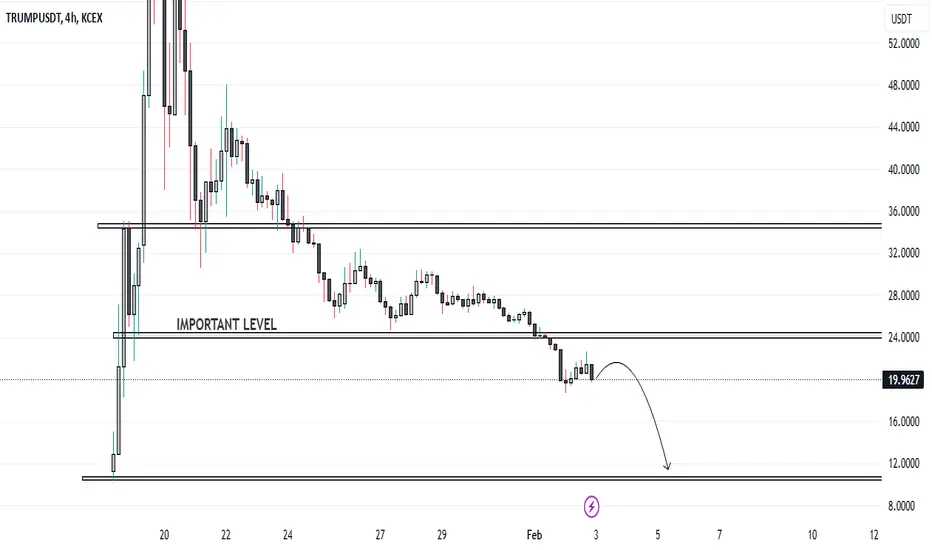
Trump Coin Falls Below Key Level – Time for a Short Trade...?TRUMP coin has recently dropped below the significant threshold of $24, indicating a potential bearish trend. This decline may be exacerbated by the intensifying global trade tensions involving major economies such as the USA, Canada, China, and Mexico. As these nations engage in escalating trade disputes, the resulting uncertainty could increase market selling pressure. Traders and investors should exercise caution and closely monitor market developments, as fluctuations may continue amid these geopolitical challenges.
Mr.Million | $TRUMP Chart Update and my current holdingI shared recently why I was long on $TRUMP and purchased $500k worth!
I am liking how this chart is unfolding – Why? The slopes of the trendlines (in white) are getting less and less negative!! 🔥
I will be DCAing ($500k per buy) until I build my full $5M position. So, personally I wouldn’t mind $TRUMP dipping further!
⚠️ Only buy on dips! If it rips, stop averaging down and let it fly. 🚀 💸

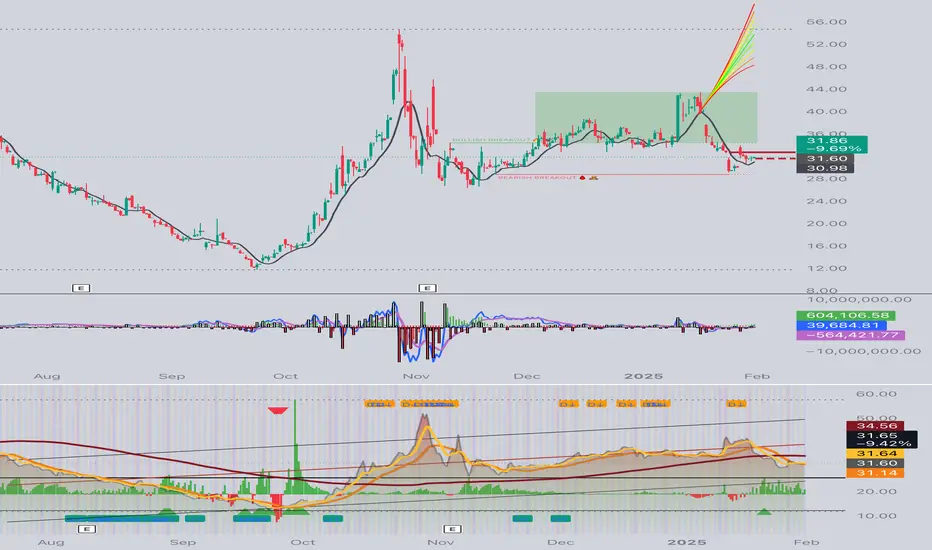
I THINK SHE’S BULLISH
LOOKS LIKE THERE IS GOOD SUPPORT AROUND $31 range AND COULD PUSH 39-49 RANGES SOON.
CALLS ABOVE $34.50
PUTS UNDER $30.00
THE CHART ABOVE IS 4HRS 🐦⬛
TRUMPUSDT – Ready for a Rebound or Further Decline?Key Moment for TRUMPUSDT: Buy Signal or Last Warning?
The market is at a crossroads, and TRUMPUSDT is no exception. Currently trading at $24.179, this asset has plummeted over 70% from its all-time high of $83.041, recorded just 13 days ago. Such a steep decline begs the question: is this the moment of capitulation, or the perfect time to buy the dip?
Technicals indicate oversold conditions. RSI(14) at 30.9 signals that sellers may be exhausting their momentum, while MFI(60) at 38.1 suggests a potential inflow of smart money. However, the price remains below key moving averages (MA50 at $26.29, MA100 at $27.26, and MA200 at $28.47), meaning a breakout is needed to confirm a trend reversal.
Recent patterns show a battle between bulls and bears. Yesterday's heavy selling pressure pushed the price near its key support at $21.08, but today’s increased buy volume hints at possible accumulation. Resistance stands firm at $26.09—a level that, if broken, could trigger a short squeeze toward higher targets.
The market is offering a challenge: is this the bottom, or will we test lower levels before a major recovery? Will you seize the opportunity, or wait for confirmation?
Roadmap: TRUMPUSDT – A Pattern-Based Guide to Market Moves
1. The Beginning of a Trend – The Sell-Off Cascade
2025-01-27 15:00 UTC – VSA Manipulation Sell Pattern 2nd
Main Direction: Sell
The market signaled a significant downward shift as sellers took control. A confirmation of this bearish movement came shortly after, when price failed to hold support and started a cascade of lower highs.
2025-01-27 16:00 UTC – VSA Manipulation Sell Pattern 1st
Main Direction: Sell
Confirmed the earlier trend as price continued declining, closing below its open and reinforcing downward pressure. This movement set the stage for an even sharper fall.
2025-01-28 00:00 UTC – Increased Buy Volumes
Main Direction: Buy
Despite a temporary buy-in, price action in the following pattern suggested that this was a weak bounce. The asset managed to push upwards but failed to break out significantly, signaling an overall bearish trend remained dominant.
2025-01-28 03:00 UTC – VSA Manipulation Sell Pattern 2nd
Main Direction: Sell
This sell-off confirmed the weakness of the previous buy attempt. The price declined further, aligning with the broader trend, proving that the sell signals were valid.
2. Bullish Recovery: The Market Fights Back
2025-01-29 14:00 UTC – VSA Manipulation Buy Pattern 1st
Main Direction: Buy
This marked the first major attempt at a bullish reversal. The price started to climb, breaking through short-term resistance zones and attracting momentum traders looking for long positions.
2025-01-29 19:00 UTC – Increased Sell Volumes
Main Direction: Sell
Despite bullish attempts, sellers made a strong comeback, leading to another test of support. However, this time, price action suggested exhaustion among sellers.
2025-01-29 20:00 UTC – Sell Volumes Takeover
Main Direction: Buy
Contrary to its name, this pattern actually set up a bullish movement as buyers absorbed sell pressure and pushed prices higher, leading to a confirmation of a bullish trend.
3. The Confirmation Rally
2025-01-30 05:00 UTC – VSA Manipulation Sell Pattern 3rd
Main Direction: Sell
A minor pullback tested the bullish momentum. However, the next sequence revealed that this sell pattern failed to hold, invalidating its significance in the broader market trend.
2025-01-30 13:00 UTC – VSA Manipulation Buy Pattern 4th
Main Direction: Buy
The bulls took full control. A steady price increase confirmed the direction, marking this as a key turning point in the market.
2025-01-30 20:00 UTC – VSA Buy Pattern Extra 1st
Main Direction: Buy
An explosive breakout followed, pushing price action toward a critical resistance level. This confirmed the accumulation phase was over, and a potential bullish continuation was on the horizon.
4. The Final Surge and Market Indecision
2025-01-31 00:00 UTC – VSA Manipulation Buy Pattern 5th
Main Direction: Buy
This was the strongest bullish confirmation yet, as price rallied past key resistance levels and settled in an uptrend.
2025-01-31 07:00 UTC – VSA Manipulation Sell Pattern 1st
Main Direction: Sell
This pattern hinted at a potential reversal, but the market held its ground, suggesting that bullish strength was still dominant.
2025-01-31 09:00 UTC – VSA Manipulation Buy Pattern 3rd
Main Direction: Buy
Final confirmation of an ongoing rally. The price established a higher low, creating a structure that traders could use as a base for further upside moves.
Conclusion: Where Does TRUMPUSDT Go Next?
The roadmap reveals a key transition from a strong bearish phase to a confirmed bullish reversal. With increased buy volumes and multiple successful bullish confirmations, the asset is now poised to challenge resistance levels. However, traders must remain cautious, as future sell signals could indicate exhaustion and another retracement phase. Keep an eye on volume and price structure for further confirmation of the next move!
Technical & Price Action Analysis
Key Levels to Watch
Support Levels:
21.081 – If bulls can hold this zone, expect a bounce. If broken, it flips to resistance.
Resistance Levels:
26.095 – Major test level for bulls. A breakout here can fuel a rally.
54.034 – Long-term resistance. If price reaches this zone, expect a reaction.
What Happens If Levels Fail?
If support zones don’t hold, they become resistance on the next rally attempt. Likewise, failed resistance levels can act as support if buyers step in. Stay sharp, trade smart, and respect the key levels!
Technical & Price Action Analysis
Key Levels to Watch
Support Levels:
21.081 – This is the key support zone where buyers need to step in. If the price holds, expect a bounce and a potential reversal. If this level fails, it flips into resistance, making future upward moves more challenging.
Resistance Levels:
26.095 – The first major hurdle for bulls. A confirmed breakout above this level could ignite a rally. However, if sellers defend this zone aggressively, expect a pullback.
54.034 – Long-term resistance, and a psychological level where significant selling pressure is expected. If price reaches this area, expect strong reactions from both bulls and bears.
Powerful Support Levels:
Currently, there are no confirmed powerful support zones. Bulls must establish strong buying interest to create a reliable foundation for future upside moves.
Powerful Resistance Levels:
No powerful resistance levels have been validated yet. However, if price action struggles at key resistance zones, these areas could become strong walls of sell pressure.
What Happens If Levels Fail?
If a support level fails to hold, it flips into resistance, meaning any bounce attempt is likely to face selling pressure at that same level.
Similarly, if resistance is breached but price fails to hold above, it can act as a trap for breakout traders, leading to a fakeout and a strong rejection.
Price action will dictate the next moves—watch these levels closely and be ready to react accordingly. Stay sharp, trade smart, and respect the key levels!
Concept of Rays: Trading Strategies Based on Fibonacci Rays
Core Idea
My proprietary method is built on Fibonacci-based rays that define dynamic support and resistance levels. These rays predict key zones where price action is most likely to react, either reversing or continuing its movement. The key is to wait for confirmation via interaction with these rays before making a trade decision.
Why Specific Levels Can't Be Predicted
Financial markets are nonlinear and driven by multiple factors—liquidity, market sentiment, and macroeconomic events. Instead of attempting to predict exact price points, this method identifies **high-probability reaction zones** where price action provides clues for trade entries.
How the Rays Work
**Fibonacci Rays:** Each ray is mathematically aligned with the market’s natural rhythm, originating from the beginning of a move rather than extreme points.
**Adaptability:** When new price structures emerge, rays adjust dynamically, setting new interaction zones.
**Directional Guidance:** Ascending rays act as **support** in uptrends, while descending rays form **resistance** in downtrends.
**Moving Averages as Confirmation:** The intersection of Fibonacci rays with **MA50, MA100, and MA200** adds extra confluence for price reaction.
Trading Scenarios
Optimistic Scenario (Bullish Move):
If price interacts with an ascending ray near **21.081 (support)** and bounces with strong volume, this signals an entry for a long trade.
The **first target** is the next ray level near **26.095**, where partial profit can be taken.
If momentum continues, the **second target** is at **54.034**, a major resistance level.
Pessimistic Scenario (Bearish Move):
If price fails to hold **21.081** and breaks below it, this level flips into resistance.
A short trade can be initiated with a **first target** at the next ray intersection.
If bearish momentum accelerates, **the next target would be determined by the descending ray channel.**
Potential Trades Based on These Levels
**Long from 21.081 to 26.095** – Only after interaction with support and confirmation of strength.
**Short below 21.081** – If this level fails, look for a rejection and retest before entering.
**Momentum trade from 26.095 to 54.034** – If price clears 26.095 with volume, this becomes a strong continuation setup.
All these setups work **in conjunction with the VSA rays**, which users can see on their charts. **Entries should only be considered after interaction with the rays and confirmation of the movement’s direction.** Price is expected to move from one ray to the next, making each level a structured target for trade execution.
Let's Trade Smarter Together!
Got questions? Drop them in the comments! I always read them and try to respond to as many as possible. Let’s discuss market movements, key levels, and strategies together—your insights and thoughts are just as valuable as mine.
If you found this analysis useful, don’t forget to hit Boost and save this idea. Check back later to see how the price moves according to my markup—because understanding key reaction points is the real edge in trading.
All my Fibonacci Rays and dynamic levels are automatically plotted using my private indicator. If you're interested in using it, feel free to message me directly for details. It’s available only in Private Access.
Want an analysis of your favorite asset? I can do that! Some charts I publish for everyone, and some traders prefer a personal breakdown. Message me if you need something tailored—there’s always a way to work things out.
Remember, these rays work across all assets, and price consistently respects them. If you want a custom markup for your asset, just Boost this post and drop a comment—I’ll do my best to include it in my next analysis.
And finally, make sure to follow me on TradingView—this is where I post my best setups and ideas. Stay tuned for more insights, and let’s trade smart together!

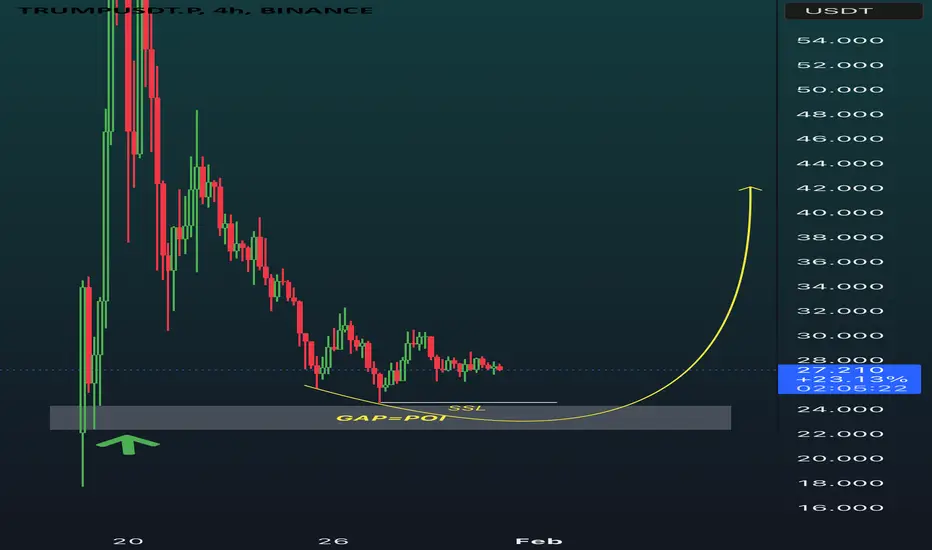
TRUMPUSDT POI zoneI have only interest in this marked GAP zone for TRUMPUSDT. There is a lot of liquidity because of marked SSL wick and also GAP. This is the area I will look to buy this coin in Spot after bullish confirmation. So keep eye on this level.