EUR/USD Shows Optimism Ahead of Trump–Putin MeetingEUR/USD Shows Optimism Ahead of Trump–Putin Meeting
The meeting between the Presidents of the United States and the Russian Federation, scheduled for today in Alaska, is a major geopolitical event with the potential to exert a significant influence on financial markets.
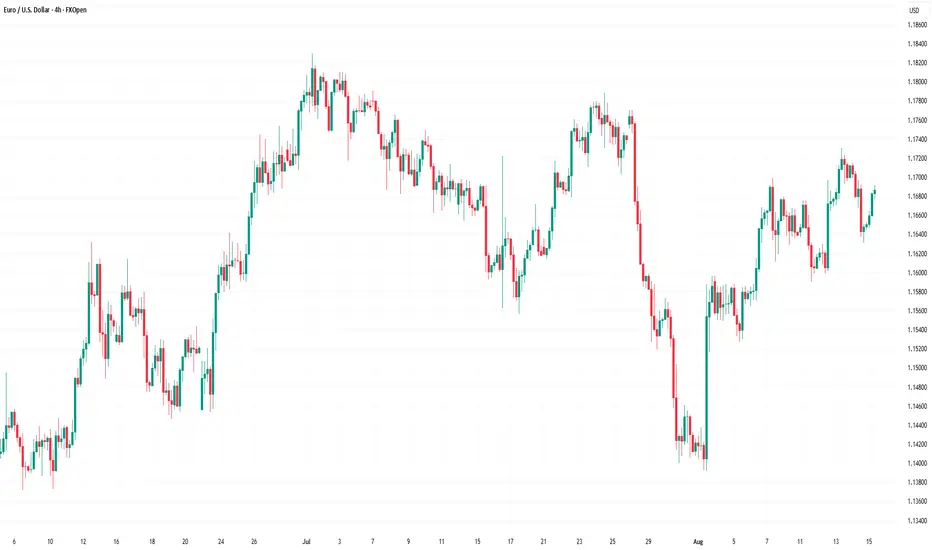
Expectations are mounting that the talks could lead to a cessation of hostilities in Ukraine – a prospect acting as a bullish factor for the euro. As a result, the EUR/USD chart has been displaying an upward trajectory this week (highlighted by the blue channel).
The blue arrow indicates that:
→ Yesterday’s release of the highest Producer Price Index (PPI) figures in three years triggered a sharp strengthening of the US dollar – possibly because market participants assumed the Federal Reserve might postpone monetary policy easing in light of rising producer prices (widely considered a consequence of Trump’s tariff measures).
→ However, the lower boundary of the upward channel prevented further decline, and today EUR/USD is showing optimism ahead of the presidential meeting.
EUR/USD Technical Analysis
On 7 August, we plotted a descending channel based on the sequence of lower highs and lows formed over the summer.
From the bearish perspective, the price is currently near a cluster of key resistance levels, which include:
→ the upper boundary of the descending (red) channel;
→ the 1.17145 level (a historical price interaction zone, as shown by the arrows on the left side of the chart);
→ the median line of the ascending (blue) channel.
Conversely, the bulls could be supported by:
→ the lower boundary of the blue channel;
→ the aggressive buying momentum evident in the sharp EUR/USD rally on 12 August (highlighted by the orange arrow).
The bullish case is further reinforced by the fact that buyers managed to fully recover from the decline that began on 28 July.
Given the above, we could assume some consolidation today as the market awaits the outcome of the presidential talks. The fact that the ADX indicator is hovering near its lows and trending downward underscores the current indecision and caution in the market.
However, Monday’s open could prove highly volatile. Be prepared for sharp EUR/USD movements in either direction, depending on statements made by the US and Russian leaders.
This article represents the opinion of the Companies operating under the FXOpen brand only. It is not to be construed as an offer, solicitation, or recommendation with respect to products and services provided by the Companies operating under the FXOpen brand, nor is it to be considered financial advice.
Trumpnews
US Federal Court Rules Trump Tariffs UnconstitutionalUS Federal Court Rules Trump Tariffs Unconstitutional
According to media reports, the US Court of International Trade has:
- declared the tariffs imposed by President Donald Trump illegal;
- ruled that the President exceeded his authority;
- blocked the tariffs, emphasising that under the US Constitution, only Congress has the power to impose tariffs.
The decision was made unanimously by a panel of three judges. Financial markets reacted with:
- a rise in US stock indices;
- strengthening of the US dollar — most notably seen today on the USD/CHF chart, as demand for so-called safe-haven assets declined in light of the tariff reversal.
Technical Analysis of the USD/CHF Chart
The bullish momentum has broken upward through:
- a local downward trendline (shown in red);
- resistance at the 0.8300 level, near the May 22 high.
Additionally:
- the RSI indicator on the 4-hour chart has moved upwards to the overbought territory;
- the area highlighted with a purple rectangle resembles a bullish Fair Value Gap.
Could this upward momentum lead to a sustained uptrend? There is reason for doubt.
Consider the steep decline in USD/CHF in early April (driven mainly by the introduction of Trump's tariffs) and the relatively small size of today's bullish candle compared to that prior drop.
Price action seems to suggest that market participants are skeptical about any lasting change in the situation. The Trump administration has already filed an appeal, and it’s possible the White House could succeed in defending its position.
This article represents the opinion of the Companies operating under the FXOpen brand only. It is not to be construed as an offer, solicitation, or recommendation with respect to products and services provided by the Companies operating under the FXOpen brand, nor is it to be considered financial advice.

Stock Markets Decline Amid Trump Tariff NewsStock Markets Decline Amid Trump Tariff News
Comparing the approximate difference between last week's opening and closing prices on stock index charts:
➝ The US S&P 500 (US SPX 500 mini on FXOpen) fell by 2.4%.
➝ The European Euro Stoxx 50 (Europe 50 on FXOpen) dropped by 2%.
Why Are Stocks Falling?
The bearish sentiment in stock markets is largely driven by news surrounding White House tariff policies, as reflected in Federal Reserve statements late last week:
➝ Boston Fed President Susan Collins stated that tariffs will "inevitably" fuel inflation, at least in the short term.
➝ Richmond Fed President Thomas Barkin noted that rapid shifts in US trade policy have created uncertainty for businesses.
US developments are also weighing on European stock markets, which were already under pressure following President Donald Trump’s announcement of a 25% tariff on foreign cars. Trump has also threatened further tariffs on the EU and Canada, heightening trade tensions.
Today, the Euro Stoxx 50 index opened with a bearish gap, hitting its lowest level since early 2025, falling below the previous yearly low of 5,292. This reflects growing market concerns ahead of 2 April, when Trump is expected to confirm the implementation of new tariffs.
Technical Analysis of the Euro Stoxx 50 Index (Europe 50 on FXOpen)
Since late 2024, the price has been moving within an ascending channel (marked in blue), but today, it has fallen below the lower boundary—suggesting the channel is losing relevance. Bearish dominance is evident through the following signals:
➝ The 5,550 level proved to be an insurmountable resistance for bulls.
➝ The median of the blue channel acted as resistance (marked by a red arrow).
➝ The 5,406 level shifted from support to resistance (marked by black arrows).
If the bearish trend persists, the Euro Stoxx 50 index (Europe 50 on FXOpen) could continue fluctuating within a descending channel (outlined in red).
This article represents the opinion of the Companies operating under the FXOpen brand only. It is not to be construed as an offer, solicitation, or recommendation with respect to products and services provided by the Companies operating under the FXOpen brand, nor is it to be considered financial advice.
