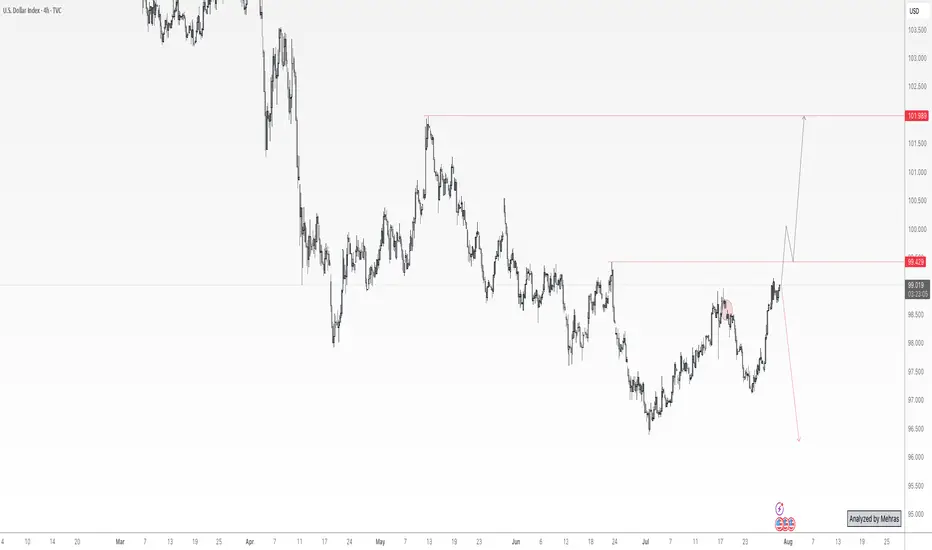
DXY Bulls Ready — Can Powell Spark the Rally?📊 DXY Pre-FOMC Outlook
In my previous analysis released on Monday, I expected the Dollar Index to fill the gap around the 98.60 zone and range below the key red line at 99.429.
Now, with less than 8 hours left until the highly anticipated FOMC rate decision, it’s time to take a closer look at tonight’s event and what it could mean for the markets.
From a purely technical perspective — setting the news aside — the Dollar Index looks ready to break through the crucial 100 level and kick off a strong bullish rally.
However, recent political pressure from Trump urging rate cuts, along with visible tension between him and Fed Chair Jerome Powell, has created uncertainty. If it weren’t for these conflicting signals, I would’ve confidently expected a clean breakout above 100.
As much as I enjoy trading news-driven events, I’ll likely stay out of the market tonight and observe from the sidelines. The setup is tempting, but the dual narratives make it risky.
That said — if you ask for my final take — I believe the stage is fully set for a bullish dollar and a corresponding drop in gold, EUR, GBP, and other major assets.
Let’s see how it plays out. 👀💥
Trumptrade
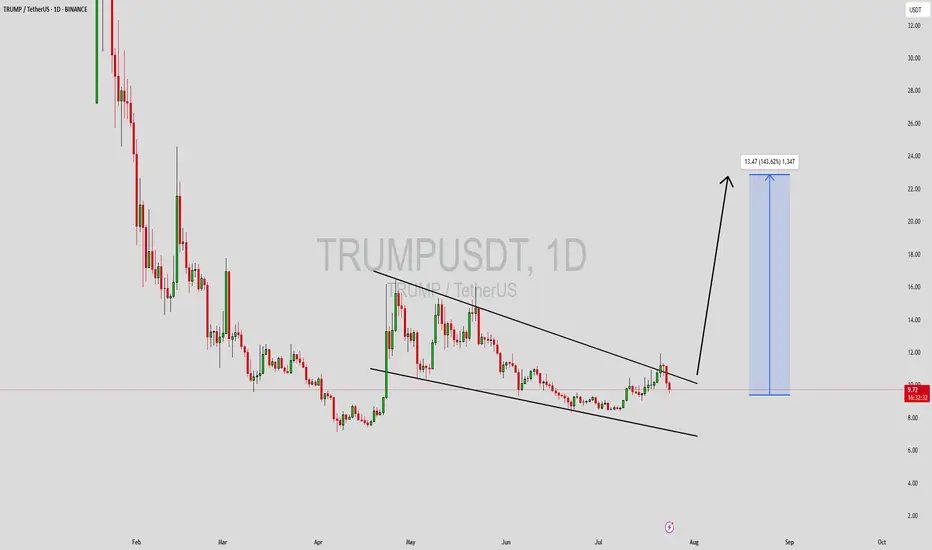
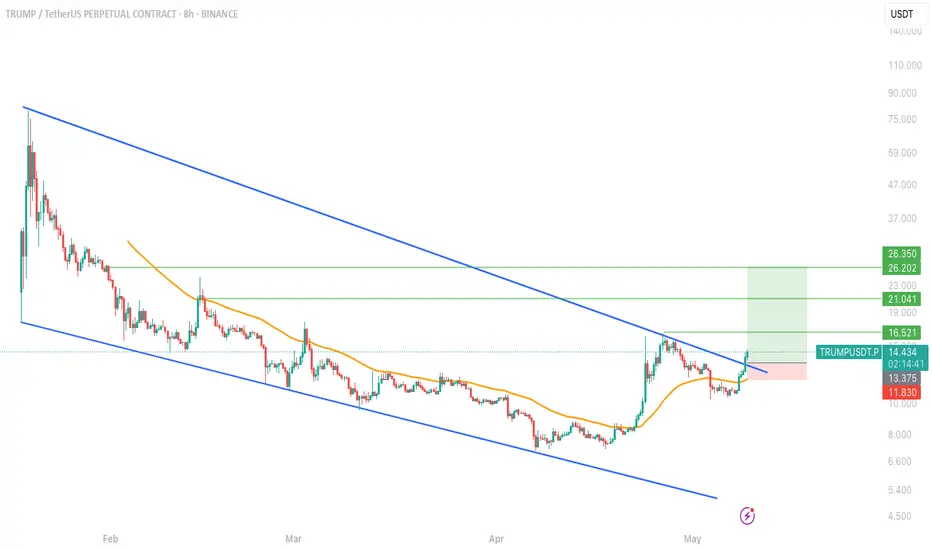
TRUMPUSDT Forming Falling WedgeTRUMPUSDT is currently forming a well-defined falling wedge pattern—a bullish reversal structure that often leads to significant upside breakouts. The price has been consolidating within narrowing trendlines and now appears to be approaching a breakout point. Historically, falling wedge patterns in the crypto market have led to aggressive rallies, especially when combined with rising volume and strong community sentiment. With good volume backing this setup, a breakout could trigger a sharp move to the upside, projecting an expected gain of 90% to 100%+ in the coming sessions.
Investor interest in the TRUMPUSDT project has been steadily increasing, likely fueled by the coin’s strong branding and community-driven momentum. Meme-based and politically themed tokens have seen explosive growth in recent bull cycles, and TRUMPUSDT may be positioning itself to capitalize on similar attention. With sentiment aligning positively and technicals flashing bullish signals, the coin is attracting both short-term swing traders and long-term speculative holders.
If TRUMPUSDT confirms a breakout above the upper wedge resistance with volume confirmation, we could see rapid price expansion. Traders should monitor key levels and consider re-entry on retests or strong bullish candles. The momentum shift is already becoming apparent, and this coin could turn into a trending asset in the meme-token segment very soon.
Keep this setup on your radar as it may provide high-reward opportunities. Monitor community updates, upcoming events, and broader meme coin momentum across the market for additional confirmation.
✅ Show your support by hitting the like button and
✅ Leaving a comment below! (What is You opinion about this Coin)
Your feedback and engagement keep me inspired to share more insightful market analysis with you!
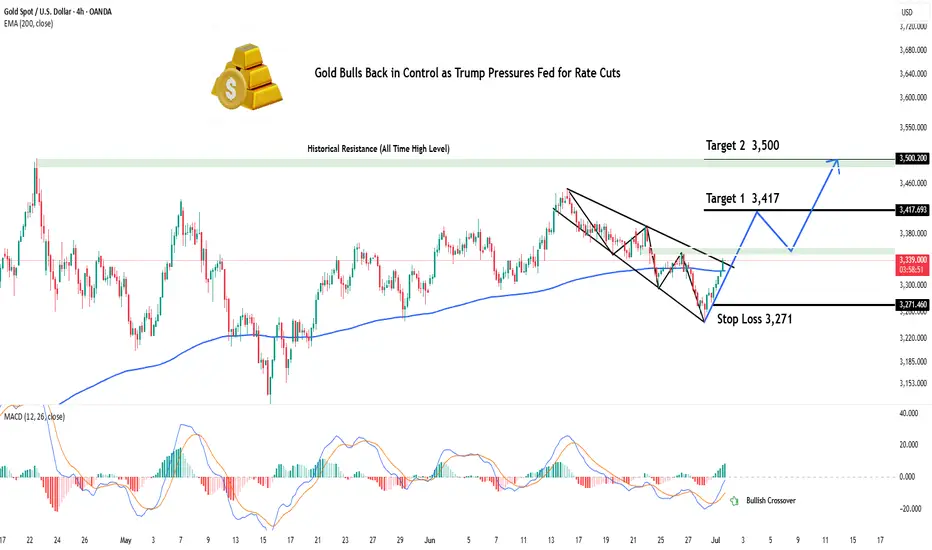
Gold Bulls Back in Control as Trump Pressures Fed for Rate CutsHey Realistic Traders!
President Trump is ramping up pressure on the Fed to cut interest rates , saying the U.S. is falling behind countries with looser policies. As several Fed officials begin to shift their stance, expectations for rate cuts are growing. That’s putting pressure on the dollar and giving gold a fresh boost.
We’ll take a closer look at what this means for OANDA:XAUUSD (Gold) through technical analysis and explore its upside potential.
Technical Analysis
On the 4-hour chart, Gold has moved above the EMA-200, signaling a shift in momentum to the upside. Price has also broken out of a Descending Broadening Wedge (DBW) pattern, which often indicates the start of a bullish trend.
The breakout was confirmed by a Bullish Marubozu candle, reflecting strong buying pressure. To add further confirmation, the MACD has formed a bullish crossover, reinforcing the upward momentum.
Looking ahead, the first target is seen at 3417. If reached, a minor pullback toward the historical resistance zone (green area) may occur, with a potential continuation toward the second target at 3500.
This bullish outlook remains valid as long as the price stays above the stop-loss level at 3271 . A break below this level would invalidate the setup and shift the outlook back to neutral.
Support the channel by engaging with the content, using the rocket button, and sharing your opinions in the comments below.
Disclaimer: "Please note that this analysis is solely for educational purposes and should not be considered a recommendation to take a long or short position on XAUUSD.
10Y: Positioning for a Falling Yield EnvironmentCBOT: Micro 10 Year Yield Futures ( CBOT_MINI:10Y1! ), #microfutures
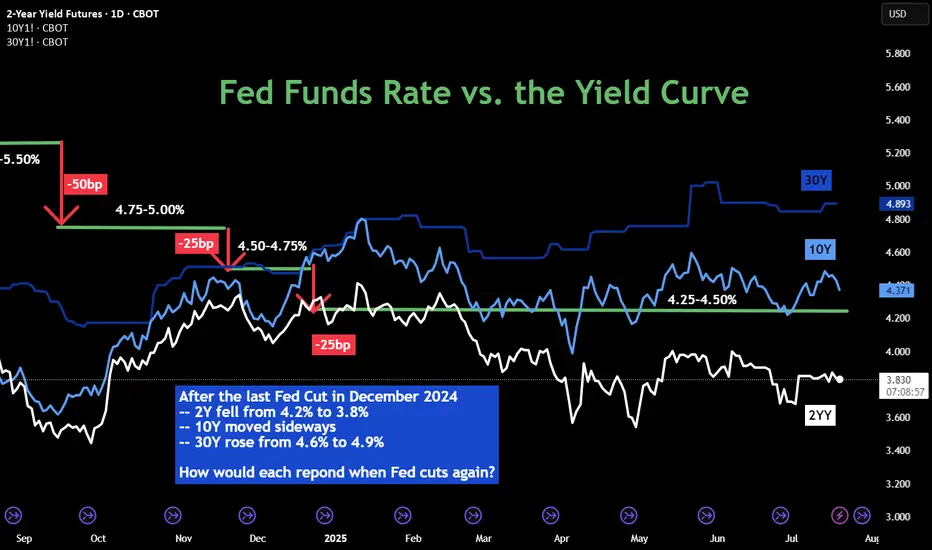
The Federal Reserve last cut interest rates in December 2024. Since then, it has kept the rates unchanged in its January, March, April and June FOMC meetings. While the official Fed Funds rate stays at 4.25-4.50% in the past seven months, we have seen diverging trends in the interest rate market:
• 2-Year Yield has trended down from 4.25% to around 3.85%;
• 10-Year Yield mostly moved sideways, currently at 4.42%;
• 30-Year Yield rose from 4.60% to top 5.00% in May, then pulled back to 4.89%.
The futures market expects the Fed to cut rates once or twice in the remaining four FOMC meetings in 2025, according to CME Fed Watch Tool.
• As of July 20th, there is a 95.3% chance that the Fed will keep rates unchanged in its July 30th meeting;
• The odd of lowering 25 bps is approximately 60% for September 17th;
• By the last 2025 meeting on December 10th, futures market sees just 6.4% chance that the Fed keeps the rates at current level 4.25-4.50%, while the odds of 1 cut to 4.00-4.25% are 29.2%, and the odds of 2 cuts to 3.75-4.00% are 64.3%.
The Fed’s Challenges
The Fed tries to fulfil its dual mandate established by the Congress: (1) to support maximum employment and (2) to maintain price stability. Its official targets are to keep the unemployment rate below 4%, as measured by the BLS nonfarm payroll data, and to keep the inflation rate at 2%, as measured by the PCE price index. When we face an outlook of rising prices and slowing employment, the Fed will have a hard time meeting both policy goals.
Firstly, as the Trump Administration raises tariffs for all trading partners on all imports, it’s a matter of time before the inflation rate picks up again. Even if many countries may reach trade agreements with the U.S., they will still get a bigger tax bill.
• According to the Bureau of Economic Analysis (BEA), the total US imports of goods and services was $4.1 trillion for 2024.
• Imports account for 14% of the US GDP in 2024, which is $29.2 trillion (BEA data).
• Simple math suggests that a universal 10% tariff hike could contribute to 1.4% in price increases, assuming all tariffs are passed through to the retail prices.
The most recent inflation data is the June CPI at 2.7% (BLS data). The tariff hike could easily push inflation to twice the Fed policy target. Therefore, cutting rates will be a very difficult decision if inflation rebounds.
Secondly, US employment growth has slowed down significantly in 2025. On July 3rd, the BLS reported total nonfarm payroll increased by 147,000 in June, and the unemployment rate changed little at 4.1 percent. Current employment growth is less than half the level in December 2024, which saw the data above 300,000.
There are weaknesses in the payroll data. All private sectors combined accounted for about half of the employment gain, or 74,000. Government jobs, while at a much smaller base, accounted for the other half.
Tariffs raise the cost of input, while business borrowing costs remain high at current rate level. To support growth and maximum employment, cutting rates make sense.
Finally, the Fed is under tremendous pressure from the Administration. President Trump openly and repeatedly calls for a 300bp cut.
In an ideal world, the Fed wants to make monetary policy decisions free of political interference. It may not be the case. Let’s look at the Fed rate decisions during the first Trump presidential term. The current Fed Chair was appointed to the role by President Trump in February 2018.
• The Fed raised interest rates four times in 2018, for a total of 100 basis points, with the Fed Funds rate increased from 1.25-1.50% to 2.25-2.50%.
• Under pressure from the White House, the Fed cut rates three times in 2019 for a total of 75 basis points, with the Fed Funds rate ending at 1.50-1.75%.
• In 2020, in response to the Pandemic, the Fed cut rates by 150 points, all the way to a zero-rate environment (0%-0.25%).
In my opinion, the Fed will cut rates this year, similar to 2019. Once the Fed Chair retires in May 2026, his replacement, who will be nominated by President Trump, will no doubt follow his guidelines and bring the Fed Funds rate all the way down to 1%-2% level.
While there is uncertainty in the timing and pace, we are likely to embark on the path to low interest-rate environment.
Shorting Micro 10-Year Yield Futures
A trader sharing a bearish view on interest rates could explore shorting the CBOT Micro 10-Year Yield Futures ($10Y).
Last Friday, the August 10Y contract (10YQ5) was settled at 4.425. Each contract has a notional value of 1,000 index points, or a market value of $4,425. To buy or sell 1 contract, a trader is required to post an initial margin of $300. The margining requirement reflects a built-in leverage of 14.7-to-1.
Let’s use a hypothetical trade to illustrate how to use a short futures position to take advantage of a potential Fed rate cut.
Hypothetical Trade:
• Short 1 10YQ5 at 4.425, and set a stop loss at 4.60
• Trader pays $300 for initial margin
Scenario 1: Fed keeps rates unchanged on July 30th, 10Y moves sideways
• If Futures price changes little after the July FOMC, the trader could close the position
• He could short the September contract 10YU5, with an eye open for the September 17th FOMC rate decision
• This is a futures rollover strategy.
Scenario 2: Fed cuts 25 bps on July 30th, 10YU5 falls 250 points to 4.175
• Short position gains: $250 (= (4.425-4.175) x 1000)
• The hypothetical return will be 83% (= 250 / 300)
Happy Trading.
Disclaimers
*Trade ideas cited above are for illustration only, as an integral part of a case study to demonstrate the fundamental concepts in risk management under the market scenarios being discussed. They shall not be construed as investment recommendations or advice. Nor are they used to promote any specific products, or services.
CME Real-time Market Data help identify trading set-ups and express my market views. If you have futures in your trading portfolio, you can check out on CME Group data plans available that suit your trading needs tradingview.sweetlogin.com
TrueFi (TRU)#TRU
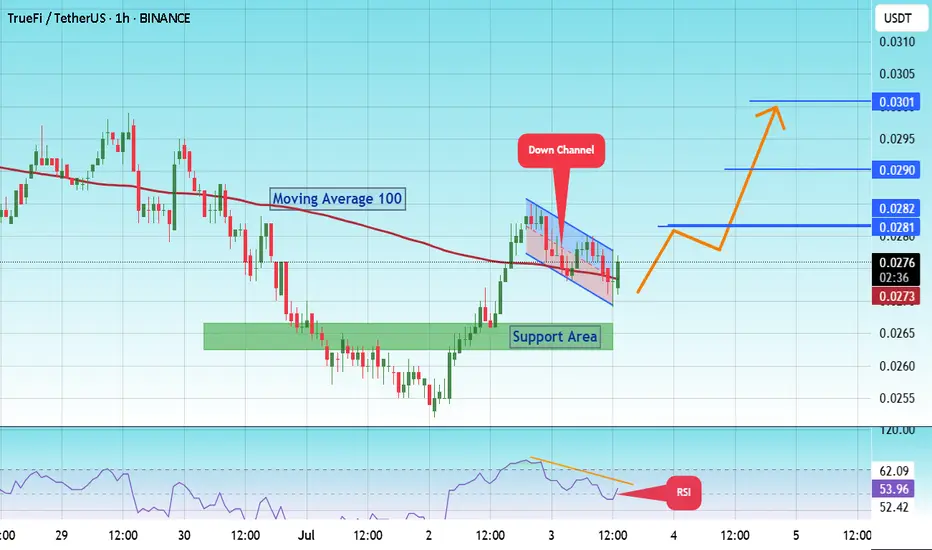
The price is moving within a descending channel on the 1-hour frame and is expected to break and continue upward.
We have a trend to stabilize above the 100 moving average once again.
We have a downtrend on the RSI indicator that supports the upward break.
We have a support area at the lower limit of the channel at 0.0270, acting as strong support from which the price can rebound.
We have a major support area in green that pushed the price upward at 0.0260.
Entry price: 0.0275
First target: 0.0281
Second target: 0.0290
Third target: 0.0301
To manage risk, don't forget stop loss and capital management.
When you reach the first target, save some profits and then change the stop order to an entry order.
For inquiries, please comment.
Thank you.
Trump's signalHello friends🙌
🔊Given the good growth we had, you can see that the price has hit resistance and you can see that the upward waves are getting weaker, which indicates that we are likely to have a correction until the support areas are identified...
You can buy in the identified support areas in steps and with capital management and move with it to the specified targets.
🔥Join us for more signals🔥
*Trade safely with us*

Copper: Event-driven Trade Idea on Recent TariffsCOMEX: Micro Copper Futures ( COMEX_MINI:MHG1! ), #microfutures
The Event
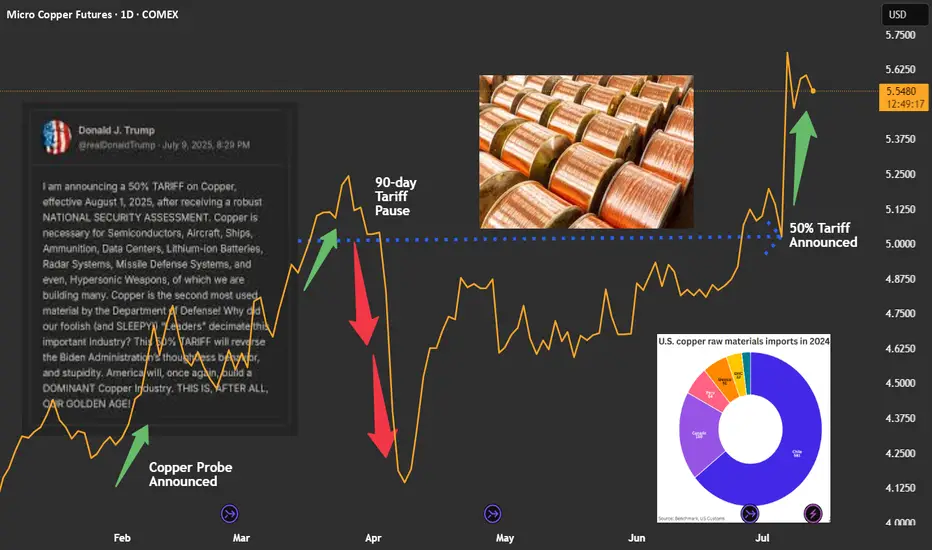
On July 9th, President Trump announced that he would impose a 50% tariff on imports of copper, effective August 1st.
The decision was based on national security assessment. Copper is the second most used material by the U.S. Department of Defense. The President intents to use tariffs to reduce reliance on imports and shore up support for domestic production.
Immediate Market Reaction
U.S. copper prices ended Tuesday’s session over 13% higher — the sharpest single-day gain since 1989. The September COMEX copper futures contract was settled at $5.584 a pound on Friday, up 35.7% year-to-date.
Due to tariffs, Copper in the U.S. is priced at a large premium over international markets.
• UK: LME copper contract was quoted at $9,660.5 per ton on Friday.
• China: SHFE coper futures was settled at RMB 78,420 per ton. It can be converted to $10,959.4 via the Dollar/RMB exchange rate of 7.1555.
• US: COMEX copper quote of $5.584 can be converted to $12,312.7 per ton.
• As of Friday, COMEX copper is priced at a 27.5% premium over LME copper, and a 12.3% premium over SHFE copper.
The U.S. Copper Market
The U.S. Geological Survey reports that the 2024 total refined copper consumption was 1.8 million metric tons. Of which, 850,000 tons were from mining, 150,000 tons were refined from scrap, and 810,000 tons from imports.
Chile is the biggest source of U.S. copper imports, accounting for 581,000 tons, or 71.7% of total imports. Canada is the second largest, for 169,000 tons, or 20.9%.
Copper is a widely used base metal, found in products ranging from machinery, electronics, household goods, housing, infrastructure projects, to aircraft and missiles.
Since President Trump announced a probe into copper in February, traders have been poised for a hike on copper duties, leading to major shifts in inventories away from Europe and Asia and into the U.S.
The Next Event: Will the Copper Tariffs get postponed or reduced?
The goal to increase domestic production of copper is very challenging. It will take years to ramp up and decades to fully meet demand — at a massive upfront investment cost.
Hiking the import duties would not help national security. It could not change the fact that the biggest copper mines are in Chile, Peru and Canada. A sharp increase in the cost of copper will quickly translate into wide-ranging inflation in the U.S.
In my opinion, once the Trump administration realizes the full impacts, we could possibly see a crawl-back from the intended copper tariffs. The effective date would be postponed, the tariff rate could be reduced, and many companies may get exemption/waiver. We have seen similar maneuvers happening multiple times in the past few months.
Overall, the actual impact of copper tariffs will be much smaller than the original announcement.
Shorting COMEX Copper Futures
Historically, the price difference between COMEX and LME coppers has been near-zero and was around the $150 level in 2024.
Since February, COMEX copper has been trading at $500-$1,500 premium over LME. As of Friday, COMEX copper futures have gone up 35% this year and are now priced at $2,652 per ton above LME copper.
In my opinion, these price differences reflect no economic fundamentals. It is purely due to the ever-changing global tariff conflict. If President Trump rescinds his tariff narratives, we could likely see a large drop in COMEX copper prices.
A trader sharing this view could explore shorting the COMEX Micro copper ( GETTEX:MHG ).
Last Friday, the September micro copper futures contract (MHGU5) was settled at 5.5910. Each contract has a notional value of 2,500 pounds of high-grade copper, or a market value of $13,977.5. To buy or sell 1 contract, a trader is required to post an initial margin of $1,100. The margining requirement reflects a built-in leverage of 12.7-to-1.
Let’s use a hypothetical trade to illustrate how to use a short futures position to take advantage a potential reduction on copper tariffs.
Hypothetical Trade:
• Short 1 MHGU5 contract at 5.5910, and set a stop loss at 6.00
• Trader pays $1,100 for initial margin
Scenario 1: Tariffs go into effect, copper rises to $6.57
• Futures reflect a 50% premium over current LME copper price, which is at $4.38 per pound
• Short order stop loss at 6.00, and the maximum loss is $1,022.5 (= (6-5.591) x 2500)
• The trader loses most of the margining fund, but owes no more
Scenario 2: Trump Rescinds Tariffs, Copper falls to $4.38
• COMEX copper will be priced at No premium over LME
• Short position gains: $3,027.5 (= (5.591-4.38) x 2500)
• The hypothetical return will be 275.2% (= 3027.5 / 1100)
The above scenarios show that
• When copper falls, short position will have higher returns due to its leverage nature.
• When copper rises, the stoploss will kick in to set maximum losses.
The above trade idea could be deployed using the standard-size Copper Futures contract. Its notional value is 25,000 tons, which is 10 times bigger than that of the micro contract. The initial margin is $11,000. The standard-size contract is more liquid. On Friday, it had a total volume of 60,313 contracts, and an open interest of 221,682.
Happy Trading.
Disclaimers
*Trade ideas cited above are for illustration only, as an integral part of a case study to demonstrate the fundamental concepts in risk management under the market scenarios being discussed. They shall not be construed as investment recommendations or advice. Nor are they used to promote any specific products, or services.
CME Real-time Market Data help identify trading set-ups and express my market views. If you have futures in your trading portfolio, you can check out on CME Group data plans available that suit your trading needs tradingview.sweetlogin.com
TRUMP BUY ???Hello friends🙌
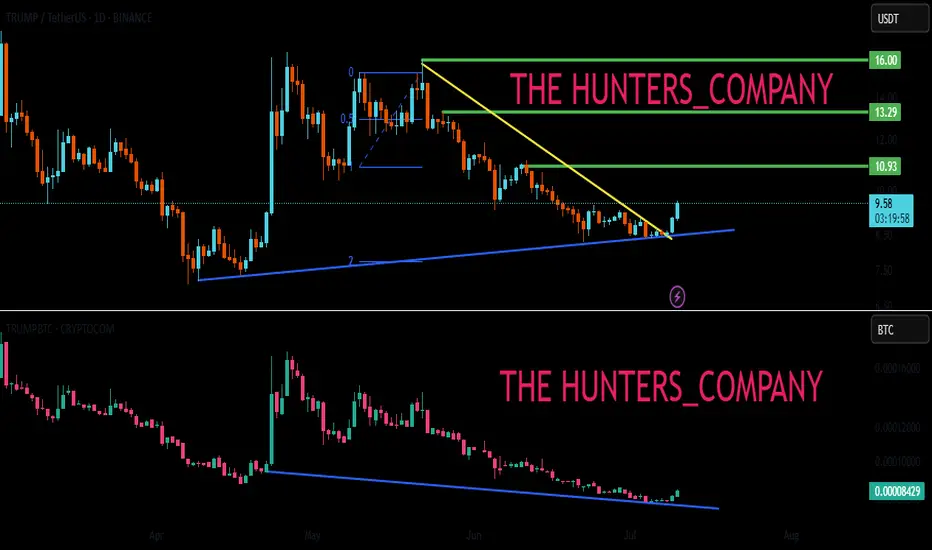
🔊As you can see in the picture, we have brought you two Trump charts:
1_TRUMP/USDT, in which we see an upward trend.
2_TRUMP/BTC, in which we see a downward trend.
✔Now what is the conclusion? When this negative divergence occurs, it means that money flows from Bit to Tether, and we can expect good growth from it to the specified targets, given the price reaching important support and its return📈
🔥Join us for more signals🔥
Trade safely with us.
Canadian Dollar vs. US Dollar. The Spring Is Compressing.In previous posts, we have already begun to look at the key drivers of the US outperformance over the past decade.
The US market dominance has been largely driven by the rapid rise of tech giants (such as Apple, Microsoft, Amazon and Alphabet), which have benefited from strong profit growth, global market reach and significant investor inflows.
Unsatisfactory International Performance
Markets outside the US have faced headwinds including multiple stifling sanctions and tariffs, slowing economic growth, political uncertainty (especially in Europe), a stronger US dollar and the declining influence of high-growth tech sectors.
The Valuation Gap
By 2025, US equities will be considered relatively expensive compared to their international peers, which may offer more attractive valuations in the future.
Recent Shifts (2025 Trend)
Since early 2025, international equities have begun to outperform the S&P 500, and European and Asian equities have regained investor interest. Global market currencies are also widely dominated by the US dollar.
Factors include optimism around the following three big themes.
DE-DOLLARIZATION. DE-AMERICANIZATION. DIVERSIFICATION.
De-dollarization is the process by which countries reduce their reliance on the US dollar (USD) as the world's dominant reserve currency, medium of exchange, and unit of account in international trade and finance. This trend implies a shift away from the central role of the US dollar in global economic transactions to alternative currencies, assets, or financial systems.
Historical context and significance of the US dollar
The US dollar became the world's primary reserve currency after World War II, as enshrined in the Bretton Woods Agreement of 1944. This system pegged other currencies to the dollar, which was convertible into gold, making the dollar the backbone of international finance. The United States became the world's leading economic power, and the dollar replaced the British pound sterling as the dominant currency for global trade and reserves.
The dollar has been the most widely held reserve currency for decades. As of the end of 2024, it still accounts for about 57% of global foreign exchange reserves, far more than the euro (20%) and the Japanese yen (6%). However, this share has fallen from over 70% in 2001, signaling a gradual shift and prompting discussions about de-dollarization.
How De-Dollarization Works
Countries looking to reduce their reliance on the dollar are pursuing several strategies:
Diversifying reserves: Central banks are holding fewer U.S. dollars and increasing their holdings of other currencies, such as the euro, yen, British pound, or new alternatives such as the Chinese yuan. While the yuan's share remains small (about 2.2%), it has grown, especially among countries like Russia.
Using alternative currencies in trade: Countries are entering into bilateral or regional agreements to conduct trade in their own currencies rather than using the dollar as an intermediary. For example, China has introduced yuan-denominated oil futures (the "petroyuan") to challenge the petrodollar system. Increasing gold reserves: Many countries, including China, Russia and India, have significantly increased their purchases of gold as a safer reserve asset, reducing their dollar holdings.
Developing alternative financial systems: Some countries and blocs, such as BRICS, are working to develop alternatives to the US-dominated SWIFT payment system to avoid the risk of sanctions and gain true economic and political independence.
Reasons for de-dollarization
The move towards de-dollarization is driven by geopolitical and economic factors:
Backlash against US economic hegemony: The US often uses dollar dominance to impose sanctions and exert political pressure, encouraging countries to seek financial sovereignty.
Rise of new economic powers: Emerging economies like China and groups like the BRICS are seeking to reduce their vulnerability to U.S. influence and promote regional integration and alternative financial infrastructures.
Geopolitical tensions: Conflicts like the war in Ukraine have intensified efforts by countries like Russia to remove the dollar from their reserves to avoid sanctions.
Implications and outlook
While the dollar remains dominant, a more de-dollarized world is already changing global economic power. The U.S. may lose some advantages, such as lower borrowing costs and geopolitical influence. For the U.S. economy, de-dollarization could lead to a weaker currency, higher interest rates, and reduced foreign investment, although some effects, such as inflation from a weaker dollar, could belimited .
For other countries, de-dollarization could mean greater economic independence and less exposure to U.S. policy risks. However, no currency currently matches the dollar’s liquidity, stability, and global recognition, so a full transition is unlikely in the near future .
Summary
De-dollarization is a complex, ongoing process that reflects a gradual shift away from the global dominance of the U.S. dollar. It involves diversifying reserves, using alternative currencies and assets, and creating new financial systems to reduce dependence on the dollar.
Driven by geopolitical tensions and the rise of emerging economic powers, de-dollarization challenges the entrenched role of the dollar but is unlikely to completely replace it anytime soon.
Instead, it is leading to a more multipolar monetary system in international finance, increasing demand for alternative investments to the U.S.
Technical task
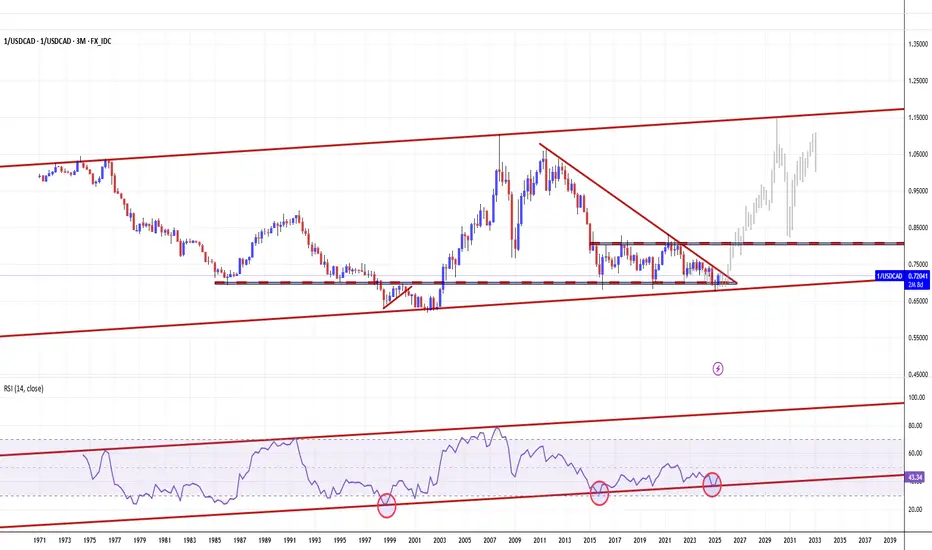
The main technical chart is presented in a quarterly breakdown, reflecting the dynamics of the Canadian dollar against the US dollar FX_IDC:CADUSD in the long term.
With the continued positive momentum of the relative strength indicator RSI(14), flat support near the level of 0.70 and a decreasing resistance level (descending top/ flat bottom) in case of a breakout represent the possibility of price growth to 0.80, with the prospect of parity in the currency pair and strengthening of the Canadian dollar to all-time highs, in the horizon of the next five years.
--
Best wishes,
Your Beloved @PandorraResearch Team 😎
Trump:New update(don't miss it)hello friends👋
This time we came with the analysis of Trump's famous coin meme, which you requested a lot.
Well, as you can see, by making a double floor, the price has broken its downward channel and has grown well.
After the price growth, we saw the price suffering and then the price correction, which caused the formation of an upward pattern.
Now, according to the successful formation of this ascending pattern, it should be seen whether the buyers support the price in the specified support areas or not...
Pay attention that our trend is upward and the pattern made also shows an upward trend, that's why we have identified the support areas for you to enter the transaction step by step with risk and capital management.
🔥Follow us for more signals🔥
*Trade safely with us*
#TRU/USDT#TRU
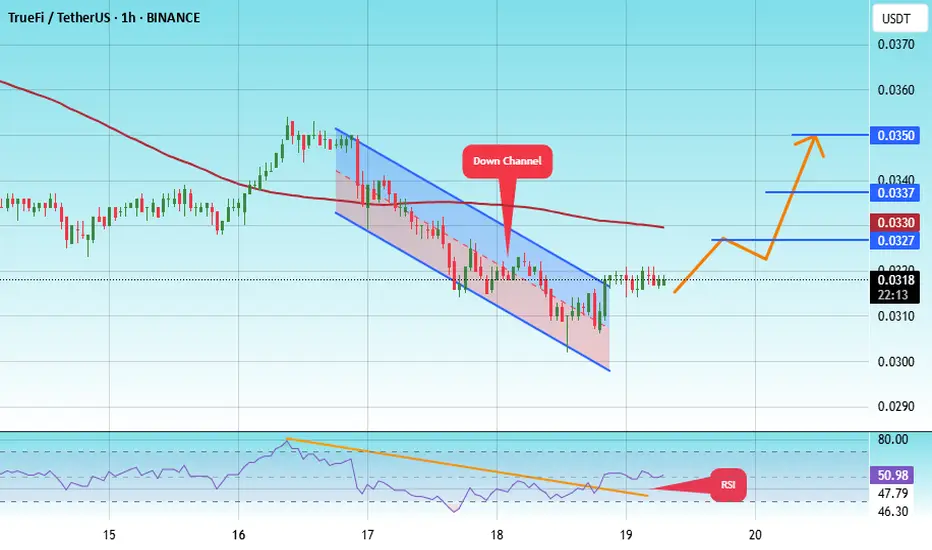
The price is moving within a descending channel on the 1-hour frame, adhering well to it, and is heading towards a strong breakout and retest.
We are experiencing a rebound from the lower boundary of the descending channel. This support is at 0.0300.
We are experiencing a downtrend on the RSI indicator, which is about to break and retest, supporting the upward trend.
We are in a trend of consolidation above the 100 Moving Average.
Entry price: 0.0315
First target: 0.0327
Second target: 0.0337
Third target: 0.0350
Gold Miners Stocks Go 'The Rife Game' in Town. Here's WhyGold mining stocks have emerged as one of the top-performing asset classes in 2025, driven by a combination of surging gold prices, improved profitability, and shifting investor sentiment.
Here’s fundamental and technical analysis of the key factors behind this outperformance, by our @PandorraResearch Super-Duper Beloved Team :
Record-High Gold Prices Fuel Margins
Gold prices surpassed $3,000 per ounce in March 2025 for the first time in history, marking a 14% year-to-date increase. This rally stems from:
Safe-haven demand amid geopolitical tensions, economic and political uncertainty including U.S. trade policy volatility.
Central bank buying , particularly by China, India, Turkey, and Poland, to diversify away from the U.S. dollar.
Anticipated interest rate cuts , which reduce the opportunity cost of holding non-yielding assets like gold.
Higher gold prices directly boost miners’ revenues.
For example, the NYSE Arca Gold Miners Index NYSE:GDM returned nearly 30% YTD by early March, outpacing both physical gold OANDA:XAUUSD (+14.5%) and the S&P 500 SP:SPX (-3.8%). Companies like Agnico Eagle Mines NYSE:AEM and Wheaton Precious Metals NYSE:WPM reached all-time highs, while ASX-listed miners such as Evolution Mining ASX:EVN (+39.5% YTD) and West African Resources ASX:WAF (+56.6% YTD) outperformed Australia’s broader market.
Margin Expansion and Shareholder Returns
Gold miners are leveraging rising prices to improve profitability:
Stabilized costs for labor, energy, and equipment have widened profit margins.
Free cash flow growth enabled dividend hikes and share buybacks. U.S. Global Investors, for instance, offers a 3.91% annualized dividend yield.
Undervalued stocks: Many miners traded at historically low valuations relative to gold prices, creating buying opportunities. Barrick Gold NYSE:GOLD (P/E 15.6) and Newmont Corp NYSE:NEM (P/E 15.5) remained attractively priced despite gains.
Royal Gold NASDAQ:RGLD , a streaming company with a 60.3% operating margin, exemplifies how non-traditional miners capitalize on gold’s rally without direct operational risks.
Sector-Specific Catalysts
Mergers and acquisitions. Consolidation activity has increased, with larger firms acquiring high-potential projects.
Copper exposure. Miners like Evolution Mining benefit from rising copper demand, diversifying revenue streams.
Institutional upgrades. Analysts at Macquarie and Morgan Stanley endorsed Newmont and Evolution Mining, citing currency tailwinds and free cash flow potential.
Macroeconomic and Market Dynamics
Dollar weakness. A declining U.S. dollar enhances gold’s appeal as a hedge.
Equity market volatility. With the S&P 500 struggling, investors rotated into gold equities for diversification (0.3 correlation to broader markets).
Fiscal deficits. U.S. budget imbalances and inflationary pressures reinforced gold’s role as a store of value.
Outlook for 2025
Analysts project further gains, with gold potentially reaching $3,300 per ounce. Miners are expected to sustain momentum through:
Operational efficiency improvements to align with higher gold prices.
Continued capital discipline , avoiding overinvestment in new projects.
Dividend growth , as seen with U.S. Global Investors’ monthly payouts.
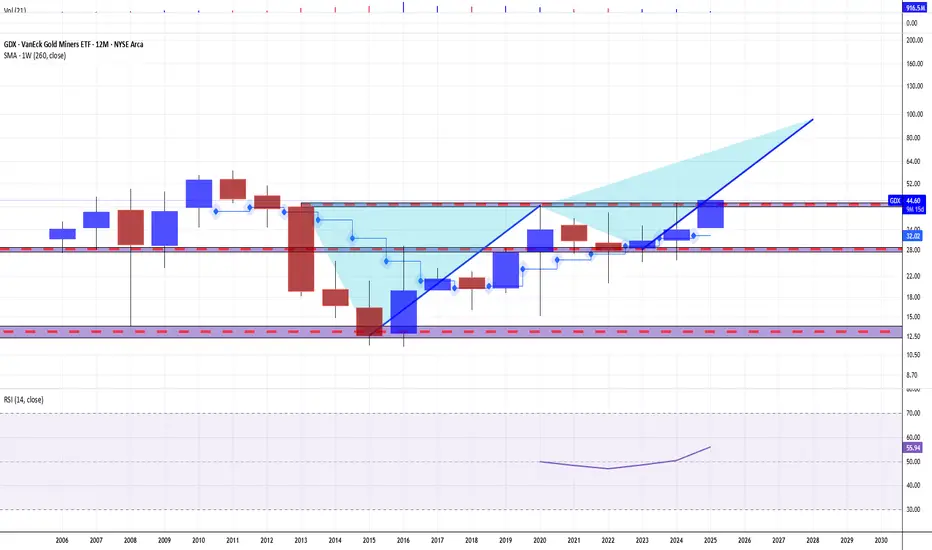
Technical Outlook
The main technical graph for Gold Miners ETF AMEX:GDX indicates on further Long-Term Bullish opportunity, to double the price over next several years, in a case of the epic $45 mark breakthrough.
Conclusion
In summary, gold miners’ 2025 rally reflects a confluence of macroeconomic uncertainty, disciplined capital management, and gold’s structural demand drivers. While risks like cost inflation persist, the sector’s fundamentals and valuation upside position it as a compelling component of diversified portfolios.
--
Best 'Golden Rife' wishes,
@PandorraResearch Team 😎
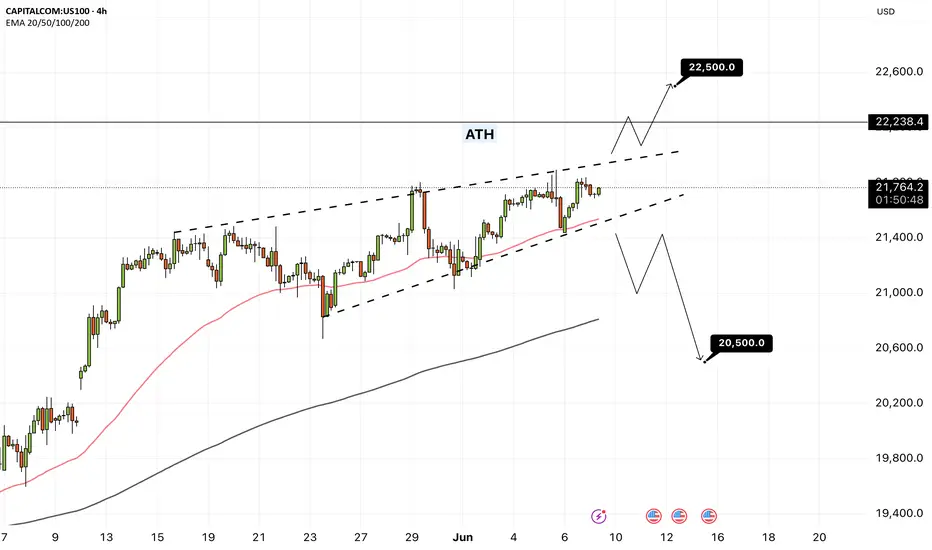
NAS100 - Will the stock market reach its previous ATH!?The index is above the EMA200 and EMA50 on the 4-hour timeframe and is trading in the specified pattern. In case of a valid break of this range, I expect a new trend to form. It is better to wait for confirmation on the break in order to control further risk.
U.S. President Donald Trump announced that an American delegation will meet with Chinese representatives in London on June 9 to discuss a potential trade agreement. In a post on Truth Social, Trump stated, “I’m pleased to announce that Treasury Secretary Scott Bessent, Commerce Secretary Howard Lutnick, and U.S. Trade Representative Jamieson Greer will meet with Chinese officials on Monday, June 9, 2025, in London to discuss a trade deal.” He added that he expects the meeting to go “very well.” U.S. stock markets rose on Friday, and Chinese markets are now following suit. The Hang Seng Index has reached its highest level since March.
Meanwhile, Amazon has completely halted its hiring budget for office workers in its core retail business. This decision applies only to white-collar staff and excludes warehouse employees and those in its cloud computing division. According to Business Insider, which cited internal company emails, the hiring freeze affects Amazon’s online marketplace, logistics operations, and grocery business.
Having doubled its workforce between 2019 and 2021 to 1.6 million, Amazon reduced that number to 1.55 million last year. Since late 2022, the e-commerce giant has laid off at least 27,000 employees.
This move comes as the U.S. jobs report released Friday helped ease some concerns, though signs of broader economic challenges remain. Experts suggest that such a hiring freeze could reflect broader economic trends—where mass layoffs are avoided, but hiring slows down significantly.
In May, the U.S. economy added 139,000 jobs, down from 147,000 in April. The unemployment rate remained steady at 4.2%, staying within the narrow range it has held over the past year. The labor market has remained resilient, dismissing fears that tariffs would cause a significant slowdown. So far, tariff-related disruptions have not been severe enough to destabilize the job market—at least not in May.
Data indicates that employers continue to refrain from layoffs, even as hiring has slowed considerably compared to the post-pandemic surge. Labor market analysts expect signs of weakness to emerge in the coming months, as businesses become more cautious about hiring due to uncertainty surrounding tariffs—according to recent surveys. For now, however, the labor market remains strong.
The absence of red flags in employment may give the Federal Reserve more room to maintain its patient stance on interest rate cuts. This year, Fed officials have kept interest rates higher than average to curb inflation by increasing borrowing costs. The Fed’s dual mandate is to keep inflation low and employment high, and it may opt to cut rates to stimulate the economy if the labor market weakens.Fed Chair Jerome Powell and other FOMC members have said they are waiting to see whether President Trump’s trade wars will stoke inflation, trigger job losses, or both. So far, neither scenario has materialized. Strong labor market data may give them further justification to stay in wait-and-see mode. Rosner wrote, “Given the Fed’s sharp focus on inflation risk management, today’s stronger-than-expected jobs report is unlikely to alter its patient approach. We expect the Fed to remain on hold at this month’s meeting and believe further deterioration
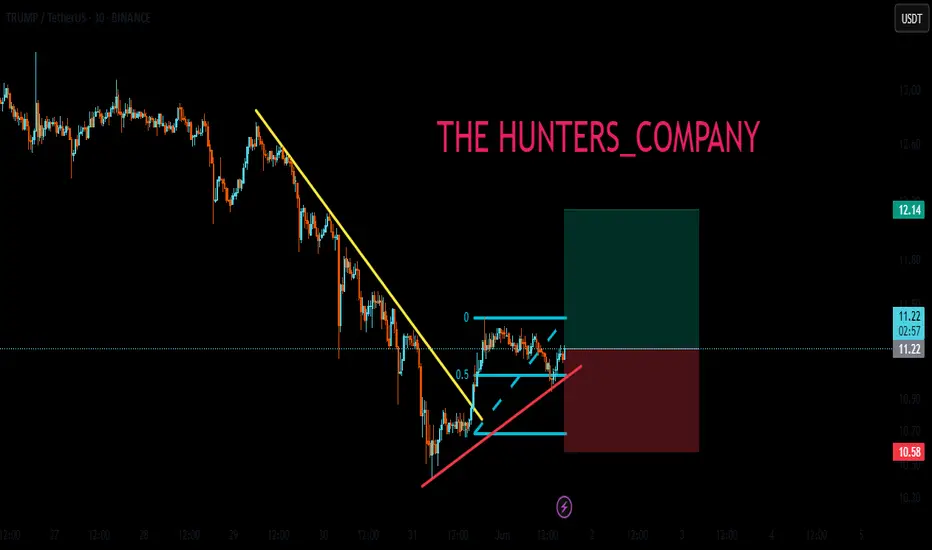
Live Trump TradeHello friends
Based on the analysis and research we have concluded that it is possible to enter into a transaction with risk and capital management, given the entry of buyers and the price pullback.
*Trade safely with us*
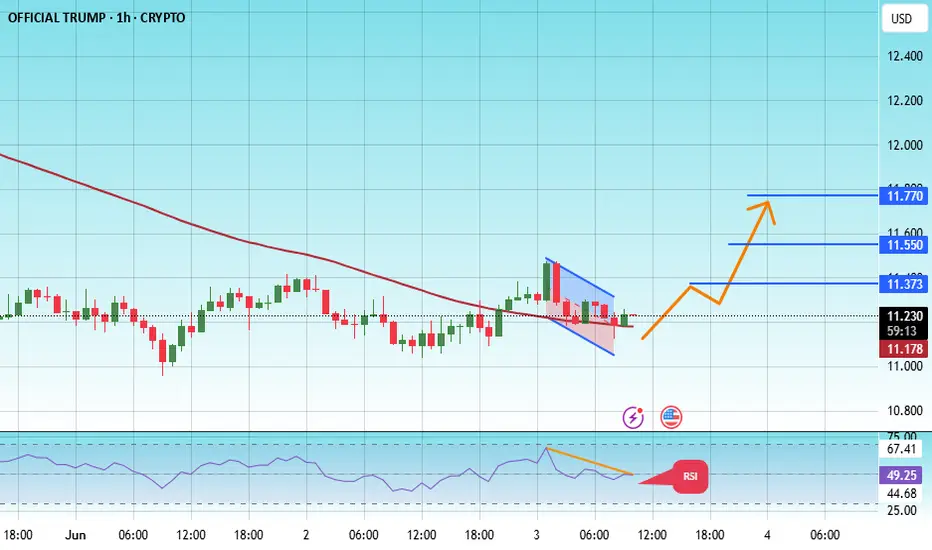
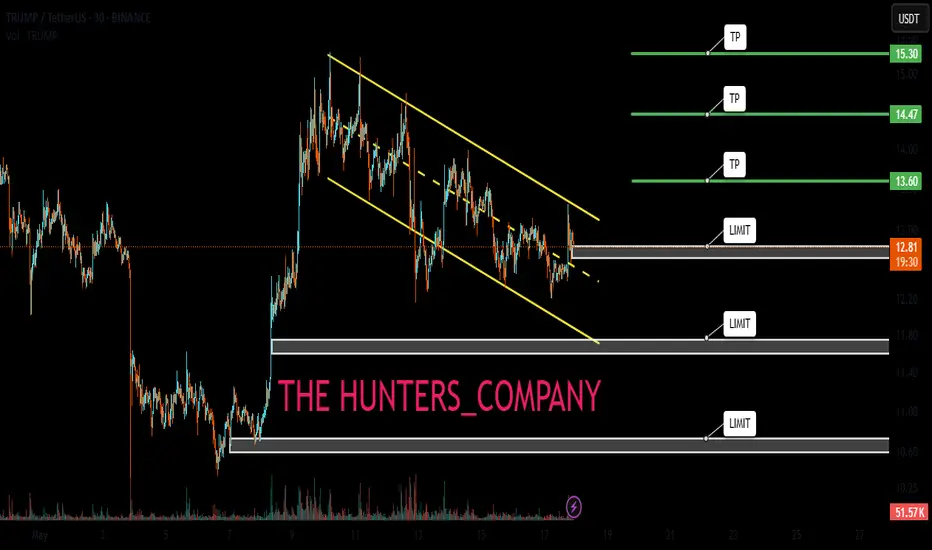
#TRUMP/UDT#TRUMP
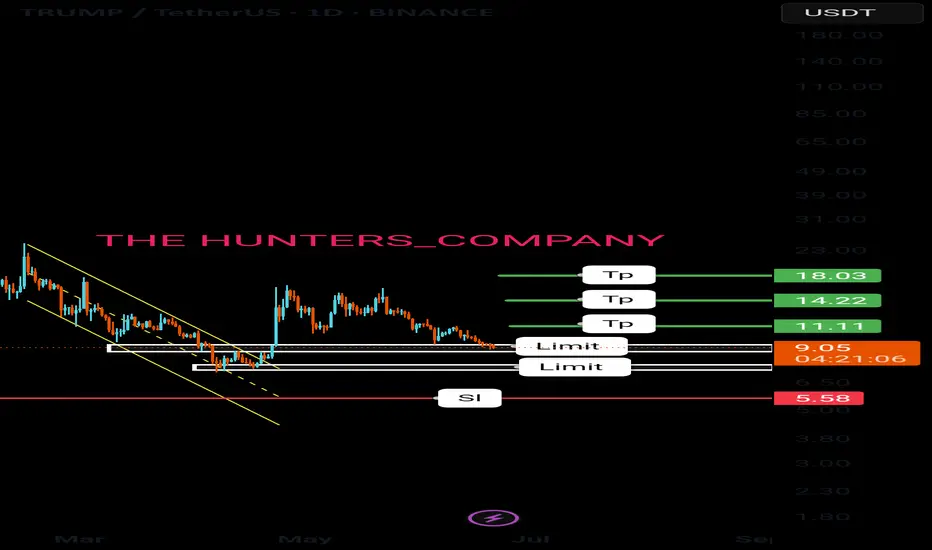
The price is moving within a descending channel on the 1-hour frame, adhering well to it, and is heading towards a strong breakout and retest.
We are experiencing a rebound from the lower boundary of the descending channel, which is support at 11.10.
We are experiencing a downtrend on the RSI indicator that is about to break and retest, supporting the upward trend.
We are heading towards stability above the 100 Moving Average.
Entry price: 11.22
First target: 11.37
Second target: 11.55
Third target: 11.77
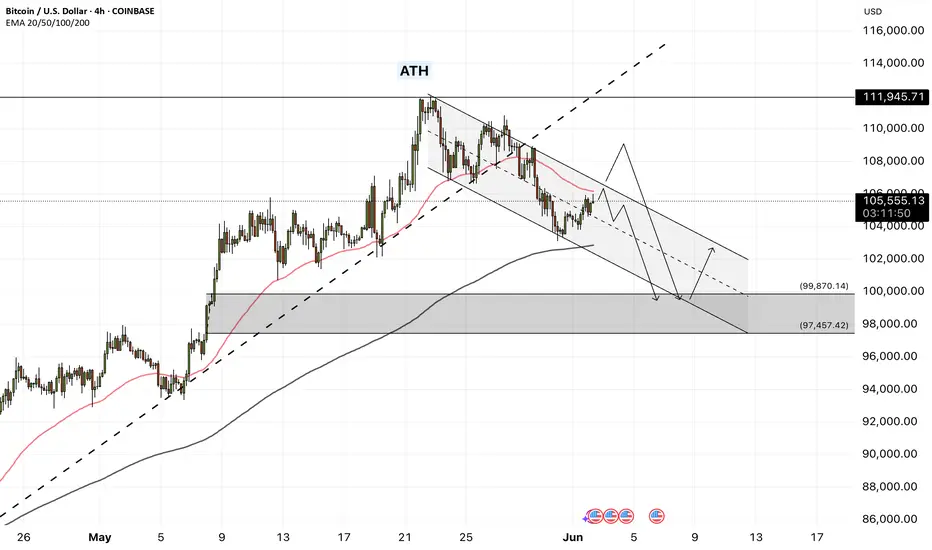
Bitcoin - Will Bitcoin reach $120,000?!Bitcoin is in its short-term descending channel on the four-hour timeframe, between the EMA50 and EMA200. Personally, I would look to sell Bitcoin at a target of $100,000. Either from the channel ceiling or after an invalid breakout of the specified channel. If this corrective move occurs, Bitcoin buying opportunities can be sought within the demand zone.
It should be noted that there is a possibility of heavy fluctuations and shadows due to the movement of whales in the market, and capital management in the cryptocurrency market will be more important. If the downward trend continues, we can buy within the demand range.
The Bitcoin 2025 Conference, widely regarded as the largest global event dedicated to Bitcoin and blockchain technology, took place from May 27 to 29 at the Venetian Convention Center in Las Vegas, Nevada. First launched in 2019 and held annually since, the conference has become the central meeting point for Bitcoin enthusiasts and professionals, offering a platform for knowledge exchange, ideation, and innovation within the Bitcoin ecosystem. With over 30,000 attendees, 400 speakers, and participation from around 5,000 companies, this year’s event played a significant role in advancing the global adoption of Bitcoin—often referred to as “hyperbitcoinization.”
The 2025 edition covered not only technical subjects such as Layer 2 scaling solutions and privacy enhancements, but also broader themes like institutional adoption, strategic Bitcoin reserves, and its implications for financial freedom on a global scale.From an economic perspective, there was a strong emphasis on Bitcoin’s role as a store of value amid inflationary pressures and unstable monetary policies. Forecasts presented by key figures such as Michael Saylor and Paolo Ardoino pointed to Bitcoin’s potential to emerge as a foundational asset within global financial systems. These projections were further supported by the expansion of the M2 money supply in 2024 and expectations for continued growth into 2025.
In addition to highlighting opportunities, the event also addressed the challenges facing Bitcoin. One major concern was the lack of clear legal and regulatory frameworks in certain countries—a topic addressed by Caitlin Long and other speakers. Such regulatory uncertainty could hinder broader Bitcoin adoption. Moreover, Bitcoin’s price volatility—highlighted by a 3.4% decline in the weeks leading up to the conference—raised questions about the market’s long-term stability.
Meanwhile, Coinbase reported that the repayment of debts related to the bankrupt FTX exchange could act as a $5 billion liquidity injection into the crypto market. This development is expected to boost capital inflows and potentially draw major institutional players back into the space.
According to Coinbase, as of May 30, the “FTX Recovery Trust” has begun its second phase of repayments, distributing over $5 billion in stablecoins to creditors. These payouts are being processed over three days via the BitGo and Kraken platforms. Unlike the first round in February, this phase involves only stablecoin disbursements rather than a mix of crypto and cash—enabling recipients to reinvest their funds more quickly and efficiently.
Additionally, U.S.-based companies currently hold 94.8% of all Bitcoin owned by publicly traded firms. The U.S. also commands 36% of the global Bitcoin hash rate, underscoring its dominance in mining activities. So far, 36 U.S. states have enacted pro-Bitcoin legislation, signaling a growing legal endorsement of the cryptocurrency across the country. This level of concentration—in ownership, regulatory leadership, and mining capacity—could position the U.S. to play a more decisive role in shaping future global Bitcoin regulations.
Tariffs. Turbulence. OpportunityMarkets Rattle as Global Currencies Slide: Central Banks Prepare to Act
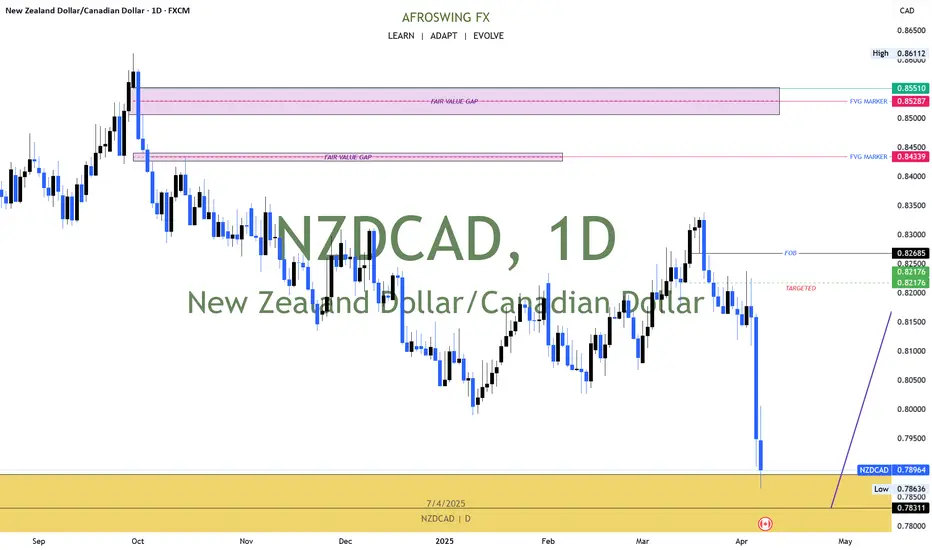
Global financial markets plunged on Monday as U.S. tariffs under the Trump administration, alongside retaliatory measures from key trading partners, officially took effect. The result: a wave of uncertainty and volatility that sent the Australian, Canadian, and New Zealand dollars spiraling to steeply discounted levels.
As this new economic reality unfolds, institutional investors and households alike are scrambling to adjust. In response, central banks across the globe face mounting pressure to stabilize their economies. The most immediate solution? Accelerated interest rate cuts.
Beyond the headline noise of trade wars, the deeper concern lies in domestic economic resilience. Economists and central bankers are increasingly turning inward, looking to bolster aggregate demand through aggressive monetary easing. The U.S. Federal Reserve, nudged persistently by President Trump, has already signaled its willingness to comply. Other central banks are expected to follow suit as nations seek to shield local industries from the impact of trade disruption.
The era of lower global interest rates appears to be more than a passing phase—it is becoming the new norm. In volatile times, disciplined strategies and a long-term lens are more essential than ever. We remain focused on seizing value where others see only risk.
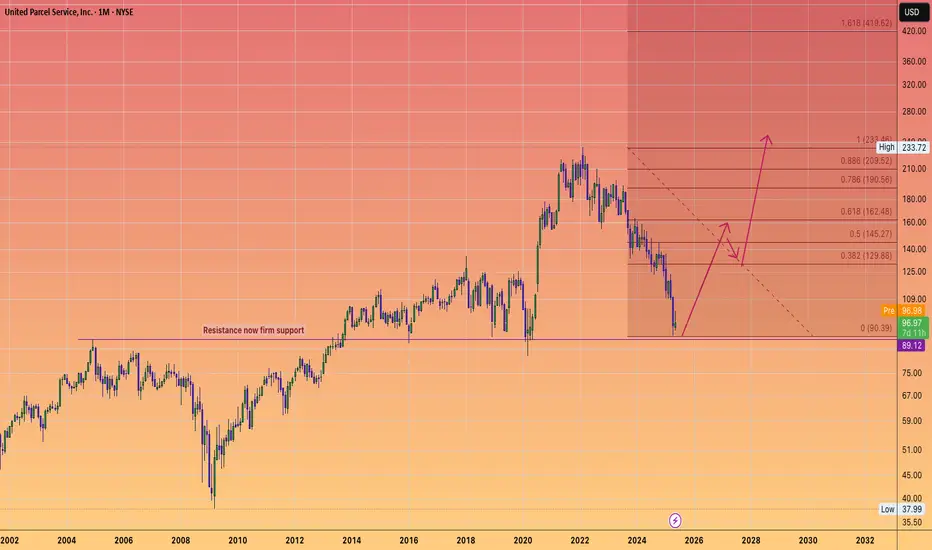
Things are looking UPSUnited Parcel Service served as one of our canaries in the coal mine, signalling that the real economy was much weaker than what the Biden administration was reporting. The figures presented were positively skewed, masking the harsh reality that we were all facing difficult times.
We recognized the head and shoulders topping pattern and warned that an economic disaster was approaching us. This ultimately led to the Trump tariff panic that caused the collapse of equities.
The thesis indicated a lack of confirmation regarding rising index prices; however, consumers were feeling the pressure, which manifested in reduced consumption and, consequently, fewer deliveries.
A modern Dow Theory if you will.
As we near new peaks in the stock market, I am convinced that our economy is on a much more solid foundation, poised to benefit Main Street instead of just a handful of monopolistic tech giants. Since equities are forward-looking, stocks are anticipating an exhilarating 2026!
I believe UPS will confirm this economic recovery as we head towards my long anticipated and forecast DOW JONES price of 64,000 likely by 2030.
TRUMPPPPPPPPPPPPPPPPPPPHello friends
Considering the good growth we had, you can see that the price formed a flag and corrected after reaching its ceiling.
Now, with the price correction, there is a good opportunity to buy in stages and with capital management and move towards the specified goals.
*Trade safely with us*
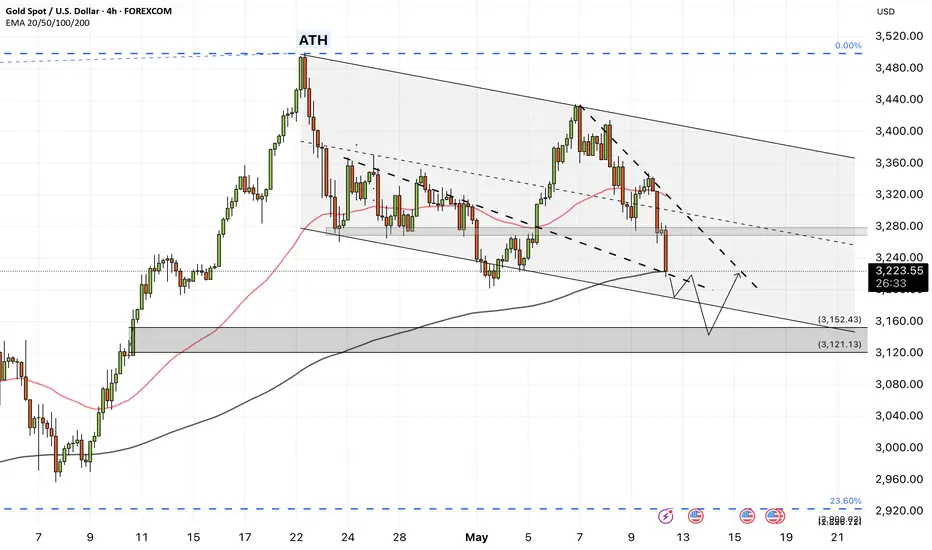
XAUUSD - Is Gold Going Down?!Gold is trading in its descending channel on the four-hour timeframe, between the EMA200 and EMA50. A downward correction in gold will open up buying opportunities from the demand areas.
Investors in the precious metals market witnessed another week of gold’s strong performance. Although overall optimism about a potential reduction in trade tariffs slightly slowed gold’s momentum, robust demand from Asia and other global regions provided solid support, preventing any major market correction.
At the beginning of the week, gold prices fell by over 1% on Monday as news of a trade agreement between the U.S. and China prompted investors to shift toward riskier assets. This drop occurred alongside easing geopolitical tensions between India and Pakistan, which also contributed to a calmer market atmosphere.
U.S. Treasury Secretary Scott Bessent and Trade Representative Jamison Greer announced that the two nations had reached an agreement during negotiations in Geneva, Switzerland. The deal, which is expected to be released as a joint statement, signals a reduction in trade tensions that had escalated in recent weeks with tariffs reaching as high as 145% on Chinese imports.
As part of the agreement, the U.S. and China plan to establish a joint economic and trade consultation mechanism to continue discussions on tariffs. President Donald Trump hinted last week at a potential reduction in tariffs to 80%, although the official details of the deal have yet to be disclosed.
Adam Button, Chief Currency Strategist at Forexlive.com, commented that in the current market environment, it is difficult not to be bullish on gold. However, he warned that any de-escalation in U.S.-China tensions could dampen the strength of gold’s rally. He added, “Even though a 50% reduction in tariffs wouldn’t be the final chapter, if implemented, it would represent fairly rapid progress and a positive sign for both parties.”
In addition to trade developments, the easing of tensions in Kashmir and a ceasefire agreement between India and Pakistan have also reduced demand for safe-haven assets like gold. The ceasefire, brokered by the United States, remained largely intact over the weekend.
Adrian Day, CEO of Adrian Day Asset Management, stated that his outlook on gold remains unchanged. He explained, “Rising concerns over a potential U.S. recession, coupled with cautious optimism about easing trade tensions—especially between Washington and Beijing—could exert pressure on gold. However, gold’s notable resilience against price declines indicates underlying demand that has not yet fully entered the market.”
Meanwhile, Darin Newsom, Senior Market Analyst at Barchart.com, firmly maintained a bullish view on precious metals. He said, “If I had to write one analytical sentence on the market board, it would be: Precious metals must rally. I emphasize ‘must’ because nothing is certain in the markets. My bearish call last week was wrong, and it’s clear that technical analysis has become almost obsolete—especially in today’s world where algorithm-driven trading dominates.”
After a week largely influenced by the Federal Reserve’s meeting and tariff-related headlines, market focus now shifts to a data-heavy week featuring a broad range of U.S. economic indicators. The action kicks off Tuesday with the release of the April Consumer Price Index (CPI), a report that could offer insights into whether the Fed might cut interest rates in its June meeting.
The real highlight, however, is expected on Thursday, when key reports are scheduled to be published, including the Producer Price Index (PPI), retail sales figures, jobless claims data, and two major regional indices—the Philadelphia Fed manufacturing survey and the Empire State manufacturing index. Amidst this flood of information, Fed Chair Jerome Powell is also set to deliver a speech in Washington, which could serve as a major catalyst for market movement.
To wrap up the week, markets await Friday’s release of the preliminary University of Michigan Consumer Sentiment Index for May—a report often viewed as a psychological gauge of American consumer behavior.
$TRUMPUSDT Breakout Alert!$TRUMP has officially broken above its descending trendline after holding firm support around $11.8. The price also reclaims the 100 EMA (orange line), signaling strength and potential for a trend reversal.
📈 Technical Highlights:
Downtrend breakout confirmed ✅
Retest of resistance turned support around $13.3 ✅
Targets in sight:
• TP1: $16.52
• TP2: $21.04
• TP3: $26.35
This breakout setup remains valid as long as TRUMPUSDT holds above $13.3. A clean trendline flip often leads to explosive follow-throughs.
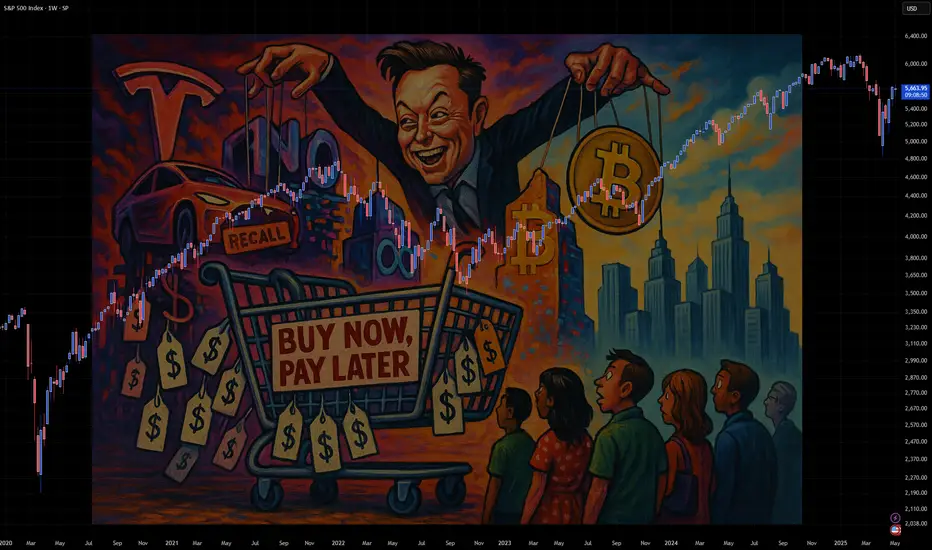
The Illusion of Value: How the U.S. Market Became a Fantasy EconThe Illusion of Value: How the U.S. Market Became a Fantasy Economy
For decades, the American economy has been celebrated as the epicenter of innovation, wealth creation, and corporate success. But beneath the surface, an unsettling reality has emerged: The U.S. financial markets are increasingly driven by speculation, hype, and a distorted sense of value.
"Buy Now, Pay Later"—A Culture of Delusion
One of the most glaring symptoms of this detachment from reality is the widespread adoption of "Buy Now, Pay Later" (BNPL) services. A staggering number of American consumers have embraced debt-financed spending as a normal part of life. Credit cards are no longer the primary vehicle for financial mismanagement—BNPL systems have convinced people they can afford luxuries they fundamentally cannot.
This mentality, in turn, feeds into the stock market’s obsession with future promises over actual output. Investors have become infatuated with narratives rather than numbers, driving valuations to unrealistic highs for companies that either underdeliver or simply do nothing at all.
The MicroStrategy Paradox: Borrowing Money to Buy Bitcoin
Take MicroStrategy, for example—a company whose sole business model seems to be leveraging borrowed capital to buy Bitcoin. By traditional metrics, MicroStrategy offers no tangible product, no innovative service, no groundbreaking technology—just speculative accumulation. Yet, thanks to Bitcoin hype, its stock price is valued as if it’s a revolutionary player in the corporate world.
This irrational valuation mirrors the broader issue with American markets: Companies are being rewarded not for what they actually do, but for the financial games they play.
The Myth of Overvalued Titans: Tesla & Meta
Tesla and Meta serve as the poster children of speculative overvaluation.
- Tesla: Once hailed as an automotive disruptor, Tesla’s stock price often reflects what Elon Musk promises rather than what Tesla delivers. From self-driving software that never fully materialized to mass production goals that fell flat, Tesla’s ability to sustain its valuation relies more on Musk’s cult-like following than automotive success. Meanwhile, the gutting of regulatory oversight has allowed Tesla to push unfinished, potentially hazardous products into the market.
- Meta: Meta’s valuation has ballooned largely on the promise of virtual reality dominance. Yet, billions poured into the Metaverse have yielded little beyond overpriced VR headsets and gimmicky social spaces.
Elon Musk: The Master of Market Manipulation
Elon Musk’s influence on financial markets cannot be overstated. Through cryptic tweets, grand promises, and regulatory maneuvering, Musk has become a force powerful enough to shift markets with mere words. Whether it’s pumping Dogecoin, slashing Tesla’s safety oversight, or influencing government policy for personal gain, Musk operates in a reality where market value is dictated by his persona rather than corporate fundamentals.
The Rise of True Value Markets
While the U.S. economy indulges in financial fantasy, other global markets have started to present compelling opportunities:
- Europe: A more realistic, fundamentals-based approach to valuation is emerging. Traditional industries remain resilient, and companies must show actual profitability to attract investment.
- China: Despite regulatory challenges, China’s focus on industrial production, technological advancement, and infrastructure development gives its economy a sense of tangible progress.
- UK & Australia: Unlike the speculative U.S. markets, these economies remain grounded in earnings, productivity, and rational valuations.
Conclusion
The American financial landscape has become a speculative playground detached from reality. Companies are valued not for what they produce, but for what they promise, what they borrow, and what narratives they spin. Figures like Musk exploit market sentiment, while deregulation enables corporations to operate recklessly. As Europe, China, the UK, and Australia foster economies built on real value, the U.S. is at risk of crashing under the weight of its illusions.
SP:SPX TVC:DXY INDEX:BTCUSD TVC:GOLD NASDAQ:MSTR NASDAQ:TSLA NYSE:BLK NASDAQ:META XETR:DAX FTSE:UKX TVC:HSI SET:SQ NASDAQ:PYPL NASDAQ:AFRM NASDAQ:AAPL NASDAQ:AMZN NASDAQ:NVDA NASDAQ:COIN NASDAQ:HOOD
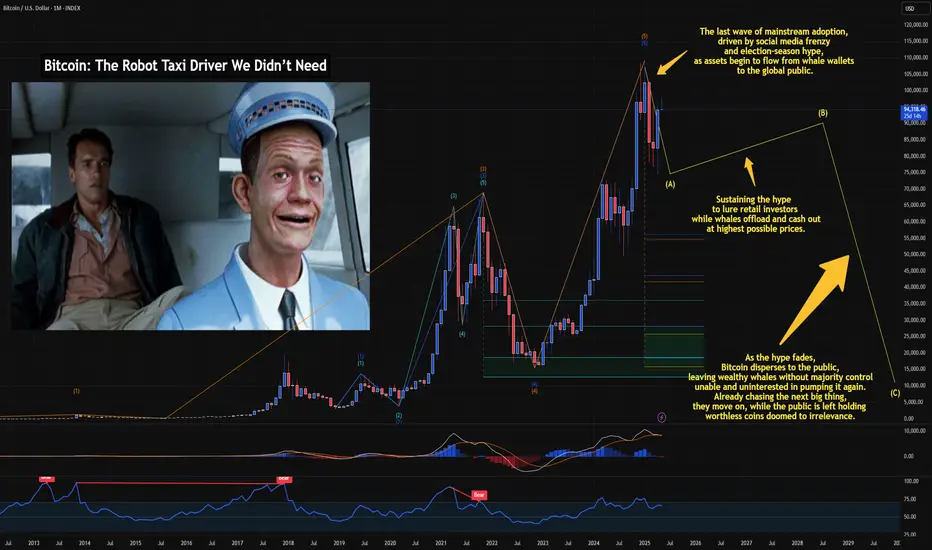
Bitcoin: The Robot Taxi Driver We Didn’t NeedWhy Blockchain Is Driving the Future Without It
In the 1990 sci-fi classic Total Recall, Arnold Schwarzenegger’s character hails a futuristic taxi only to be greeted by “Johnny Cab”—a creepy, clunky robot driver that awkwardly talks while struggling to navigate.
Back then, audiences imagined a future where robotic taxi drivers would be commonplace. But instead, we got something far superior: fully autonomous, self-driving cars that render robot drivers unnecessary.
The same is happening with Bitcoin. It was revolutionary, sure—but much like Johnny Cab, it’s outdated, inefficient, and rapidly becoming irrelevant in a world driven by advanced blockchain technology.
Bitcoin: The Nostalgic First Step
When Bitcoin burst onto the scene, it felt groundbreaking—just like the idea of robot taxi drivers in the Total Recall era. It gave us a new way to transact, free from centralized banks. People were thrilled, seeing it as the future of money.
But here’s the problem: Bitcoin was never the endgame. It was merely the proof-of-concept—like Johnny Cab showing that, yes, you can put a robot behind the wheel… but does that mean we should?
As financial systems evolved, Bitcoin’s shortcomings became glaringly obvious:
✅ Slow transaction speeds
✅ High fees
✅ Lack of scalability
✅ Energy inefficiency
Meanwhile, blockchain technology—the real revolution—kept advancing, proving that we don’t actually need Bitcoin any more than we needed Johnny Cab.
Enter Blockchain: The Self-Driving System
Self-driving cars didn’t need robot taxi drivers, and blockchain doesn’t need Bitcoin.
Blockchain is the foundation—an autonomous, self-sustaining system that underpins everything from finance to supply chains to digital assets.
In fact, precious metals, equities, and commodities are all moving toward digitization—but not through Bitcoin. Instead, they’re being integrated directly into blockchain-based ecosystems that offer seamless, smart contract-driven transactions.
The result?
💨 Faster
💡 More efficient
🛠️ Scalable & adaptable
Bitcoin, on the other hand, is stuck in the past. It’s clunky, expensive, and increasingly unnecessary—just like a robot taxi driver frantically punching buttons while self-driving cars smoothly navigate the streets.
Why Bitcoin Will Be Left Behind
Much like how we skipped the “robot taxi driver phase” and went straight to autonomous vehicles, the financial world will soon skip Bitcoin entirely as blockchain technology takes over.
Everything digital is moving toward streamlined, automated systems—systems that don’t require Bitcoin as an intermediary.
So the real question isn’t, “Will Bitcoin survive?”
It’s: “Why would we even need it?”
Just like Johnny Cab in Total Recall, Bitcoin might be fun to look back on—but it’s not the future.
Blockchain is the self-driving car. Bitcoin is the unnecessary robot driver.
And in a world that values efficiency, guess which one we’re leaving behind? 🚗💨
INDEX:BTCUSD CRYPTO:BTCUSD NASDAQ:COIN NASDAQ:MSTR NASDAQ:MARA TVC:GOLD TVC:SILVER TVC:DXY SP:SPX NYSE:BLK NASDAQ:TSLA NYSE:GME INDEX:ETHUSD CRYPTO:XRPUSD CRYPTO:ADAUSD