#TRUMPUSDT — Breakdown or Reversal Confirmation🚀 BYBIT:TRUMPUSDT.P — Breakdown or Reversal Confirmation? Full Breakdown on 1H & 4H!
Let’s start by analyzing the charts on different timeframes:
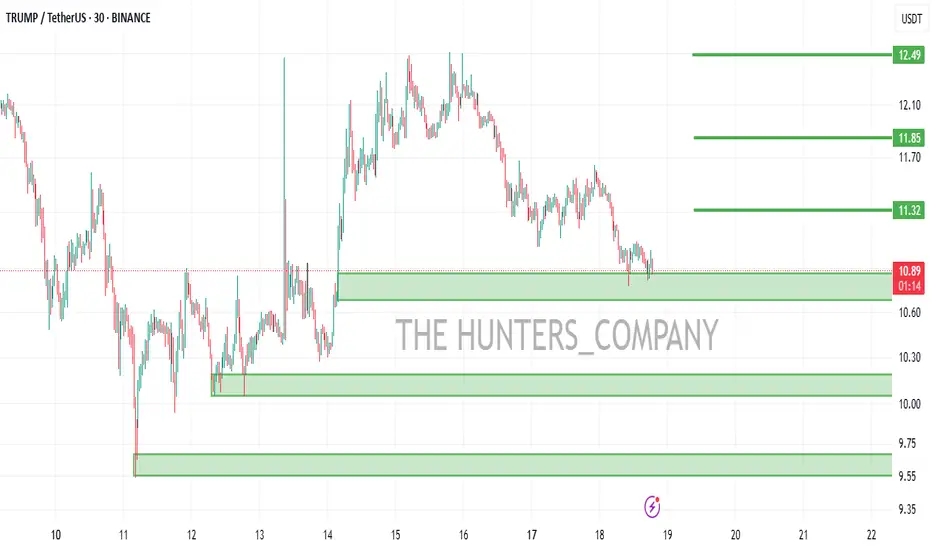
✅ On the 1H chart , we clearly see a reversal pattern — Inverted Head & Shoulders — and the neckline breakout has already occurred. The volume on the breakout is high, which confirms the strength of the signal.
➡️ The target for this pattern is around $10.75–$10.80, which also aligns with the upper VPOC level from the previous range.
➡️ The POC level for BYBIT:TRUMPUSDT.P is $10.159, which may now act as support — this can be a potential entry zone.
➡️ Nearest resistance is at $10.40. A breakout above this level could trigger an impulse move towards $10.75–$10.80.
✅ On the 4H chart , a bearish flag is forming, which could potentially push the price lower — but this scenario hasn't played out yet.
➡️ There's also a local double bottom, confirmed by a price bounce. A retest of the flag’s lower boundary will be a key moment.
Let’s break down the patterns:
✅ 1. Inverted Head & Shoulders (1H) – A classic bottom reversal formation.
➡️ The neckline breakout occurred on increased volume — a key confirmation for a long setup.
✅ 2. Volume (Volume Profile & Bars) – Strong volume spike during the breakout confirms buyer interest.
✅ 3. Price broke out of consolidation – We’ve seen an impulsive breakout and the price is holding above the neckline.
✅ 4. Local Market Structure Break (MSB) – A shift from local downtrend to an emerging uptrend.
📍 Key Point: If the price holds above $10.40, this confirms a breakout from the descending channel, increasing the chance of reaching $10.75–$11.00.
📍 Price must also stay above $10.15 and not fall back into the previous range. A retest and bounce from this level would serve as further confirmation.
📢 If the price drops back below $10.15 and breaks $9.87, the “Inverted Head & Shoulders” pattern will be invalidated. In that case, a bearish trend will likely resume and a short toward $9.50–$9.00 could be considered.
📢 On the 4H chart, the risk of the bearish flag playing out still remains. We are monitoring the structure closely — a sharp pullback is possible.
📢 The volume zone around $10.15–$10.20 is key. As long as the price stays above it — the long scenario remains dominant.
🚀 As of now, BYBIT:TRUMPUSDT.P has strong technical reasons to support a long bias, especially if it holds above $10.40 — that would open the door to $10.75–$11.00.
Risks remain — particularly around the 4H bearish flag — but for now, bullish momentum prevails.
🚀 BYBIT:TRUMPUSDT.P still holds upside reversal potential — LONG scenario remains the priority!
Trumptrade

Official Trump price analysis$Trump coin will probably only go off when and if Trump wins the Nobel Peace Prize. And for this to happen, his activities and rhetoric must change completely... at the moment, it looks "on the verge of fantasy."
Meanwhile: A major investor lost money on TRUMP again - this time $3.3m, he sold 743,947 TRUMP for $7.92m, but did so at a loss.
The irony is that at the very beginning of trading this token, he earned $11.82 million. However, a series of unsuccessful trades resulted in serious losses - now his total loss on $TRUMP has reached $15.7 million.
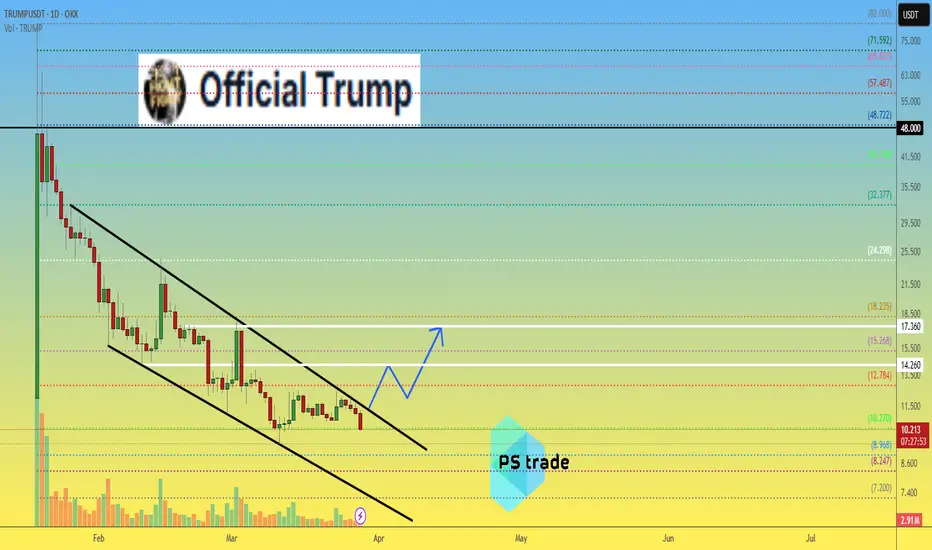
1️⃣ If by some miracle OKX:TRUMPUSDT manages to break out above the trend price, then we can dream of $14.26 and $17.36
2️⃣ А if, again, he writes, or says, or does something stupid, which is more likely for this personality.... then #Trump at $7-7.2, why not.
Ten times less than the highs... that's where the success is!)
Breaking: $TRUMP Token Dips 10% Reverting to $10 ZoneThe price of OFFICIAL TRUMP coin ($TRUMP) tanked 10% today, falling back to the $10 region. The asset ever since peaking to an all time high of $76, faced insane selling pressure losing about 80% of total value together with its compatriot $MELANIA coin.
For Weeks now, $TRUMP has been circumventing in the $10- $12 zone albeit the crypto market was most of the time in a bloodbath season. For $TRUMP coin, should the bulls push the token above the 38.2% Fibonacci retracement point, that may be the catalyst the token needs to spark a bullish renaissance as hinted by the Relative Strength Index (RSI) at 30- pointing at the disparity $TRUMP has to capitalise and make a bullish move.
Similarly, the 1-month low is serving as support point for $TRUMP should extreme selling pressure push the token lower.
OFFICIAL TRUMP Price Live Data
The live OFFICIAL TRUMP price today is $10.21 USD with a 24-hour trading volume of $517,239,338 USD. OFFICIAL TRUMP is down 8.71% in the last 24 hours. The current CoinMarketCap ranking is #45, with a live market cap of $2,041,294,317 USD. It has a circulating supply of 199,999,430 TRUMP coins and a max. supply of 999,999,993 TRUMP coins.

Gold Prices Doubled in 5 years. What Does It 'Historically' MeanOver the past five years, Gold prices OANDA:XAUUSD have experienced a significant surge, doubling in value over the past 5 years, from mid-March 2020 to mid-March 2025.
This is the 3rd time in history ever, the price of gold doubled in U.S. dollars (we counted only events when it has been observed first time only over 5-years time span).
🥇 The 1st time "A Doubling" event happened in the first quarter of 1973, when Gold hit $80 mark per ounce (google: "1973 Arab–Israeli War").
⚒ What happened next with Gold prices after that? - Hmm.. Gold doubled in price again! (and even more) over the next three years. Watch historical charts to learn more.
⚒ S&P500 Index folded in half over the same next three years.
🥇 The 2nd time "A Doubling" event happened more than 30 years later, in the first quarter of 2006 when Gold prices hit $500 barrier by the end of the year 2005, for the first time since 1987.
Some analysts blamed inflation in the US and concerns about the state of the global economy.
⚒ What happened next with Gold price after that? - Hmm.... Gold price also doubled in price again! (and even more) over next three years. Watch again historical charts to learn more.
⚒ S&P500 Index folded in half again over the same next three years (google: "2008 financial crisis").
🥇 Now is the 3rd time "A Doubling" event has happened with Gold prices, first time over last almost 20 years.
Several factors have contributed to this increase, including economic uncertainty, inflation fears, geopolitical tensions, central bank activity, and investment demand.
Economic Uncertainty: Times of economic turmoil often drive investors towards gold as a safe haven asset. The increase in global economic uncertainty has been a primary driver of gold's price surge.
Inflation: The threat of inflation also contributes to the rising price of gold. Investors often turn to gold as a hedge against the devaluation of fiat currencies during inflationary periods.
Geopolitical Tensions: Geopolitical instability encourages investors to seek safe-haven assets like gold. The Ukraine war, along with conflicts in the Middle East, have further fueled the rise in gold prices.
Central Bank Demand: Central banks' buying and easing cycles influence gold prices. Central banks often purchase gold to diversify their reserve holdings, and this demand can impact gold prices significantly.
Investment Demand: Demand from technology, jewelry, and investors influences gold prices. Gold price movements are sometimes driven by investor demand.
--
Best #GODL (Gold On Dear Life) wishes,
@PandorraResearch Team

TRUMP/USDT:BUY LIMITHello friends
Given the price growth, now that the price is correcting, you can buy in steps and be careful to ensure that capital management is followed.
*Trade safely with us*
US Cash Market Goes 'Flippant'. Understanding Revenge in TradingFirst of all, revenge trading is a destructive pattern of behavior in trading where individuals make impulsive and emotionally-driven decisions in an attempt to recoup previous losses. This practice is not limited to novice traders; even experienced traders can fall prey to it. The primary emotions driving revenge trading include anger, frustration, greed, fear, and shame, which cloud judgment and lead to irrational decision-making.
Causes of Revenge Trading
Emotional Response: Traders often react emotionally to significant losses, feeling compelled to immediately recover their losses without adequate analysis or strategy.
Lack of Discipline: Deviating from established trading plans and risk management principles is common in revenge trading.
Psychological Triggers: Feelings of injustice, anger, or a desire for vengeance against the market can trigger revenge trading.
Consequences of Revenge Trading
Financial Losses: Revenge trading often results in larger losses due to riskier trades and poor timing.
Emotional Burnout: The stress and frustration from repeated losses can lead to emotional exhaustion and decreased trading performance.
Career Impact: Persistent revenge trading can erode confidence and lead to a trader questioning their abilities.
Real-Life Examples of Revenge Trading
Increasing Position Size: A trader experiences a significant loss and decides to double or triple their position size in the next trade, hoping to quickly recover their losses. This action disregards risk management principles and often leads to even greater losses.
Ignoring Stop-Loss Orders: After a loss, a trader might hold onto a losing position longer than planned, hoping it will turn around. This behavior ignores established stop-loss orders and can result in further financial damage.
Chasing Trades: A trader feels compelled to enter trades without proper analysis, driven by the urge to recoup losses quickly. This impulsive behavior can lead to a series of poor trading decisions.
Market Reversal Scenario: A trader suffers a loss due to a sudden market reversal. In an attempt to recover, they enter a trade in the opposite direction without thorough analysis, which can exacerbate their losses.
Wish more examples? Watch recent one below 👇👇
How to Avoid Revenge Trading
To avoid revenge trading, traders should focus on maintaining discipline and adhering to their trading strategies. This includes:
Taking Breaks: After a loss, taking time to reassess the market and calm emotions can help prevent impulsive decisions.
Sticking to Plans: Adhering to established trading plans and risk management principles is crucial.
Emotional Awareness: Recognizing emotional triggers and taking steps to manage them can help prevent revenge trading.
In conclusion, revenge trading is a HARMFUL AND DANGEROUS practice that can lead to significant financial and emotional consequences. Understanding its causes and recognizing its signs are essential steps in avoiding this behavior and maintaining a successful trading career.
--
Best wishes,
@PandorraResearch Team 😎
XAUUSD: Battle for New Highs – Bullish or Bearish?🚨 Attention Traders!🚨
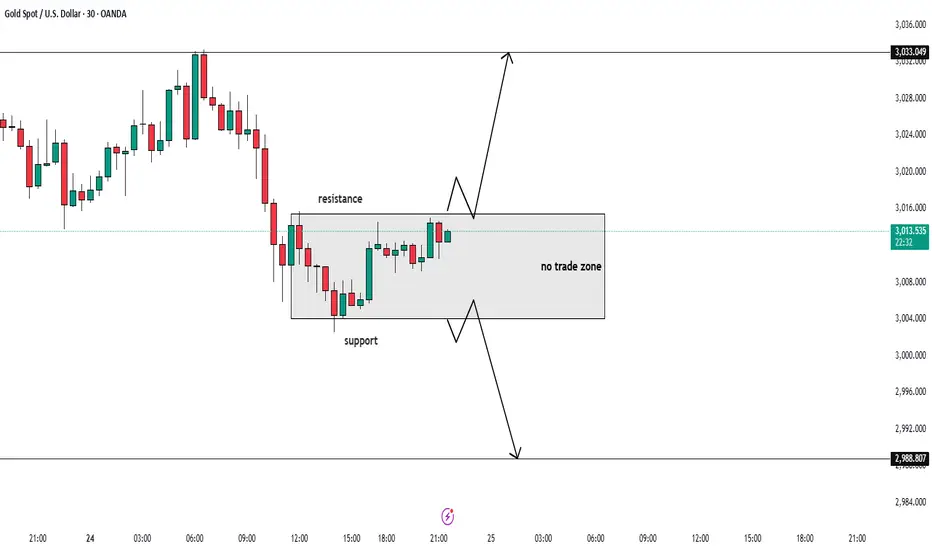
🔥 XAUUSD is on FIRE! Price action is 🔥, and we're seeing a major battle at 3004 - 3014! Will it break out?
Bearish Alert 📉: If price dips below this zone, we could see targets around 2988 and 2998. Keep an eye on these support levels!
Bullish Opportunity 📈: A breakout above 2911 could lead to buying opportunities! Watch for moves above 3025 with targets at 3035 and 3050.
💬 Join the convo! Share your thoughts & strategies — let’s ride the gold wave together and catch these opportunities! 🚀✨
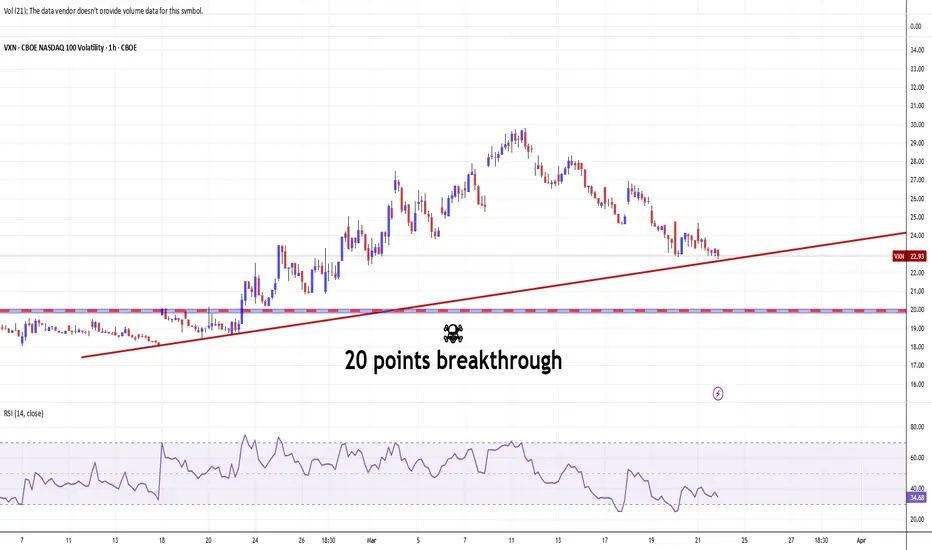
Nasdaq 100 Volatility. US Tech Stocks Remain 'Runoff Smelling'It's gone two months or so... (Duh..? WTF.. only two monts, really? 😸) since comrade Trump entered The White House (again).
Everyone was on a rush, chatting endless "Blah-Blah-Blah", "I-crypto-czar", "crypto-capital-of-the-world", "we-robot", "mambo-jumbo", "super-duper", AI, VR and so on hyped bullsh#t.
- And now?..
- It's gone. It's absolutely gone..!
Leveraged bets and crypto assets turned into Bearish market; all four major US indices (S&P500, DJIA, Nasdaq 100 and Russell 2000) are negative over the past two months, while Gold OANDA:XAUUSD has doubled in price over the past 5 years (4th time in history ever), and remain the only is premium positioned.
This is why we at our 💖 Beloved @PandorraResearch Team decided to paint this idea for Nasdaq 100 Volatility Index CBOE:VXN to emphasize (again) that nothing last forever and no one should chase a feather, or dust in the wind.
Broadly-known ominously among investors as the "fear index" and launched by the Chicago Board Options Exchange (now the Cboe) in 1993, the Volatility Index (VIX) is meant to present the market's expectation of volatility over the coming 30 days. The metric is derived from options prices on the S&P 500 Index and captures the anticipated swings that drive investor sentiment.
In recent years, the VIX has become a far more central index, especially during periods of financial turbulence, such as the 2008 financial crisis and the COVID-19 pandemic. During these stretches, spikes in the VIX reflected widespread anxiety; during others, it's been a crucial barometer for market participants seeking a glimpse into investors' collective psyche. When the VIX is low, this suggests calm seas ahead. When it spikes, it signals approaching storms.
Every single stock index do have its own volatility.
This story (again) is about Cboe NASDAQ-100 Volatility Index CBOE:VXN
The Cboe NASDAQ-100 Volatility Index (VXN) is a key measure of market expectations of near-term volatility conveyed by NASDAQ-100 Index (NDX) option prices. It measures the market's expectation of 30-day volatility implicit in the prices of near-term NASDAQ-100 options. VXN is quoted in percentage points, just like the standard deviation of a rate of return, e.g. 19.36. Cboe disseminates the VXN index value continuously during trading hours.
The VXN Index is a leading barometer of investor sentiment and market volatility relating to the NASDAQ-100 Index.
Learn more about Methodology for Calculation of the VXN Index, using official CBOE website.
Technical observations
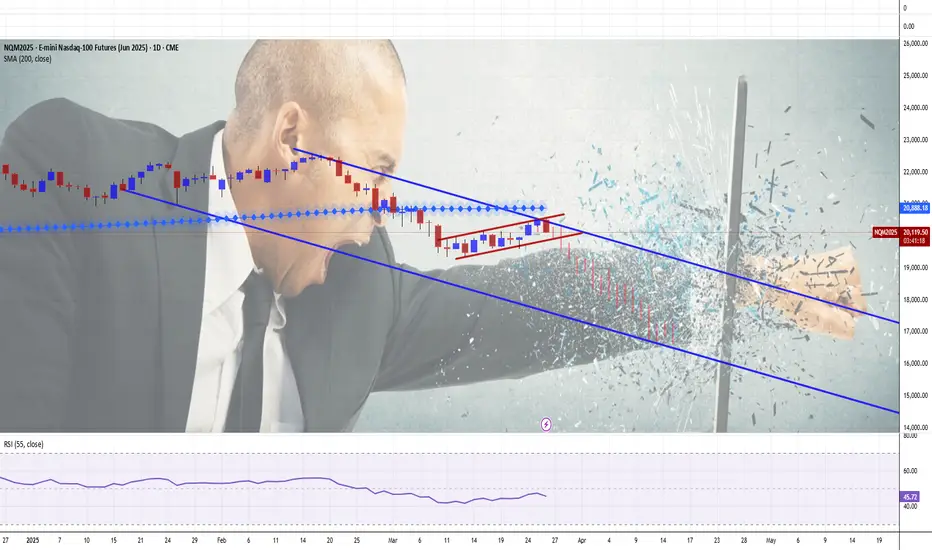
The main technical graph indicates that CBOE:VXN Index has recently jumped to current 'above 20' basic points.
In nowadays 'above 20' VXN levels indicate on further potentail Bearish progress in US Tech Stocks (Nasdaq 100 Index NASDAQ:NDX ).
--
Best wishes,
@PandorraResearch Team
TRUMP(UPDATE)Hello friends
Given the good price growth, now in the pullbacks that the price makes, we can buy in the specified support areas and move with it to the specified targets.
Of course, with capital and risk management...
*Trade safely with us*
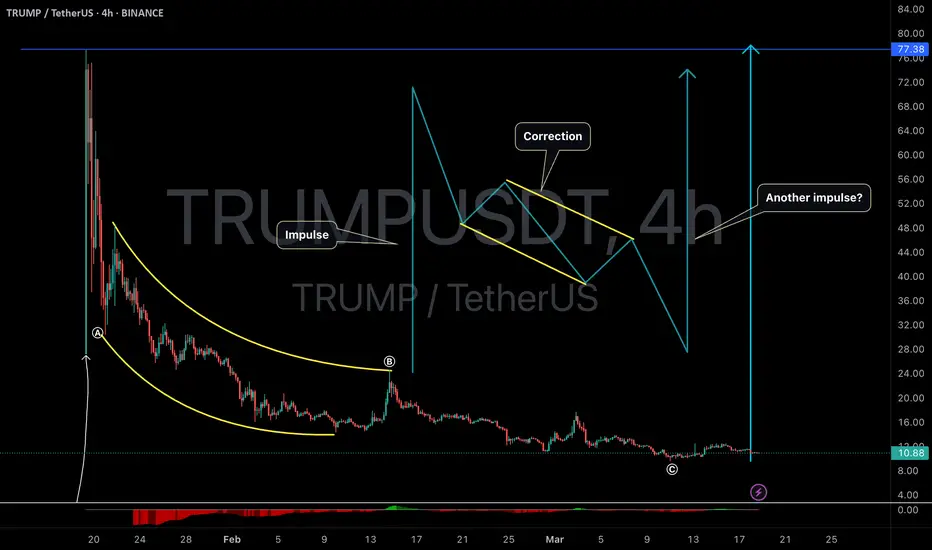
TRUMP MEME COIN TO $77 – LAMBO SEASON IS WILL BE HERE!I just did what any rational investor would do… SOLD MY CAR TO GO ALL-IN ON TRUMP COIN! 🚗➡️🚀 Because who needs wheels when you’re aiming for a Lamborghini by year-end?
Currently sitting at $10, this absolute rocket ship is gearing up for a 777% move to $77—a number so patriotic it might just get its own national holiday. Elliott Wave 2.0, Fibonacci magic, and pure meme momentum all align for a face-melting rally!
🔥 Catalysts fueling the moon mission:
✅ 2024 election hype = infinite liquidity
✅ Meme magic = unstoppable retail FOMO to kick in
✅ "Only up" is my new trading strategy
By the end of the year, we’re either driving Lambos or explaining to Uber drivers how we were “early”. ALL IN, BABY! 🚀🇺🇸
Soybeans: Deja Vu all over againCBOT: Micro Soybean Futures ( CBOT_MINI:MZS1! )
Let’s rewire the clock back for seven years. In 2018, trade tensions escalated between the US and China, resulting in a series of tariffs and retaliations.
On July 6, 2018, US imposed a 25% tariff on $34 billion of Chinese imports. On the same day, China immediately hit back with 25% tariff on equal value of US goods.
American soybeans were among the hardest hit by tariffs. The United States has been the largest soybean producer in the world. According to USDA data, American farmers produced 120 million metric tons of soybeans in 2017, contributing to 35.6% of the world production. About 48.2%, or 57.9 metric tons, were exported to the global market, making US the second largest soybean exporter after Brazil.
China is the largest soybean consumer and importer. In 2017, it imported 94 million metric tons of soybeans, accounting for 61.7% of the global imports. Brazil and the US were the largest sources of China’s imports, with 53% and 34% shares, respectively.
Tariffs on US soybeans punished American farmers. Total tariff level was raised from 5% to 30%. As a result, the FOB cost to Shenzhen harbor in southern China hiked up 700 yuan (=$110) per ton. This made US soybeans 300 yuan more expensive than imports from Brazil.
Tariffs priced American farmers out of the Chinese market. According to USDA Foreign Agricultural Service, China imported 1,164 million bushels of US soybeans in 2017. By 2018, China import dropped 74% to 303. While US exports recovered to 831 in 2019, it did not resume to the pre-tariff level until the signing of US-China trade agreement. CBOT soybean futures plummeted 15-20% in the months after the tariffs were imposed.
US farmers incurred huge losses from both reduced sales and lower prices. The following illustration is an exercise of our mind, not from actual export data.
• Without trade tensions, we assume exports of 1,164 million bushels each in 2018 and 2019, at an average price of $105 per bushel. This comes to a baseline export revenue of $244.4 billion for both years combined.
• Tariffs lowered export sales to 1,134 million bushels for the two-year total, at an average price of $87. Thus, the tariff-impacted revenue data comes to $98.6 billion.
• The total impact on soybean sales volume would be -51%, from 2,328 down to 1,134.
• The total impact on export revenue would be -60%, from $244.4 to $98.6 billion.
It is déjà vu all over again.
In February 2025, the Trump administration announced 10% additional tariffs on Chinese goods. This was raised by another 10% in March, setting the total to 20%.
To retaliate against US tariffs, China imposed import levies covering $21 billion worth of U.S. agricultural and food products, effective March 10th. These comprised a 15% tariff on U.S. chicken, wheat, corn and cotton and an extra levy of 10% on U.S. soybeans, sorghum, pork, beef, aquatic products, fruits and vegetables and dairy imports.
This is just the beginning. In the last trade conflict, average US tariff on Chinese imports was raised from 4% to 19%. Now we set the starting point at 39%. How high could it go? From history, we learnt that this could go for several rounds before it settles.
Trading with Micro Soybean Futures
On March 11th, USDA published its World Agricultural Supply and Demand Estimates (WASDE) report. Both the U.S. and global 2024/25 soybean supply and use projections are basically unchanged this month, meeting market expectations.
In the last week, soybean futures bounced back by about 2%, recovered most the lost ground since China first announced the retaliative measures.
The latest CFTC Commitments of Traders report shows that, as of March 11th, CBOT soybean futures have total open interest of 810,374 contracts.
• Managed Money has 101,927 in long, 109,849 in short, and 108,993 in spreading positions.
• It appears that the “Small Money” spreads their money evenly, not knowing which direction the soybean market would go.
In my opinion, the futures market so far has completely ignored the possibility of a pro-long trade conflict with China.
• Seriously, ten percent is just the start. What if the tariff goes to 30% like in 2018?
• How would soybean prices react to a 50% drop in US soybean exports?
Anyone with a bearish view on soybeans could express it by shorting the CBOT micro soybean futures (MZS). These are smaller-sized contracts at 1/10 of the benchmark CBOT soybean futures. At 500 bushels per contract, market opportunities are more accessible than ever with lower capital requirements, an initial margin of only $200.
Coincidently, Friday settlement price of $10.17 for May contract (MZSK5) is identical to the soybean futures price of $10.40 immediately prior to the 2018 tariff.
History may not repeat, but it echoes . At the last time, the tariff on soybeans saw futures prices plummeting 20% within a month. If we were to experience the same, soybeans could drop to $8.00. This is a likely scenario if tariffs were to rise higher.
Hypothetically, a decline of $2 per bushel would cause a short futures position to gain $1,000, given each micro contract has a notional of 500 bushels.
The risk of short futures is the continuous rise in soybean prices. The trader would be wise to set a stoploss at his sell order. For example, a stop loss at $10.50 would set the maximum loss to $165 (= (10.50-10.17) x 500), which is less than the $200 initial margin.
To learn more about all Micro Ag futures contracts traded on CME Group platform, you can check out the following site:
www.cmegroup.com
Happy Trading.
Disclaimers
*Trade ideas cited above are for illustration only, as an integral part of a case study to demonstrate the fundamental concepts in risk management under the market scenarios being discussed. They shall not be construed as investment recommendations or advice. Nor are they used to promote any specific products, or services.
CME Real-time Market Data help identify trading set-ups and express my market views. If you have futures in your trading portfolio, you can check out on CME Group data plans available that suit your trading needs tradingview.sweetlogin.com

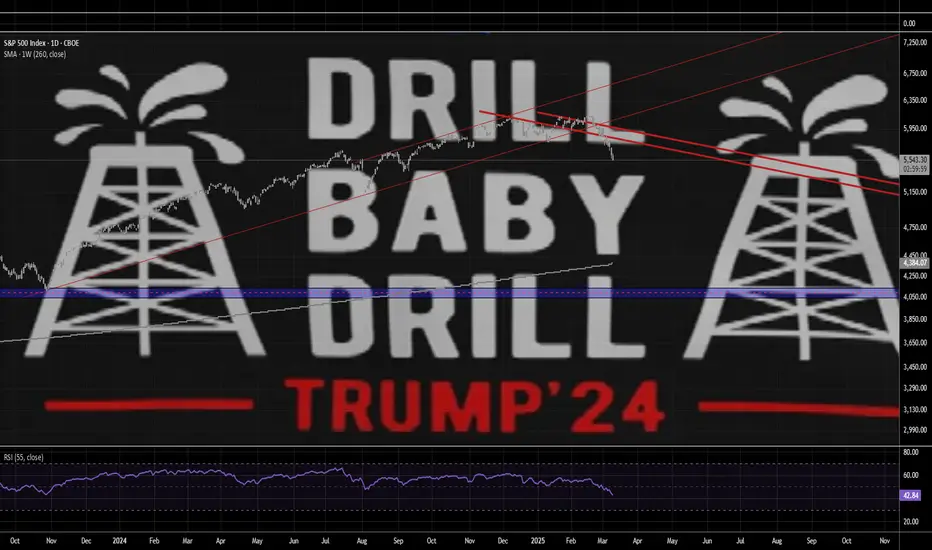
S&P500 Index Goes 'DRILL BABY DRILL' Mode due to Tariffs BazookaThe Trump administration's aggressive use of tariffs — we termed at @PandorraResearch Team a "Tariff' Bazooka" approach due to their broad, unilateral application — has exerted significant downward pressure on the S&P 500 index through multiple channels. These include direct impacts on corporate profitability, heightened trade war risks, increased economic uncertainty, and deteriorating market sentiment.
Direct Impact on Corporate Earnings
Tariffs raise costs for U.S. firms reliant on imported inputs, forcing them to either absorb reduced profit margins or pass costs to consumers. For example, intermediate goods like steel and aluminum—key inputs for manufacturing—face steep tariffs, squeezing industries from automakers to construction. Goldman Sachs estimates every 5-percentage-point increase in U.S. tariffs reduces S&P 500 earnings per share (EPS) by 1–2%. The 2025 tariffs targeting Canada, Mexico, and China could lower EPS forecasts by 2–3%, directly eroding equity valuations6. Additionally, retaliatory tariffs from trading partners (e.g., EU levies on bourbon and motorcycles) compound losses by shrinking export markets.
Trade Escalation and Retaliation
The EU’s threat to deploy its Anti-Coercion Instrument—a retaliatory tool designed to counter trade discrimination—could trigger a cycle of tit-for-tat measures. For instance, Canada and Mexico supply over 60% of U.S. steel and aluminum imports, and tariffs on these goods disrupt North American supply chains. Retaliation risks are particularly acute for S&P 500 companies with global exposure: 28% of S&P 500 revenues come from international markets, and prolonged trade wars could depress foreign sales.
Economic Uncertainty and Market Volatility
The U.S. Economic Policy Uncertainty Index (FED website link added for learning purposes) surged to 740 points early in March 2025, nearing levels last seen during the 2020 pandemic. Historically, such spikes correlate with a 3% contraction in the S&P 500’s forward price-to-earnings ratio as investors demand higher risk premiums. Trump’s inconsistent tariff implementation—delaying Mexican tariffs after negotiations but accelerating others—has exacerbated instability. Markets reacted sharply: the S&P 500 fell 3.1% in one week following tariff announcements, erasing all post-election gains.
Recession Fears and Sector-Specific Pressures
Tariffs have amplified concerns about a U.S. recession. By raising consumer prices and disrupting supply chains, they risk slowing economic growth—a fear reflected in the S&P 500’s 5% decline in fair value estimates under current tariff policies. Industries like technology (dependent on Chinese components) and agriculture (targeted by retaliatory tariffs) face acute pressure. For example, China’s tariffs on soybeans and pork disproportionately hurt rural economies, indirectly dragging down broader market sentiment.
Long-Term Structural Risks
Studies show tariffs fail to achieve their stated goals. MIT research found Trump’s 2018 steel tariffs did not revive U.S. steel employment but caused job losses in downstream sectors8. Similarly, the 2025 tariffs risk accelerating economic decoupling, as firms diversify supply chains away from the U.S. to avoid tariff risks. This structural shift could permanently reduce the competitiveness of S&P 500 multinationals.
Conclusion
In summary, Trump’s tariff strategy has destabilized equity markets by undermining corporate profits, provoking retaliation, and fueling macroeconomic uncertainty.
Overall we still at @PandorraResearch Team are Bearishly calling on further S&P 500 Index opportunities with further possible cascading consequences.
The S&P 500’s recent slump reflects investor recognition that tariffs act as a tax on growth—one with cascading consequences for both domestic industries and global trade dynamics.
--
Best 'Drill Baby, Drill' wishes,
@PandorraResearch Team 😎
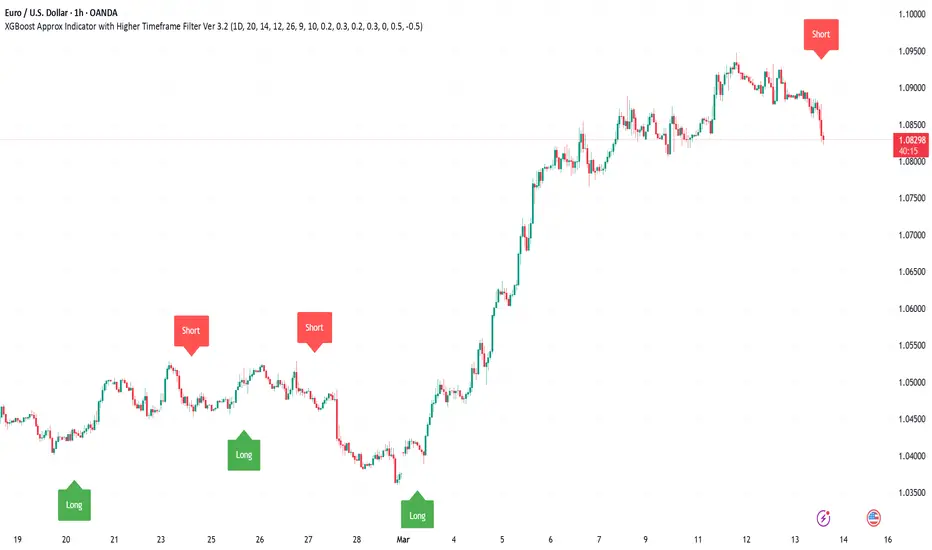
EURUSD gains bearish momentumAfter Trumpinho stated increasing he may increase wine taxes in case Canada do the same on whiskey. The financial turbulence is just winding up, as US PPI data appaered lower as previously expected. All EUR based pairs are turned down.
Ethereum — March 2025 Edition. The Lord Giveth and Taketh AwayWe have discovered already at @PandorraResearch Team a month ago or so in earlier published idea , that Donald Trump's recent policies and statements have generated significant negative sentiment towards Ethereum and the broader cryptocurrency market. As he resumes the presidency, his administration's approach to cryptocurrencies is expected to be more regulatory and cautious, which could impact Ethereum investors.
Donald Trump's actions and announcements have had a negative influence on Ethereum prices through several mechanisms.
Disappointment Over Strategic Bitcoin Reserve Order.
Trump's executive order to establish a Strategic Bitcoin Reserve was initially seen as a positive move, but it did not lead to immediate government purchases of cryptocurrencies. Instead, it focused on creating a budget-neutral strategy, which meant no taxpayer funds would be used for spot purchases in the short term. This lack of immediate action led to disappointment and selling in the market, affecting Ethereum's price.
"Pump & Dump" Effect.
Trump's rhetoric and announcements often create a "Pump & Dump" effect in the cryptocurrency market. This phenomenon involves a brief surge in prices followed by a sharp decline as investors realize there is no concrete action behind the rhetoric. Ethereum, along with other cryptocurrencies, experienced this volatility after Trump's statements about including Ethereum in a crypto reserve.
Trade Tensions and Tariffs.
Trump's tariff announcements have exacerbated global trade tensions, which negatively impact the broader financial markets, including cryptocurrencies. Ethereum has been particularly sensitive to these developments, experiencing significant price drops in response to tariff threats against major trading partners like Canada, Mexico, and China.
Market Volatility and Uncertainty.
Trump's unpredictable policies and statements contribute to market volatility and uncertainty. This environment can deter investors and lead to price fluctuations in Ethereum and other cryptocurrencies. The lack of clear regulatory guidance under his administration adds to the uncertainty, affecting investor confidence and Ethereum's price stability.
Technical challenge.
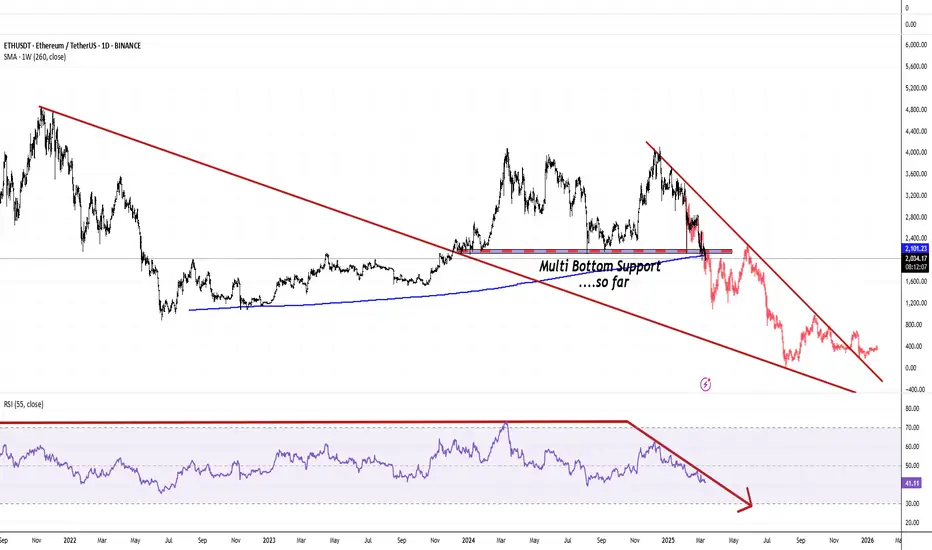
The main technical graph for Ethereum BITSTAMP:ETHUSD indicates on further Bearish trend in development (since mid-December 2024) with acceleration occurred a day before Mr. Trump entered the White House.
Previous key supports were considered as 100-week SMA (near $2550 per Ethereum), $2200 flat multi bottom and 5-years SMA (near $2100 per Ethereum), so all of them are broken to this time. That is why we believe (in this case of multi breakthrough), it could lead the Ethereum price much lower, as it described on the chart.
Conclusion.
Overall, Trump's influence on Ethereum prices is characterized by disappointment over unfulfilled expectations, market volatility driven by his rhetoric, and negative impacts from trade tensions and regulatory uncertainty.
--
Best 'Trump & Dump' wishes,
@PandorraResearch Team 😎
President Trump's World Liberty Financial partners with SUIPresident Trump's World Liberty Financial partners with SUI to launch a Strategic SUI Reserve a move that saw SUI surged 13% today with a speculated 100% surge in the short term should CRYPTOCAP:SUI break the $4 resistant zone, a 100% surge is inevitable.
The layer-1 blockchain platform designed to support the needs of global adoption by offering a secure, powerful, and scalable development platform had a great start of the year as it broke out surging to $5 early the start of the year.
Sui Price Live Data
The live Sui price today is $2.96 USD with a 24-hour trading volume of $1,481,325,553 USD. We update our SUI to USD price in real-time. Sui is up 18.74% in the last 24 hours, with a live market cap of $9,373,175,223 USD. It has a circulating supply of 3,169,845,047 SUI coins and a max. supply of 10,000,000,000 SUI coins.

TRUMP/USDT(BUY)hello friends
Due to the correction of the price and the breaking of the resistance, we can now buy with risk management and move to the specified goals.
*Trade safely with us*
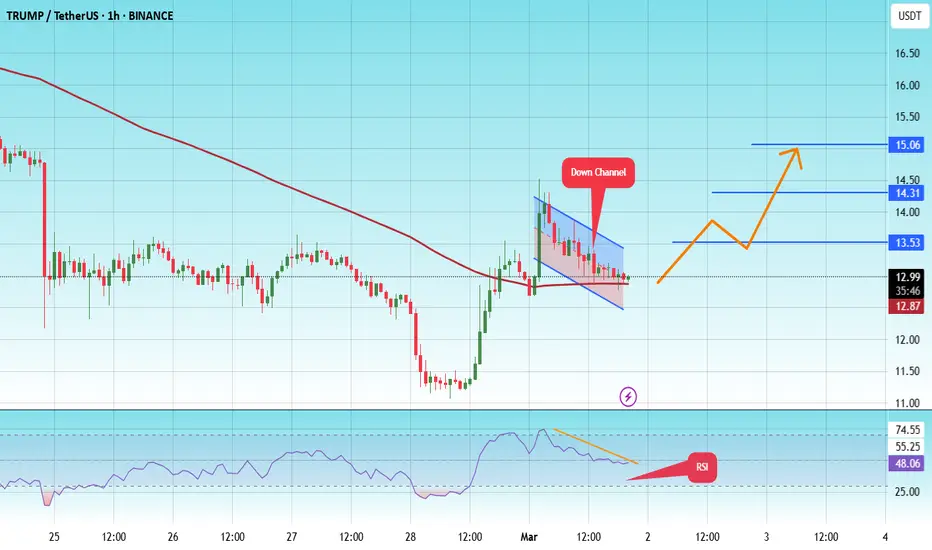
#TRUMP/USDT#TRUMP
The price is moving in a descending channel on the 1-hour frame and is expected to continue upwards
We have a trend to stabilize above the moving average 100 again
We have a descending trend on the RSI indicator that supports the rise by breaking it upwards
We have a support area at the lower limit of the channel at a price of 12.50
Entry price 13.00
First target 13.53
Second target 14.31
Third target 15.06
Bitcoin: A US Reserve CurrencyCME: Micro Bitcoin Futures ( CME:MBT1! )
On the morning of March 2nd, President Donald Trump posted a tweet to reinforce his commitment to a Crypto Strategic Reserve, including XRP, SOL and ADA.
Cryptocurrency market took off immediately. Despite not being mentioned in the tweet, Bitcoin shot up from $78,400 to $83,900, and Ethereum from $2,090 to $2,240.
Later in the afternoon, President Trump posted an update and clarified that BTC and ETH will be in the Reserve. “I also love Bitcoin and Ethereum!”, he tweeted.
At the time of this writing, BTC is quoted $94,308, up 20.3% since the first tweet. ETH is trading at $2,520, up 20.6% within the day.
We are in a new age of cryptocurrencies, where BTC, ETH, XRP, SOL and ADA just gained the official backing of the US Government. This day has been in the making for months.
• On May 24, 2024, then presidential candidate Trump promised to launch a national crypto stockpile if he wins the election. Investors warmed to this idea and Bitcoin lifted 18%
• On November 5, 2024, Trump won the US election. Market cheered for the most pro-crypto president and Bitcoin shot up 57% in a month
• On January 23, 2025, President Trump signed the “Executive Order to establish United States leadership on digital financial technology.” Bitcoin went up 17%
• Recent events have brought bitcoin down 28% since reaching its all-time-high of $109,241. In a matter of two tweets, the crypto market has completely turned around
Bitcoin for the Long Haul
A year ago, I published this market commentary, “A Bitcoin Bull Run?”, and laid out the key drivers for bitcoin’s long-term rise.
Limited supply, increased demand and excessive liquidity helped bitcoin prices doubled in a year. In my opinion, these tailwinds remains intact for bitcoin in the coming months. On top of these, we now have the explicit endorsement from a sitting US president. Therefore, I stay bullish for holding bitcoin for the long haul.
Trading with Micro Bitcoin Futures
On “HODL with a Twist”, published on May 6, 2024, I explored using Futures Rollover strategy to invest in CME Micro Bitcoin Futures ( LSE:MBT ). This strategy worked nicely in the past, and I favor to continue deploying it. The paragraphs below provide a brief update with new contract months and new price data.
Firstly, using futures over spot bitcoin provides these compelling advantages:
• Capital efficiency in using margins. A trader could invest with as little as $2,075 to take on the full exposure of $9,431 (1/10th of a bitcoin)
• Futures contracts come with build-in leverage. For MBT, it is approximately 4.5 times (= 9431/2075). If bitcoin moves 10% in your favor, you could gain 45% with futures
• Price protection. MBT has a daily price limit (limit-up and limit-down) at 10%. In a volatile day with big moves, the Exchange will pause trading at the prescribed limits
Secondly, futures contracts have a limited lifespan that will influence the outcome of your trades and exit strategy. Micro Bitcoin futures are traded actively in the nearby March and April contracts. Liquidity in the back-month contracts has yet to pick up.
Rollover is when a trader moves his position from the front month contract to another contract further in the future, prior to the expiration of his existing holding.
Below is an illustration on how to hold a long MBT position overtime:
• In March, a trader buys (going long) April contract (MBTJ5) at $94,308
• In April, the trader enters an offsetting trade, going short on MBTJ5, to close his existing position. He would book a profit or loss, determined by the difference in selling price and purchasing price
• Simultaneously, the trader would buy May MBT contract (MBTK5) and re-establish a long position in Bitcoin
• In May, the trader will close out MBTK5 (going short) and buy June (MBTM5)
• The trader would repeat the above steps, so far as he holds a bullish view
Finally, Bitcoin prices are extremely volatile. Holding spot Bitcoin with no leverage could face potential drawdown of 70%-80%. With the leverage in futures, a sharp price move in the wrong direction could quickly deplete the available fund and trigger margin calls.
Trader could set up a stop-loss in the buy order, limiting the maximum loss. Hypothetically, he could set the stop-loss at $85,000 when executing long futures at $94,308. If bitcoin moves sharply down, the maximum loss will be $931 (= (94308-85000)*0.1). His margin account will be decreased to $1,144 from $2,075.
To learn more about all the Micro futures and options contracts traded on CME Group platform, you can check out the following site:
www.cmegroup.com
Happy Trading.
Disclaimers
*Trade ideas cited above are for illustration only, as an integral part of a case study to demonstrate the fundamental concepts in risk management under the market scenarios being discussed. They shall not be construed as investment recommendations or advice. Nor are they used to promote any specific products, or services.
CME Real-time Market Data help identify trading set-ups and express my market views. If you have futures in your trading portfolio, you can check out on CME Group data plans available that suit your trading needs tradingview.sweetlogin.com

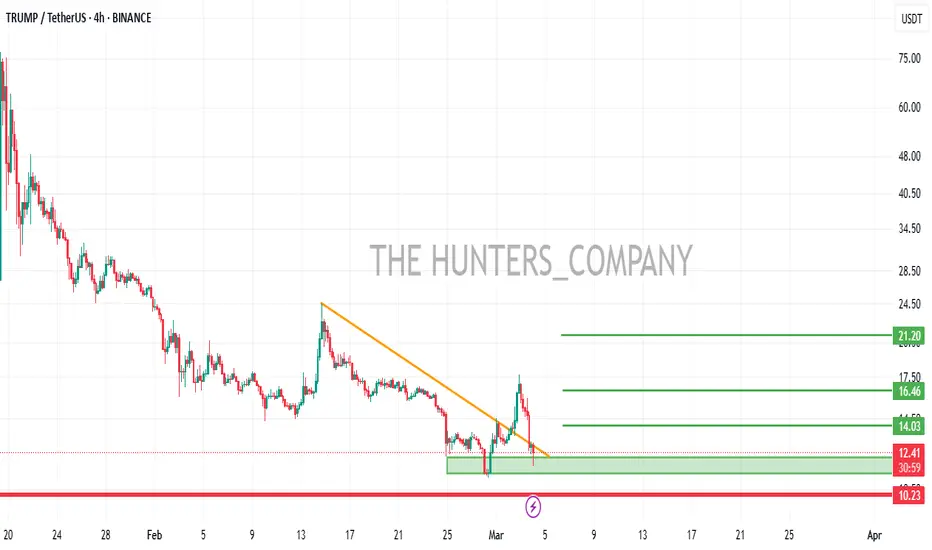
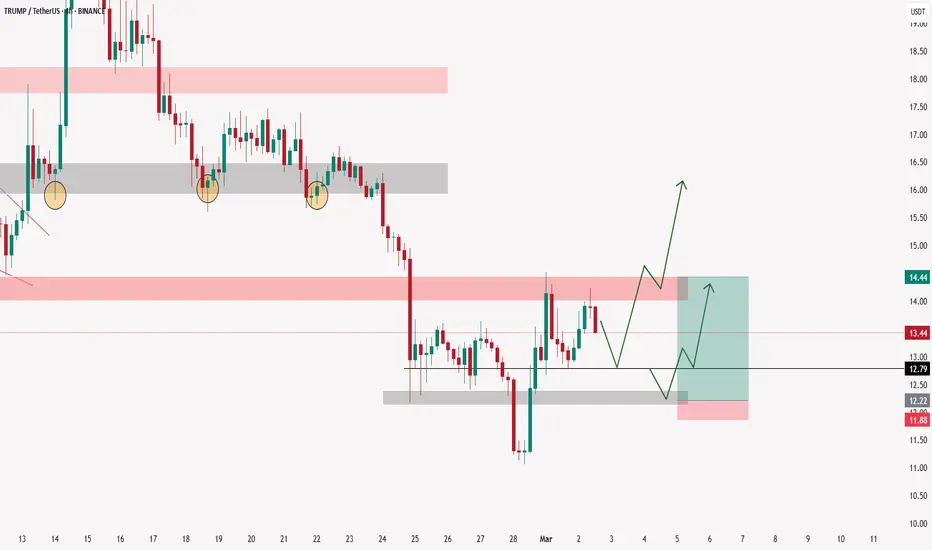
TRUMP COIN NEXT POSSIBLE MOVES AND TRADE IDEAS !!$TRUMP Coin Update & Possible Moves!!
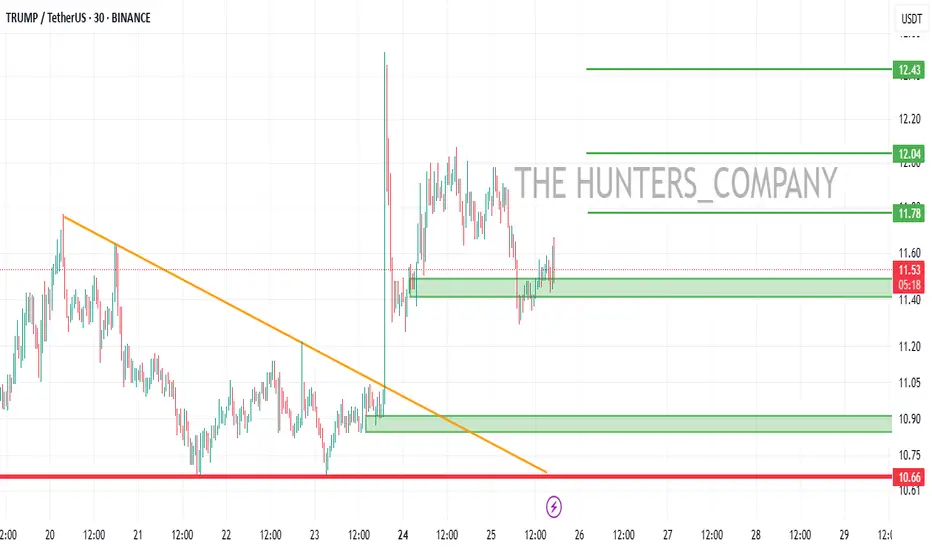
• Two Support areas are marked on chart 12.80$-12.30$ where you are able to build trade on it🫡
Warning : That's just my idea if i take trade i will Update.. DYOR Before Taking any action🚨
D
$TRUMP Coin on the Verge of a Major Breakout: Can It Reach $30?The cryptocurrency market is buzzing with excitement as $TRUMP coin approaches a critical resistance level. Currently trading near $17, the token has already broken a significant Break of Structure (BOS), hinting at a potential bullish surge. If $TRUMP successfully breaches this resistance point, technical indicators suggest a remarkable 200% rally, pushing the price toward $30.
Technical Analysis
A closer look at $TRUMP’s daily chart reveals key bullish signals:
The $17 mark has proven to be a significant resistance level. A confirmed breakout could trigger a strong uptrend, with $30 as the next major target. The Relative Strength Index (RSI) is currently at 48, indicating neutral momentum. However, with buying pressure increasing, RSI could soon move into the bullish zone, reinforcing the uptrend.
The token's recent candlestick formations suggest a bullish engulfing pattern, which often precedes a strong rally. The $11 price point has emerged as a crucial support level. If this level holds, bulls could maintain momentum. However, a break below $11 may lead to a strong sell-off.
Trump Organization’s Metaverse & NFT Plans
The Trump Organization has officially filed a trademark application for 'TRUMP' to launch a metaverse and NFT trading platform. This development aligns with the growing trend of Web3 adoption by prominent figures and institutions.
A metaverse and NFT ecosystem tied to the Trump brand could significantly increase interest in $TRUMP coin, driving speculative demand and institutional involvement. If the project gains traction, it could serve as a major long-term growth factor for the token’s valuation.
What’s Next for $TRUMP Coin?
With both technical and fundamental indicators aligning, $TRUMP coin is at a pivotal moment. The key level to watch remains the $17 resistance. A decisive breakout could ignite a major rally toward $30, while failure to hold above support at $11 might trigger a correction.

#TRUMPUSDT – Bearish Scenario, Breakout Down📉 SHORT BYBIT:TRUMPUSDT.P from $12.278
🛡 Stop Loss: $12.599
⏱ 1H Timeframe
⚡ Trade Plan:
✅ The BYBIT:TRUMPUSDT.P price has formed a Bearish Flag and broke its lower boundary, confirming a bearish scenario.
✅ The asset is trading below POC (Point of Control) at $12.978, indicating strong seller dominance.
✅ Increasing volume on the breakdown further confirms the strength of the downward move.
🎯 TP Targets:
💎 TP 1: $12.100
🔥 TP 2: $11.900
⚡ TP 3: $11.785
📢 A close below $12.278 would confirm further downside movement.
📢 POC at $12.978 is a strong resistance level that the price failed to break.
📢 Increasing volume on the drop supports the bearish outlook.
📢 Securing partial profits at TP1 ($12.100) is a smart risk-management strategy.
🚨 BYBIT:TRUMPUSDT.P remains in a downtrend – monitoring for continuation and securing profits at TP levels!
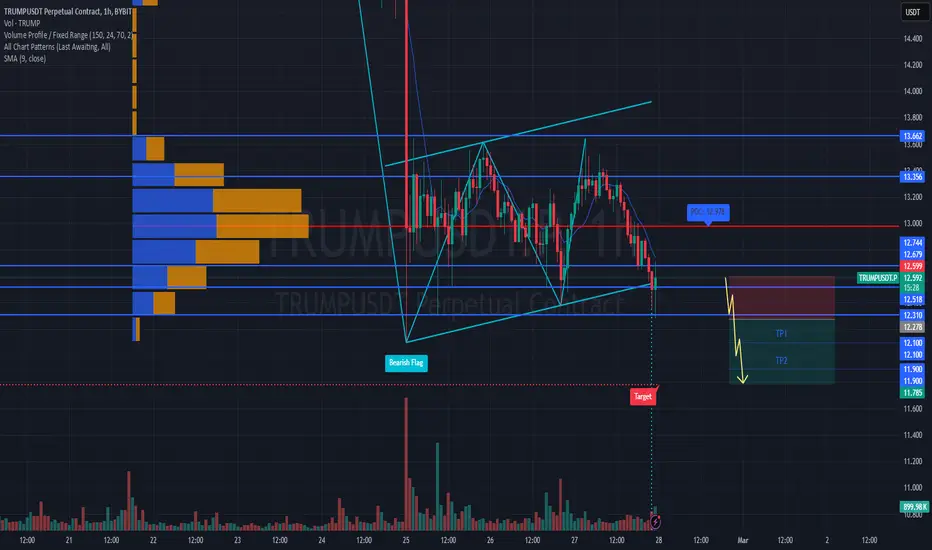
#TRUMPUSDT – Bearish Scenario, Expecting a Downward Breakout📉 SHORT BYBIT:TRUMPUSDT.P from $12.492
🛡 Stop Loss: $12.785
⏱️ 1H Timeframe
⚡️ Trade Plan:
✅ The BYBIT:TRUMPUSDT.P price continues to decline after a recent sharp drop.
✅ The chart shows that the asset is consolidating below POC (Point of Control) at $13.105, indicating seller dominance.
✅ The price is testing a support level, and a breakdown could trigger a stronger bearish move.
🎯 TP Targets:
💎 TP 1: $12.305
🔥 TP 2: $12.110
⚡️ TP 3: $11.966
📢 A close below $12.492 would confirm the downward move.
📢 POC at $13.105 is a key volume area that now acts as resistance.
📢 Increasing volume on the decline supports the bearish trend.
📢 Securing partial profits at TP1 ($12.305) is a risk-management strategy.
🚨 BYBIT:TRUMPUSDT.P remains under pressure – monitoring for a confirmed breakdown and securing profits at TP levels!

Long idea on $TRUMPI understand the nature of this instrument; it is volatile enough to wipe out anyone. Considering all factors—there's FUD, there's trash, and prices are low. Time to test the theory of probability
