TrumpUsdt accroding to VSFA+ Stratgy A.o.A All,
Accroding to VSFA+ Stratgy trumpusdt last retest before big drop, maybe moreee buyser traping i'm still waiting for 3$ to 5$ price velue, when Tmp testing this price velue then i buy some Drump coins & hold for long time in sha Allah....
TRUMPUSDT
#TRU/USDT Low Risk vs High Rewards#TRU
The price is moving within a descending channel on the 1-hour frame and is expected to break and continue upward.
We have a trend to stabilize above the 100 moving average once again.
We have a downtrend on the RSI indicator that supports the upward break.
We have a support area at the lower limit of the channel at 0.0285, acting as strong support from which the price can rebound.
We have a major support area in green that pushed the price upward at 0.0280.
Entry price: 0.0300
First target: 0.0314
Second target: 0.0328
Third target: 0.0350
To manage risk, don't forget stop loss and capital management.
When you reach the first target, save some profits and then change the stop order to an entry order.
For inquiries, please comment.
Thank you.

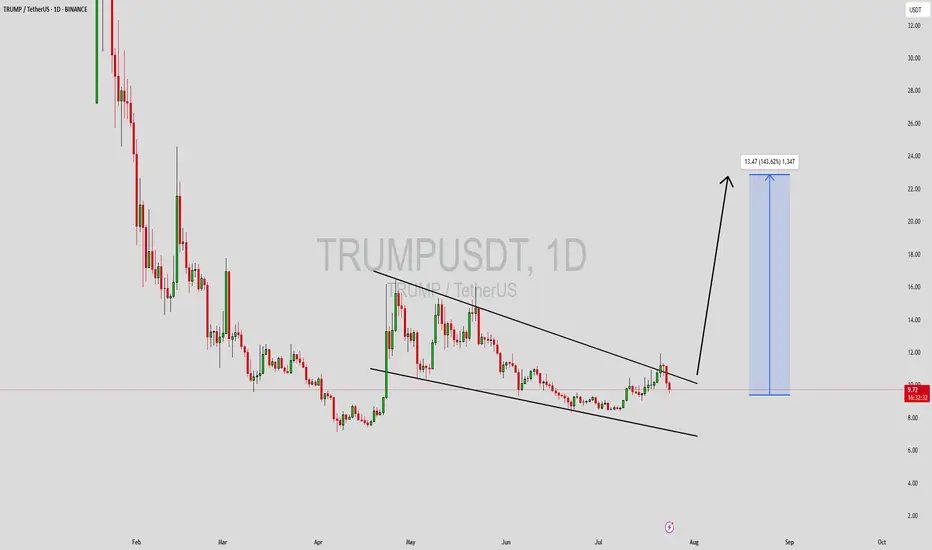
TRUMPUSDT Forming Falling WedgeTRUMPUSDT is currently forming a well-defined falling wedge pattern—a bullish reversal structure that often leads to significant upside breakouts. The price has been consolidating within narrowing trendlines and now appears to be approaching a breakout point. Historically, falling wedge patterns in the crypto market have led to aggressive rallies, especially when combined with rising volume and strong community sentiment. With good volume backing this setup, a breakout could trigger a sharp move to the upside, projecting an expected gain of 90% to 100%+ in the coming sessions.
Investor interest in the TRUMPUSDT project has been steadily increasing, likely fueled by the coin’s strong branding and community-driven momentum. Meme-based and politically themed tokens have seen explosive growth in recent bull cycles, and TRUMPUSDT may be positioning itself to capitalize on similar attention. With sentiment aligning positively and technicals flashing bullish signals, the coin is attracting both short-term swing traders and long-term speculative holders.
If TRUMPUSDT confirms a breakout above the upper wedge resistance with volume confirmation, we could see rapid price expansion. Traders should monitor key levels and consider re-entry on retests or strong bullish candles. The momentum shift is already becoming apparent, and this coin could turn into a trending asset in the meme-token segment very soon.
Keep this setup on your radar as it may provide high-reward opportunities. Monitor community updates, upcoming events, and broader meme coin momentum across the market for additional confirmation.
✅ Show your support by hitting the like button and
✅ Leaving a comment below! (What is You opinion about this Coin)
Your feedback and engagement keep me inspired to share more insightful market analysis with you!
TRUMPUSDT: Massive Reversal Incoming? Reaccumulation Zone!
📉 Current Market Outlook:
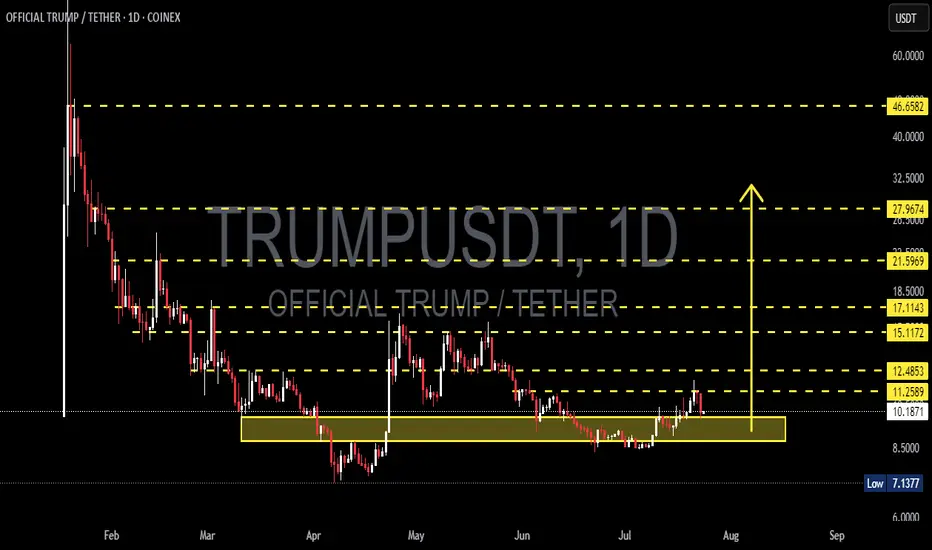
TRUMPUSDT is currently positioned at a highly strategic technical level. After an extended downtrend since February—dropping from the 60 USDT region to a low of around 7.13 USDT—price has now stabilized and entered a strong reaccumulation zone between 8.50 and 10.20 USDT.
This zone has acted as a reliable support range and shows signs of smart money accumulation, as evidenced by volume spikes and strong price reactions off this base.
---
🧠 Technical Pattern & Structure:
🔸 Base Accumulation / Reaccumulation Rectangle
Price has been consolidating in a tight horizontal range, forming a classic reaccumulation pattern, often seen before major breakouts.
🔸 False Breakdown – Bull Trap Reversal Setup
The brief dip below 8.50 USDT (to 7.13) followed by a strong recovery suggests a potential “shakeout” phase to remove weak hands before a rally.
🔸 First Higher Low Formation
Recent price action has formed a higher low, a key structural signal of a potential trend reversal from bearish to bullish.
---
🟢 Bullish Scenario (Primary):
If price continues to hold above the reaccumulation zone and breaks above 12.48 USDT with strong volume:
Short-Term Targets:
🔹 15.11 USDT
🔹 17.11 USDT
Mid-to-Long Term Targets (if bullish momentum sustains):
🔸 21.59 – 27.96 USDT
🔸 Ultimate target: 46.65 USDT (retest of previous major supply zone)
📈 Potential upside: Over 200% from current levels
---
🔴 Bearish Scenario (Alternative):
If the price fails to hold above the demand zone (drops below 10.00 USDT):
Possible retest of key supports:
🔹 8.50 USDT
🔹 7.13 USDT (major swing low)
⚠️ A confirmed breakdown could signal a continuation of the macro downtrend.
---
🔍 Key Levels to Watch:
Price Level Type Notes
7.13 USDT Major Support Previous swing low
8.50–10.20 USDT Demand Zone Reaccumulation / strong buyer interest
11.25 – 12.48 USDT Key Resistance Breakout trigger zone
15.11 – 17.11 USDT Minor Resistance First bullish targets
21.59 – 27.96 USDT Extension Targets Bullish breakout continuation
46.65 USDT Major Supply Historical resistance zone
---
🧠 Conclusion:
TRUMPUSDT is showing early signs of a macro reversal, with clear accumulation structure and breakout potential forming above a well-defined base. If confirmed by volume and price structure, the upside could be significant.
However, traders should remain cautious and watch for volume confirmation and failure points around key support.
#TRUMPUSDT #CryptoBreakout #AltcoinSetup #BullishReversal #TechnicalAnalysis #ReaccumulationZone #SmartMoneyMoves #PriceActionCrypto #AltcoinAnalysis#CryptoSignals #AltseasonReady
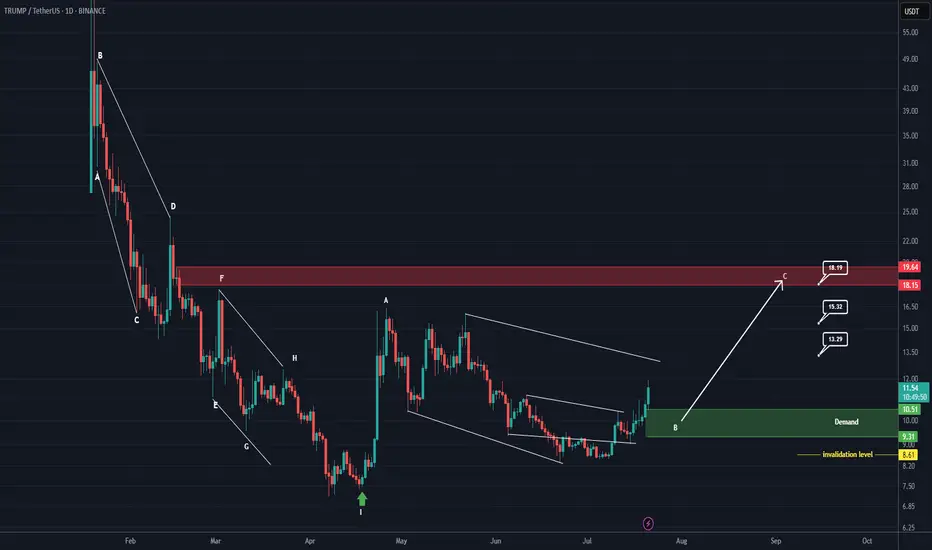
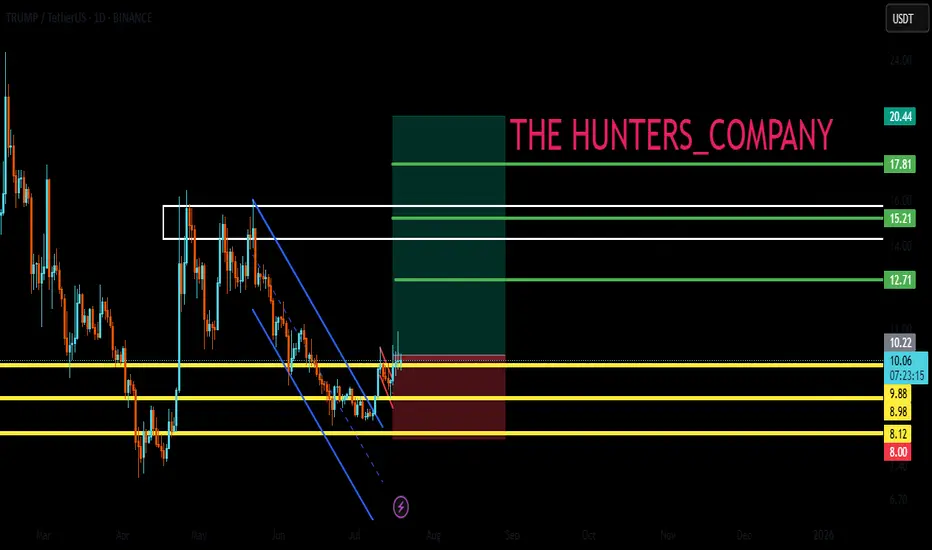
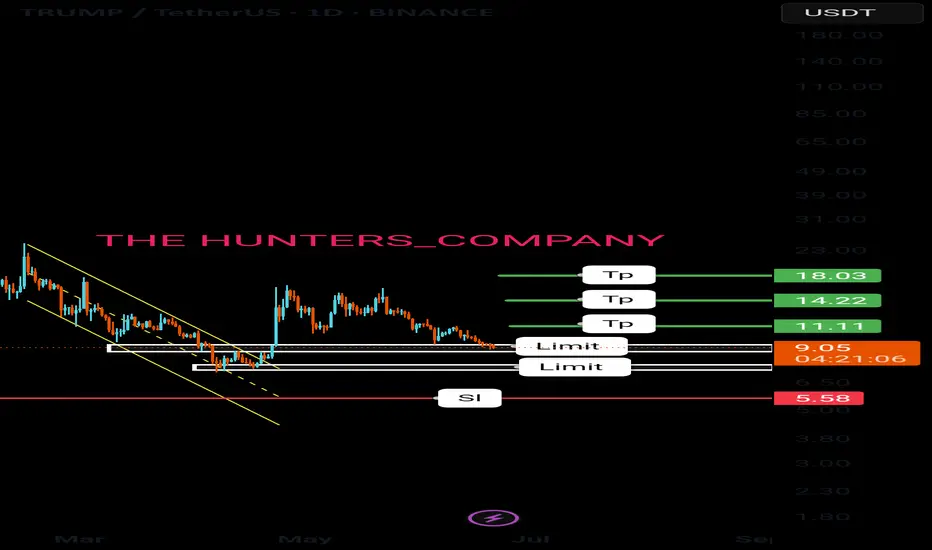
TRUMP Looks Bullish (1D)It seems that the bullish phase of the Trump coin has started from the point where we placed the green arrow on the chart.
We appear to be at the end of wave B of the bullish phase. As long as the price holds above the green zone, it can potentially move toward the targets marked on the chart.
A daily candle closing below the invalidation level would invalidate this analysis.
For risk management, please don't forget stop loss and capital management
Comment if you have any questions
Thank You
OFFICIAL TRUMP Last Barrier · $30 or $100 Next · MixedThe last barrier is on now. The last barrier as in the last and final resistance level TRUMPUSDT (OFFICIAL TRUMP) needs to conquer before a major rise. Will this rise reach $30 or $100 or higher? Continue reading below.
Make sure to boost this publication and follow to show your support.
Hah! Resistance is confirmed as EMA89, what a drag. This is the blue dotted line on the chart but notice something else. Look at the magenta line, EMA55. TRUMPUSDT is trading above EMA55 but below EMA89. Bullish and bearish. Bearish and bullish. Mixed?
There is nothing mixed.
The main low happened 7-April. A higher low in 22-June. Can you see?
This is not mixed, this is bullish confirmed.
If the market were to move lower, then in 22-June we would have either a test of the 7-April low or a lower low. The fact that the drop stopped higher means that buyers were present. People were actually expecting for prices to drop and once they dropped they bought everything that was being sold. Prices couldn't move any lower because people were buying up. These are smart trader, smart money; experience for sure.
They managed to buy some tokens at a lower price within the "opportunity buy zone." This zone is available no more and now we have the mix of resistance and support; EMA89 and EMA55. What happens next?
Based on the previous signal I just showed you and marketwide action, Bitcoin super strong, we know that TRUMPUSDT will follow and break-up. Yes! Massive growth.
Both targets are good and will hit. Short-term, we will see a challenge of $30 and long-term we will see $100 and beyond.
Thanks a lot for your continued support.
Namaste.

TRUMP IS PUMPING!!!Hello friends🙌
📈Given that the price has reached its bottom and buyers support it, you can buy at 3 specified points with capital and risk management and move with it to the specified targets.
🔥Follow us for more signals🔥
*Trade safely with us*
TRUMP UPDATEHello friends🙌
👀You can see that the price formed a reversal pattern after falling at the specified support and the buyers supported it.
⚠Considering the entry of buyers, the price is expected to move to the specified targets, of course, don't forget about capital and risk management.
🔥Follow us for more signals🔥
*Trade safely with us*
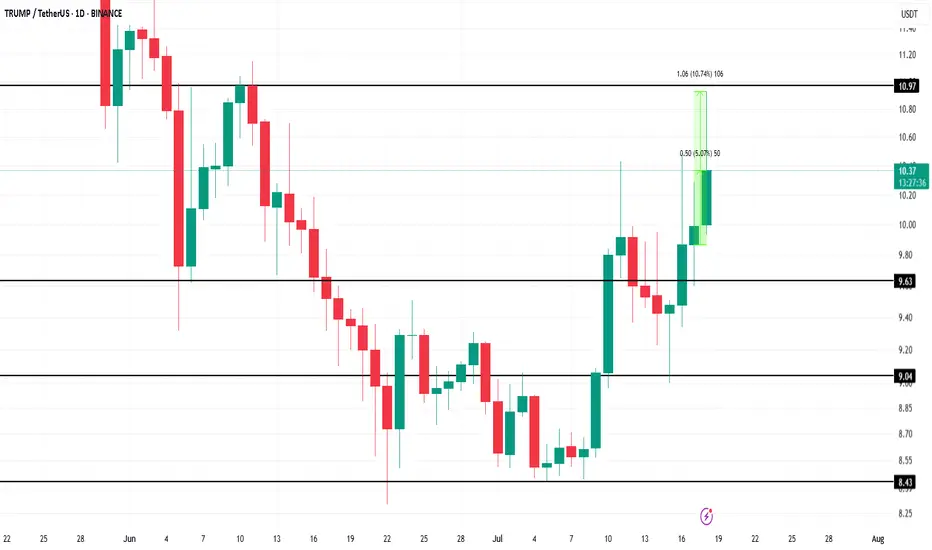
TRUMP Token's $950 Million Unlock Sparks Short-Lived Price RallyBINANCE:TRUMPUSDT recently saw its first major token unlock in six months, which flooded the market with fresh supply. The 90 million TRUMP tokens unlocked today are much smaller than the previous unlock in January, yet they still increased liquidity significantly.
However, the lack of response to the unlock, despite the substantial capital entering the market, further indicates a cooling of investor enthusiasm around the meme coin
BINANCE:TRUMPUSDT price rose by 5% today, trading at $10.39 at the time of writing. It briefly surged by 10% during the intraday high , but the rally was short-lived, and the price retraced.
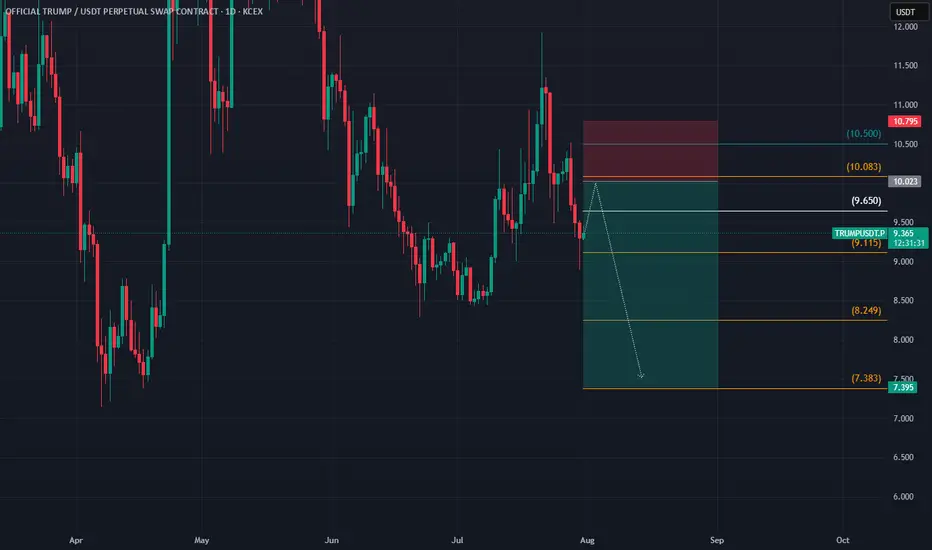
If BINANCE:TRUMPUSDT fails to breach the $10.97 resistance level again, the coin could face potential corrections to $9.63 , making recovery difficult. The token will need strong demand to push past this resistance and secure more gains.
However, should BINANCE:TRUMPUSDT capitalize on broader market bullish momentum, it could break past $10.97 and reach $11.00 . This would likely invalidate the current bearish outlook and provide an opportunity for a further rise to $12.18.
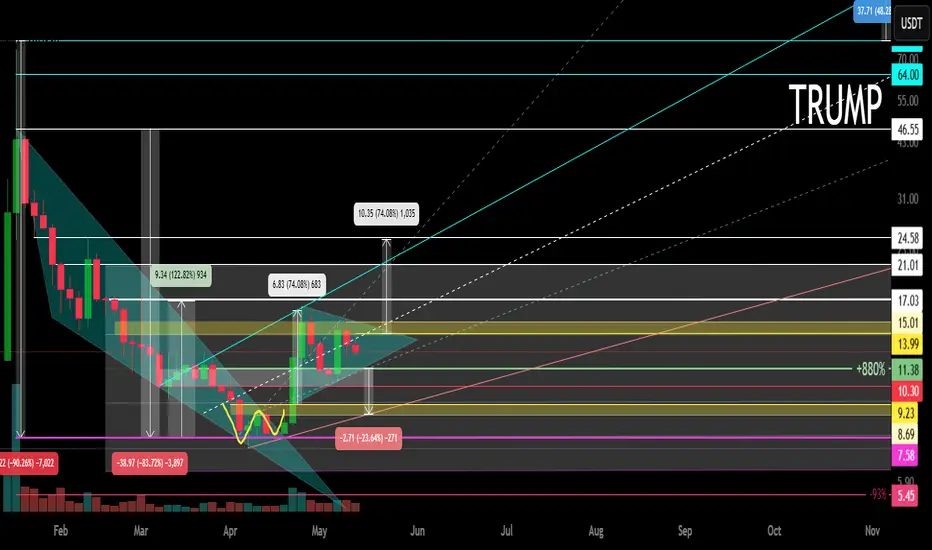
OFFICIAL TRUMP Main trend. 16 05 2025Logarithm. Time frame 3 days. After a super pump and a drive of "stupid money", a descending channel was formed on a natural dump. The price came out of it. Now a triangle is forming. The price is clamped. The reversal zones and percentages to the key support/resistance levels are shown extremely accurately according to TA.
If there is no aggressive exit in the medium term, then there will be consolidation and, as a consequence, the formation of a horizontal channel "sholtai / chattai", its key zones are shown.
Now, this "cryptocurrency" is now on 16 05 2025 in 41st place by capitalization.
Reductions from the price highs are about -90%.
From the liquid zone about -84%.
These are not the minimum values of the decline of such hype cryptocurrencies. Just take this into account in your money management. For clarity, the level zones and the % of potential decline if the trend breaks again are shown on the chart (pull the chart down).
Even with such a decline, the price is now at a huge profit. I am not speaking for the creators of the cryptocurrency, but for the first speculators and "investors" who may not have sold everything on the hype.
For the creators of the cryptocurrency, perhaps these are manipulators close to the Trump family, for them, any sale is super profit. But in order to sell, you need to maintain liquidity, and from time to time make interest in speculation and asset retention by investors, that is, do pumps and hype. Use this, and do not be greedy...
Levels and zones, pump/dump, which the price will "feel" are shown in advance. Click "play" on the chart and move the chart up. With a high degree of probability, the hype and pumping of the price of this cryptocurrency will be repeated, given the hype and the long term of the political figure whose name this cryptocurrency bears. Now it is a Trump dump, in the future it will become a Trump pump for some time.
Do not forget to sell on the next hype. If you understand that you are very greedy, and the news background affects you, then sell in parts, or use stop losses to protect profits.
There is no need to guess the minimums and maximums. It is important to know these zones, and have an acceptable average price, from the position of the trend, and its potential. It is regulated by the distributed entry volume (in advance) at potential reversal zones.
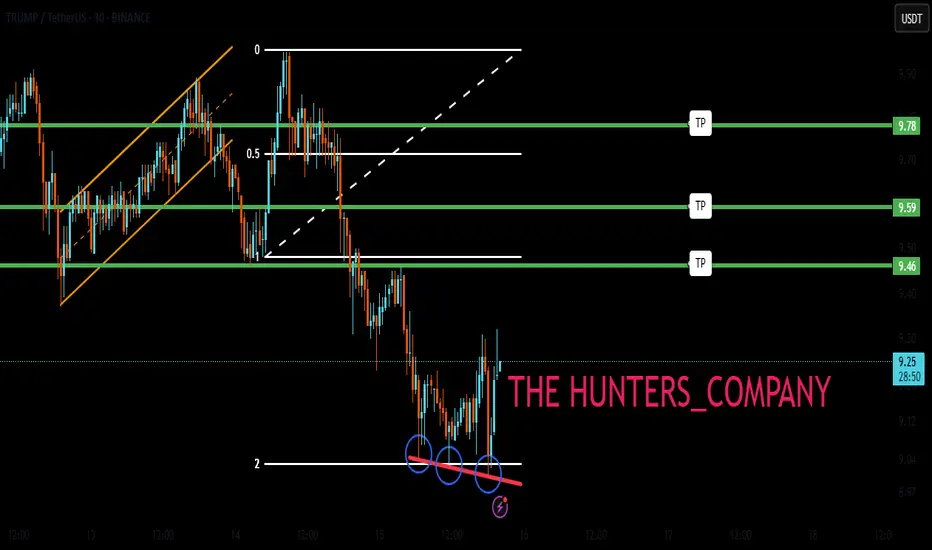
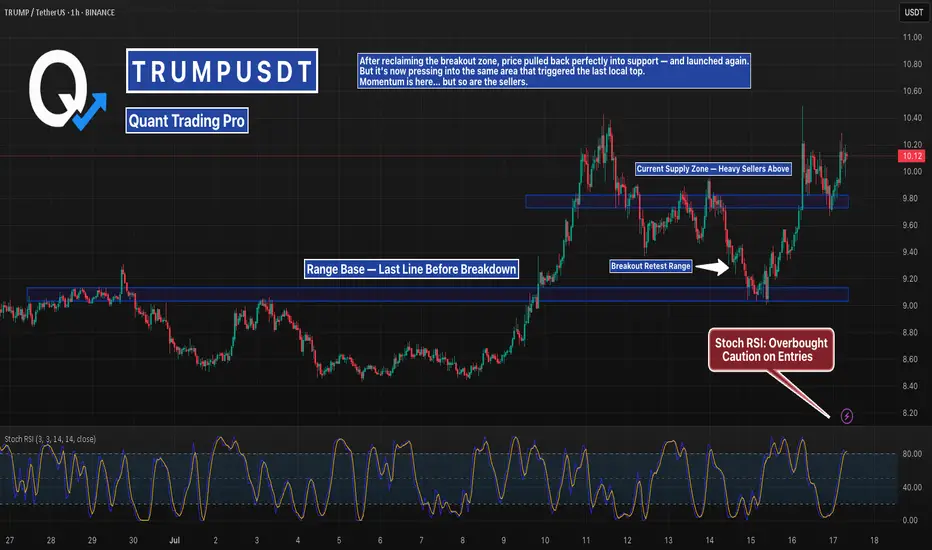
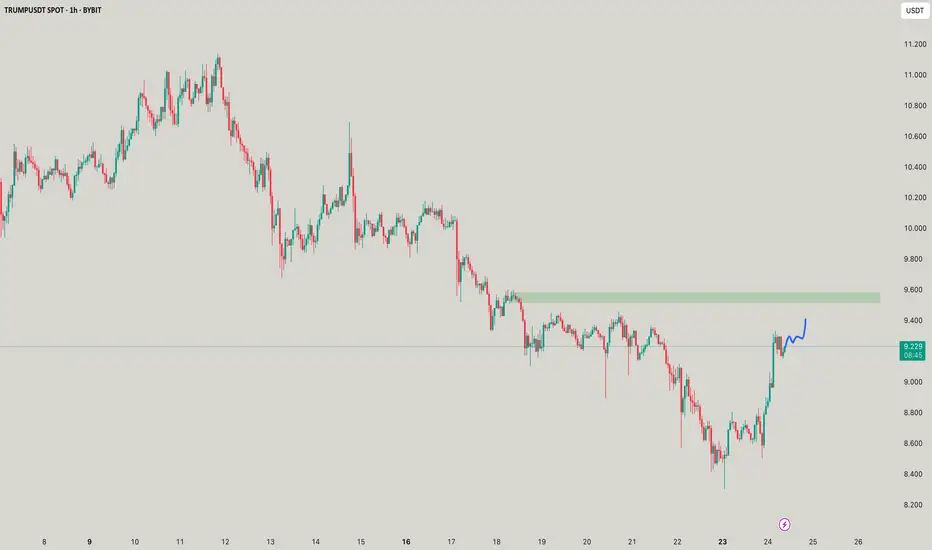
TRUMP Held the Retest — Now Pushing Into Resistance AgainTRUMP bounced clean off the retest zone after holding structure at $9.80.
Now it’s knocking on the same resistance that sparked a sharp pullback just days ago.
If buyers want a real breakout, this is where they’ve got to show up loud.
Risk is rising, but so is the setup.
#TRUMPUSDT #MemecoinCharts #BreakoutRetest #CryptoMomentum #ChartAnalysis #BacktestEverything #QuantTradingPro #TradingView
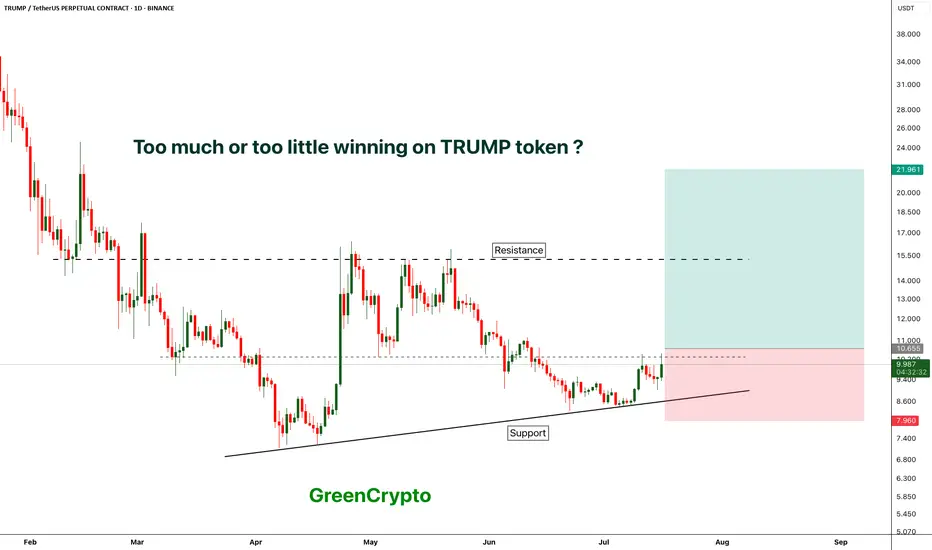
TRUMP - TOO MUCH WINNING ?Trump token is finally seeing some greens after hitting the bottom
currently price is trading near the local resistance.
We have long trade opportunity if the candle closes above local resistance.
Entry Price: Above 10.655
Stop Loss: 7.9
TP1:12.592
TP2: 15.218
TP3: 21.843
TP4++: Keep 20% of the position running with trailing stoploss.
Max Leverage: 5x
Don't forget to keep stoploss
Cheers
GreenCrypto
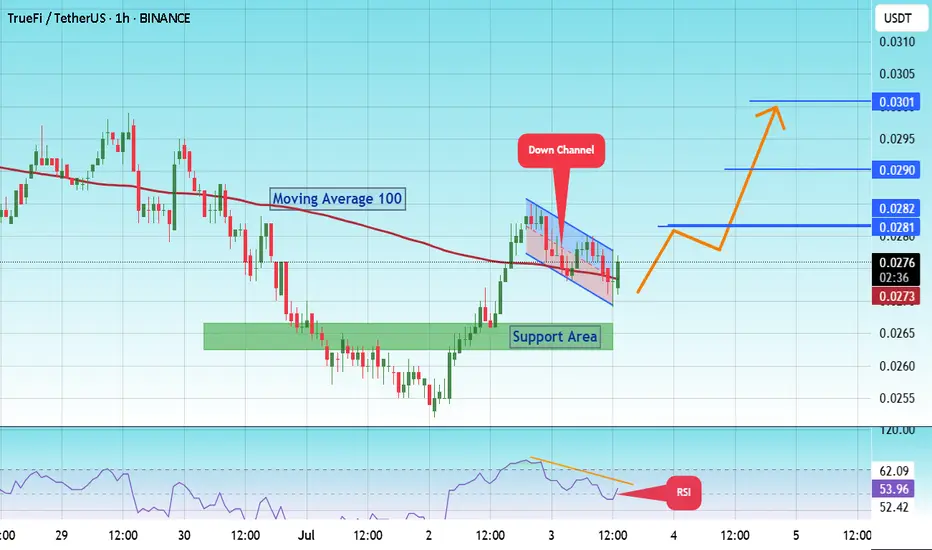
TrueFi (TRU)#TRU
The price is moving within a descending channel on the 1-hour frame and is expected to break and continue upward.
We have a trend to stabilize above the 100 moving average once again.
We have a downtrend on the RSI indicator that supports the upward break.
We have a support area at the lower limit of the channel at 0.0270, acting as strong support from which the price can rebound.
We have a major support area in green that pushed the price upward at 0.0260.
Entry price: 0.0275
First target: 0.0281
Second target: 0.0290
Third target: 0.0301
To manage risk, don't forget stop loss and capital management.
When you reach the first target, save some profits and then change the stop order to an entry order.
For inquiries, please comment.
Thank you.
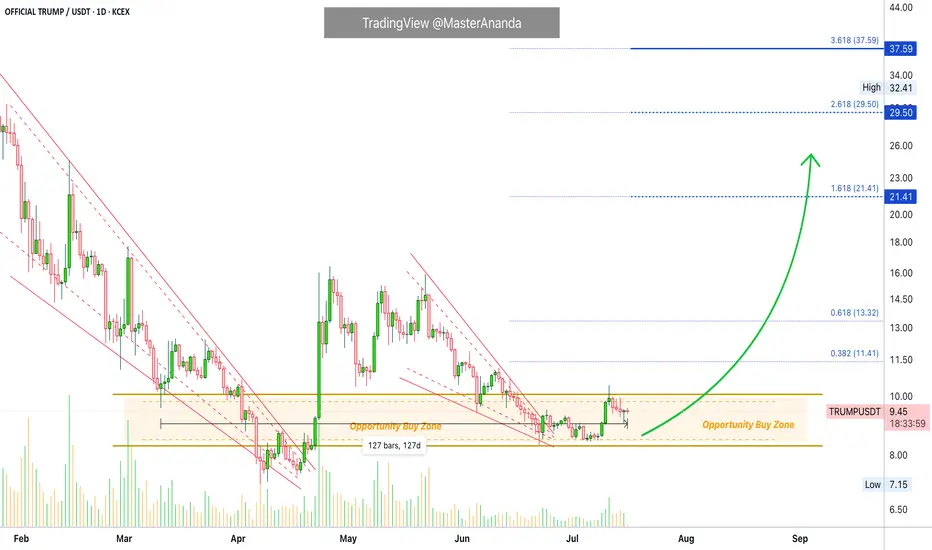
OFFICIAL TRUMP Trading Within Opportunity Buy Zone—About To ExitThis is the last chance to get OFFICIAL TRUMP (TRUMPUSDT) within the opportunity buy zone, the best possible entry prices before a major bullish wave.
Good morning my fellow Cryptocurrency trader, this market has endless opportunities to offer. There is always a second chance; it is never too late.
This "Opportunity Buy Zone" has been available only once briefly before the current period. The first three weeks of April. The second entry into the opportunity buy zone within a higher low happened in June and has been active for 41 days. Time is running out.
Since 11-March, when the current zone was activated through present day, we have more than four months. That's four months of consolidation, sideways... The market can remain neutral only for so long, and it isn't bearish anymore.
The downtrend ended with the 7-April low, the big red falling wedge. After this date the market started a recovery and then we have a retrace—the small falling wedge—and within this retrace market conditions remain bullish based on a higher low.
The main low and market bottom happened 7-April 2025 and the higher low 22-June 2025. This means we are already on the bullish train.
The higher low will lead to a higher high which simply means higher prices. Let's skip the technical analysis and move to the good part.
Maximum growth
How do you see the market right now? How do you see TRUMPUSDT?
It is not going to be the same forever actually, we are expecting big change.
All those days going sideways, down, boring, the market retrace; when it changes it will be so much different. Imagine, visualize, 100%+ in a single day. Then repeat this process over and over. Still some swings and corrections, but that is how you get to 1,000%+ or even 2,000% growth in 30 days.
The meat of the bullish move can happen within 1-2 months. It can also take 4-6 months. What happens is that the start date is not the date when prices start to rise fast but the date the market hit bottom. This means that we are already three months in (100 days) into this bullish wave. Why? Because the low happened 7-April. When you get a strong bullish breakout and the market peaks after two months, total duration of the bullish cycle wouldn't be two months but five months.
We are already on the other side. Now that the next low is in, TRUMPUSDT will be moving to produce a higher high.
Patience is key. The best is yet to come.
Hold strong; rest easy... You will be happy with the results.
Namaste.
Trump's signalHello friends🙌
🔊Given the good growth we had, you can see that the price has hit resistance and you can see that the upward waves are getting weaker, which indicates that we are likely to have a correction until the support areas are identified...
You can buy in the identified support areas in steps and with capital management and move with it to the specified targets.
🔥Join us for more signals🔥
*Trade safely with us*

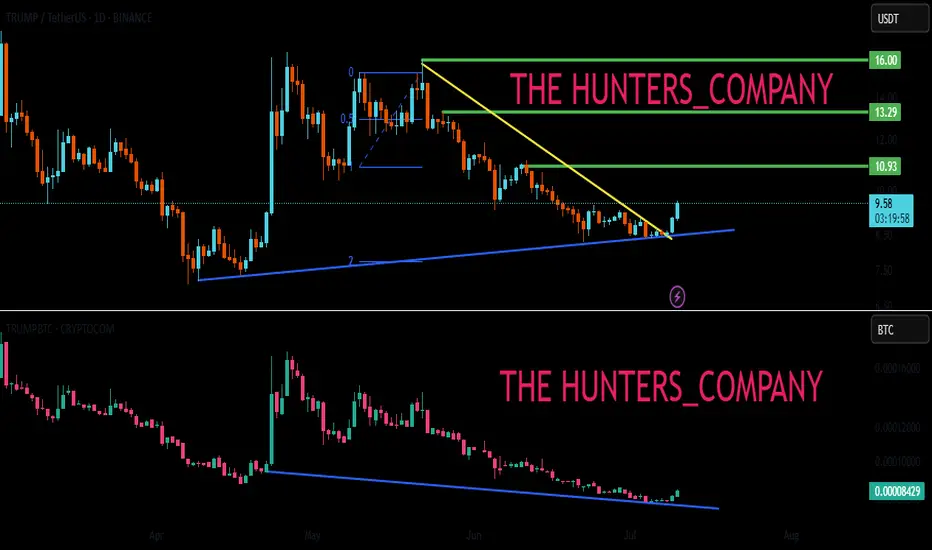
TRUMP BUY ???Hello friends🙌
🔊As you can see in the picture, we have brought you two Trump charts:
1_TRUMP/USDT, in which we see an upward trend.
2_TRUMP/BTC, in which we see a downward trend.
✔Now what is the conclusion? When this negative divergence occurs, it means that money flows from Bit to Tether, and we can expect good growth from it to the specified targets, given the price reaching important support and its return📈
🔥Join us for more signals🔥
Trade safely with us.
Middle East War Whispers: Is Bitcoin About to Crash?The scent of conflict is once again in the air over the Middle East. Tensions are rising, and traders are starting to worry.
If war erupts once more in the region, will Bitcoin and the crypto market survive? Or should we prepare for a heavy drop?
In this analysis, we’ll explore realistic scenarios and tools that experienced traders use to protect themselves in moments like these.
Hello✌
Spend 3 minutes ⏰ reading this educational material.
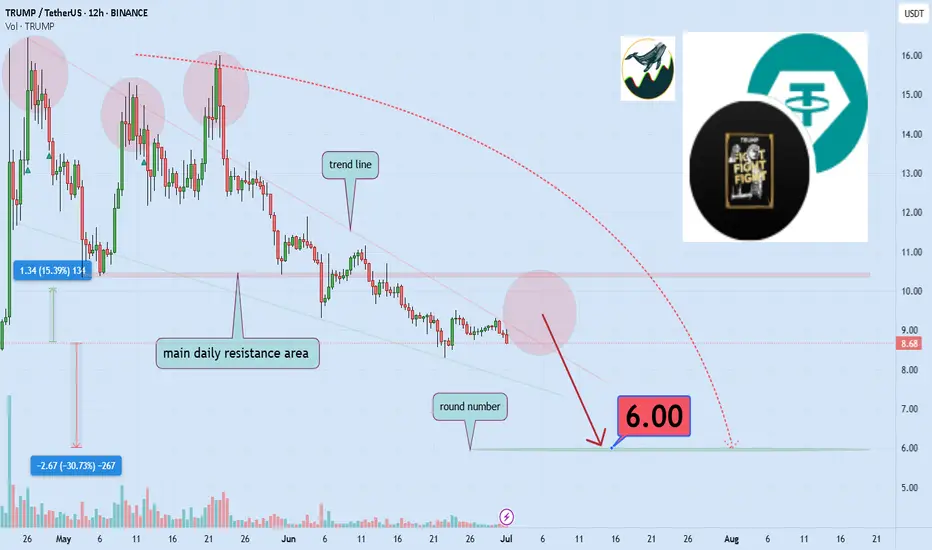
🎯 Analytical Insight on Official Trump:
Official Trump continues to exhibit high sensitivity to political narratives and has recently entered a multi-leg correction phase amid escalating Middle East tensions 🌍. Based on current price structure and sentiment flow, a potential drawdown of approximately 30% appears likely, with a key downside target projected near the $6 region 📉.
Now , let's dive into the educational section,
📌 How Markets Have Reacted to Geopolitical Tension
Historically, during major geopolitical flare-ups, risk markets like crypto have shown heightened sensitivity. What matters most isn’t the exact nature of the conflict — it’s how the market interprets the situation. Price doesn’t move on truth; it moves on perception.
🔍 TradingView Tools to Navigate Crisis and Spot Potential Sell-Offs 📊
When fear dominates the market and uncertainty clouds every candle, TradingView’s built-in tools become essential for staying ahead. Let’s explore the most practical ones for moments like this:
Market Sentiment Indicators
Tools like the Crypto Fear & Greed Index combined with higher time-frame volume analysis can help you track the mood swings that drive market volatility.
Layered Watchlists
Create watchlists that compare major projects with volatile meme coins or micro-caps. Early exits often show up as disproportionate drops in smaller assets before the big ones move.
Smart Alerts Based on Price Behavior
Set up alerts not just for price levels, but for candle closes, trendline breaks, and sudden volume shifts. These help you act swiftly, without letting fear control you.
Cross-Market Correlation Tracking
Use TradingView’s Compare function to monitor Bitcoin’s correlation with assets like gold, oil, or the dollar index. Shifts in capital flow toward safe havens may signal a crypto downturn.
Heatmaps for Crowd Behavior
Heatmaps let you see real-time buying and selling intensity. During panic phases, expanding red zones on the map could indicate larger market fear and potential liquidation zones.
🎯 What Should You Do? Scenarios and Strategic Responses
When the headlines are hot but the charts unclear, neither blind holding nor panic selling helps. Let’s break down potential paths:
Scenario One: Sudden and Escalating Conflict
A quick escalation may trigger immediate sell pressure. Watch for key levels and volume patterns to protect or hedge open positions.
Scenario Two: Prolonged News-Driven Tension
This usually creates choppy, range-bound price action. Combining momentum indicators like RSI with moving averages can help filter out fake-outs.
Scenario Three: The Dangerous Silence
A flat, quiet market can hide a ticking bomb. Underlying sell pressure might build unnoticed. Combining macro news with multi-timeframe analysis is key here.
🧠 Psychology of Fear in Unstable Times
In unstable markets, emotion drives action. When fear spreads faster than facts, many traders get caught off guard. Relying solely on what your eyes see in price action can mislead you. Instead, look at alerts, volume shifts, sentiment data, and crowd reactions.
⛑️ Final Tip for Traders
During crisis rumors and uncertainty, the worst decisions often come from rushing or overreacting. If you don’t have a clear plan, stay out. Use the tools available, prepare for multiple outcomes, and remember — your capital is your power. Don’t gamble it on noise.
🧾 Final Thoughts
The market stands at a psychological and strategic crossroad. With Middle East tensions rising again, crypto traders must prepare, not panic. Use the depth of TradingView tools, plan for different outcomes, and react with logic — not fear.
In times of crisis, survival comes before profit.
✨ Need a little love!
We put so much love and time into bringing you useful content & your support truly keeps us going. don’t be shy—drop a comment below. We’d love to hear from you! 💛
Big thanks, Mad Whale 🐋
📜Please remember to do your own research before making any investment decisions. Also, don’t forget to check the disclaimer at the bottom of each post for more details.
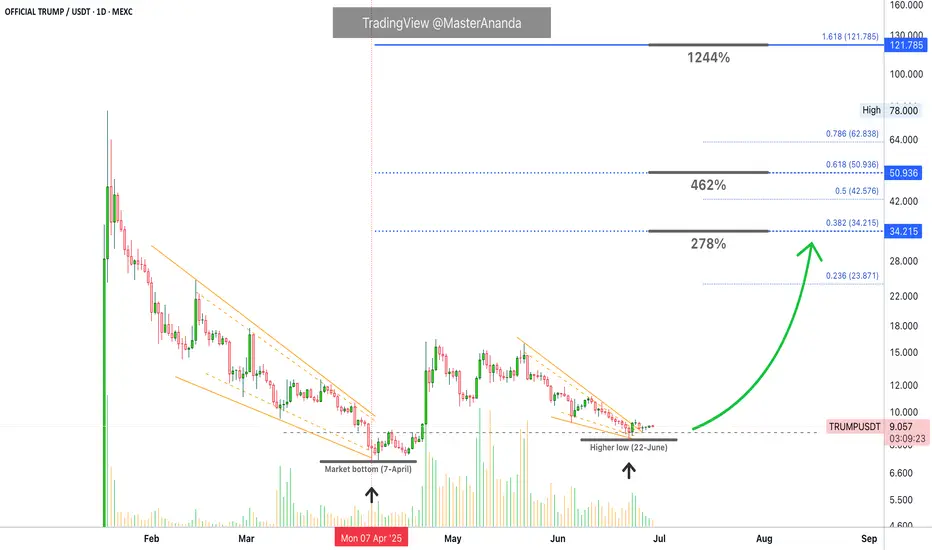
OFFICIAL TRUMP 1,244% Target Revealed & Map UpdateI have several questions for you:
1) Did the market break your patience? Are you still holding?
2) How much are you going to take? Will you go for 278% or maybe 1,244%?
TRUMPUSDT has been really uneventful lately and this is good, it means that consolidation is still happening and consolidation is a form of exercise for a trading pair; TRUMPUSDT is building strength.
From a technical analysis perspective, the chart is great, still bullish continues bullish; looks good. Because the action continues to happen as a higher low compared to 7-April. 7-April is the market bottom, as long as this level is not challenged or broken we are now in the bullish zone.
The move that peaked in late April is the initial bullish breakout. The higher low 22-June marks the point where the retrace from the initial bullish breakout ends. 22-June can also signal the start of the next upthrust. From here on we will see growth.
Higher lows lead to higher highs. We have a very clear, strong and ecologically sustainable higher low. This means that a higher high comes next.
Here is the tricky, not so tricky part: TRUMPUSDT will grow to $50, $62, beyond $100 and so on, but, not all growth happens in a single wave. Just as TRUMPUSDT moved from $7 to $16 and then stopped, it can move from $9 to $34 and then make another stop, this one short. Then another rise toward $50 and so on. The market never moves straight down but neither straight up. And this gets us to my point. Will you sell when resistance is hit to later buy back lower, or, will you continue waiting until the market top, higher targets?
That's the question you need to answer to maximize profits when the action goes green. If you decide you want to sell the wave, then make sure to prepare to sell when the market is green. What happens is that if you don't sell when green but wanted to take some profits then you will do so when the market is red. In this case you will not be taking out the maximum possible...
Anyway, we have to leave something for another day. TRUMPUSDT will grow, for certain, but it takes time. Patience is key.
Thank you for reading.
Namaste.
MR President - When $16?How can we forget Mr TRUMP!!!!!?? The marker mover hahaha, so unless price is likely to stay above 9.148 unless there’s heavy sellingm< weekly looks positive but not lookinh onto those shi
Trump:New update(don't miss it)hello friends👋
This time we came with the analysis of Trump's famous coin meme, which you requested a lot.
Well, as you can see, by making a double floor, the price has broken its downward channel and has grown well.
After the price growth, we saw the price suffering and then the price correction, which caused the formation of an upward pattern.
Now, according to the successful formation of this ascending pattern, it should be seen whether the buyers support the price in the specified support areas or not...
Pay attention that our trend is upward and the pattern made also shows an upward trend, that's why we have identified the support areas for you to enter the transaction step by step with risk and capital management.
🔥Follow us for more signals🔥
*Trade safely with us*
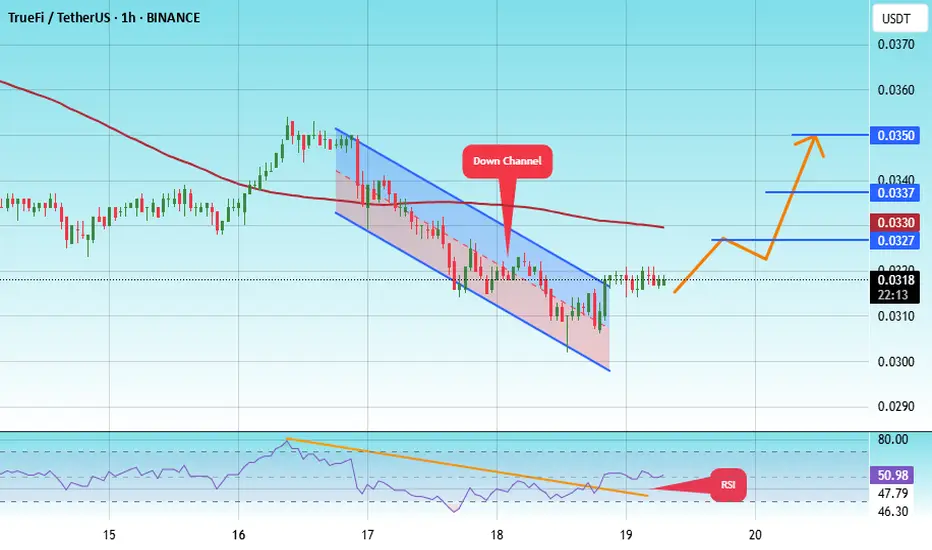
#TRU/USDT#TRU
The price is moving within a descending channel on the 1-hour frame, adhering well to it, and is heading towards a strong breakout and retest.
We are experiencing a rebound from the lower boundary of the descending channel. This support is at 0.0300.
We are experiencing a downtrend on the RSI indicator, which is about to break and retest, supporting the upward trend.
We are in a trend of consolidation above the 100 Moving Average.
Entry price: 0.0315
First target: 0.0327
Second target: 0.0337
Third target: 0.0350
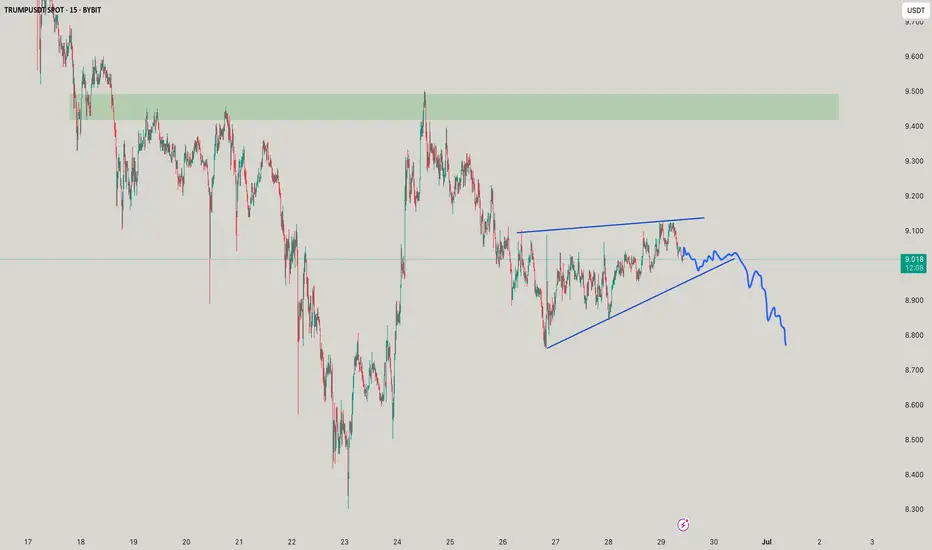
TRUMPUSDT In my opinion, we could still see a further 10% drop, considering the market’s cyclical nature — though it does feel like we’re near the bottom at this point.
Based on the indicators below, MACD and CCI are also showing signs of compression, similar to what we're seeing in the technical analysis.
Overall, I think by June 20th we’ll have a clearer picture of where the breakout from these triangle formations is headed
