TRU/USDT Weekly – On the Verge of a Reversal or Breakdown?📌 Overview:
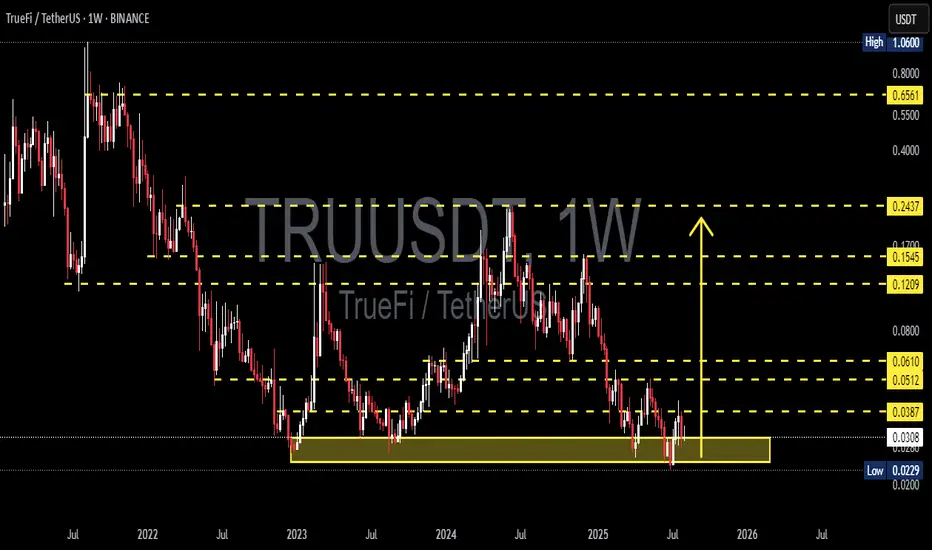
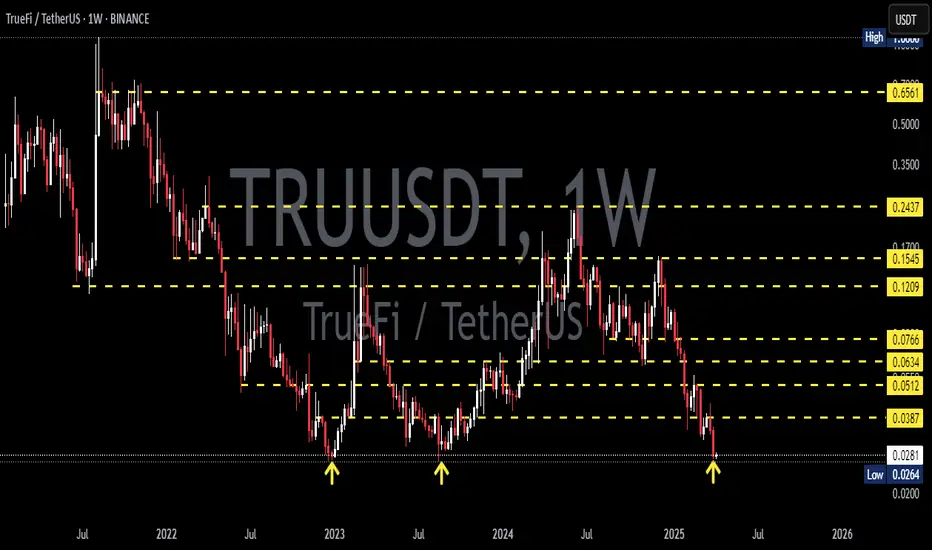
TRU/USDT is currently trading within a key long-term demand zone between $0.0229–$0.0307 — an area that has consistently acted as a strong bounce level since early 2023. Now that this zone is being tested again, the outcome could define the next major move for TrueFi.
---
🔍 Market Structure & Pattern:
The pair has been moving sideways in a year-long accumulation range, hinting at a potential accumulation phase by smart money.
There's a possibility of a triple bottom formation, a classic reversal signal, should price break above resistance with momentum.
Although the overall trend remains bearish, selling pressure is weakening, suggesting a possible trend transition phase.
---
📈 Bullish Scenario (Reversal Potential):
If price holds the support zone and confirms a bullish weekly candle:
Upside Targets:
🔹 $0.0387 (First breakout level)
🔹 $0.0512 – $0.0610 (Previous distribution range)
🔹 $0.1209 – $0.1545 (Mid-term trend shift target)
Potential catalysts: strong breakout volume, improving market sentiment, and weakening BTC dominance.
---
📉 Bearish Scenario (Breakdown Risk):
If price fails to hold above $0.0229 and closes below on the weekly chart:
Price could fall further toward the psychological level around $0.0200 or even lower.
This would confirm a new lower low, continuing the broader bearish trend and possibly entering a capitulation phase.
---
🎯 Key Levels to Watch:
Level Significance
$0.0229 – $0.0307 Major demand zone (historical support)
$0.0387 Initial resistance / bullish trigger
$0.0512 & $0.0610 Previous supply zones
$0.1209 & $0.1545 Mid-term reversal targets
$0.2437 Long-term target if uptrend confirms
---
🔄 Conclusion:
TRU/USDT is at a make-or-break point. Bulls and bears are clashing at this critical support. Will this be the start of a long-awaited reversal, or will we see a deeper breakdown?
The coming weekly candles will be crucial. Smart traders will wait for clear confirmation — not just reaction.
---
🧲 Trading Strategy Ideas:
Conservative Bulls: Wait for a weekly breakout above $0.0387 with volume confirmation.
Aggressive Traders: Consider entry at support with tight stop-loss below $0.0225, aiming for $0.0512 short-term.
Bearish Bias: Short after confirmed weekly close below support.
#TRUUSDT #TrueFi #CryptoReversal #AltcoinAnalysis #SupportZone #TripleBottom #BreakoutSetup #WeeklyChart
Truusdc
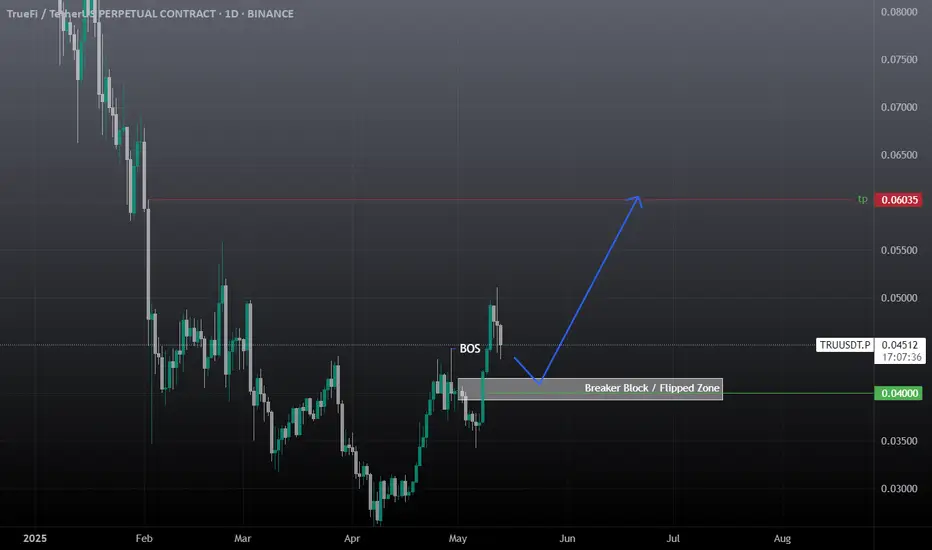
Truusdt truefi buy setupA clean setup, valid until final tp is not hit. Wick doesn't matter if any news day, closing matters.
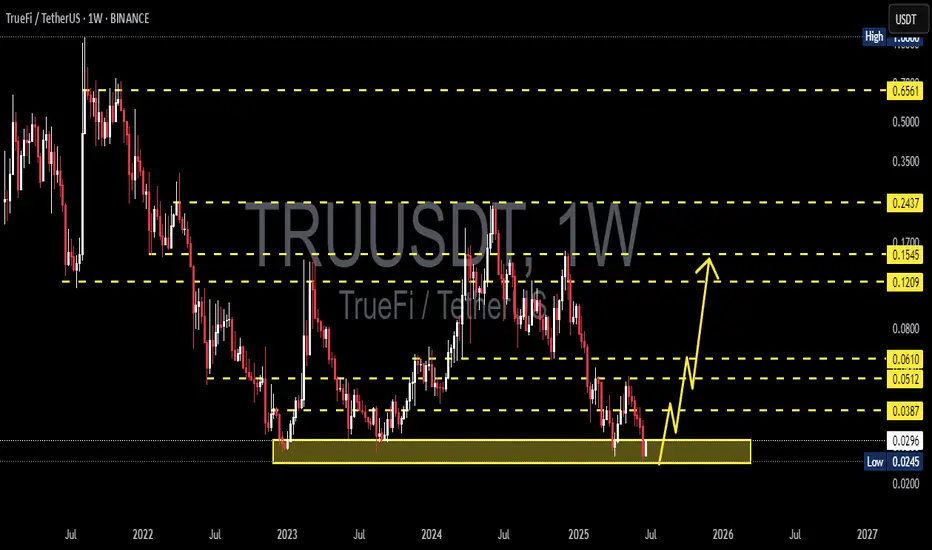
TRUUSDT 1W AnalysisTRU ~ 1W Analysis
#TRU This trade is very high risk, this is the lowest support you might consider to start buying back with a short term target of at least 20%+.
Tru USDT Swing TradeAs much as we doesn't closes below 0.038 first and confirmed tp is 0.060$ . Wait for the entry and start accumulation of true between 0.040-0.035 set tp 0.060$
TRUUSDT 1WTRU ~ 1W Analysis
#TRU Key support that must be maintained for now. Loss of this support, will suppress lower prices.
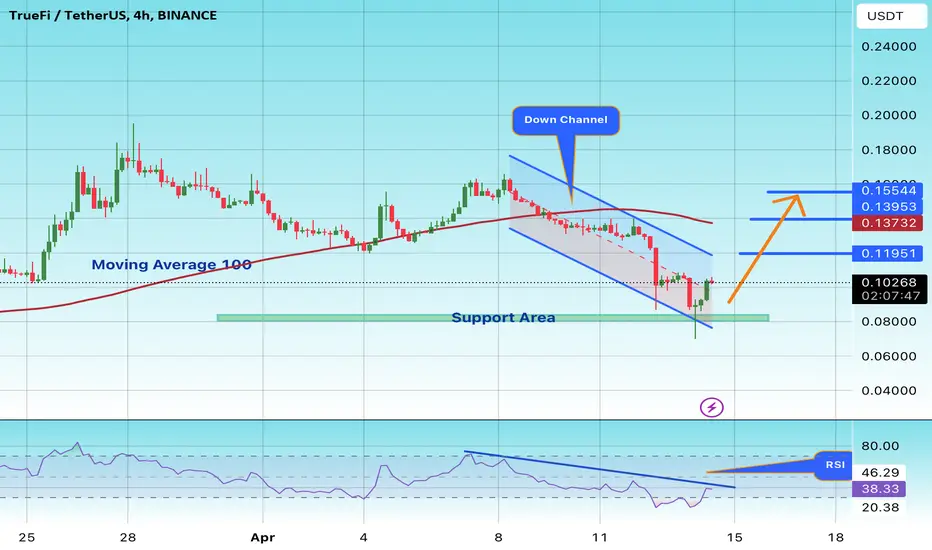
#TRU\USDT#TRU
The price is moving in a descending channel on a 4-hour frame.
The price is moving within it and is adhering to it to a large extent.
We have a support area in green and bounced from it at the 0.0800 level.
We have a tendency to hold above moving average 100.
We have a downtrend on the RSI indicator that supports the rise and is about to break higher
Entry price is 0.1000
The first target is 0.1190
The second goal is 0.1377
the third goal is 0.1554
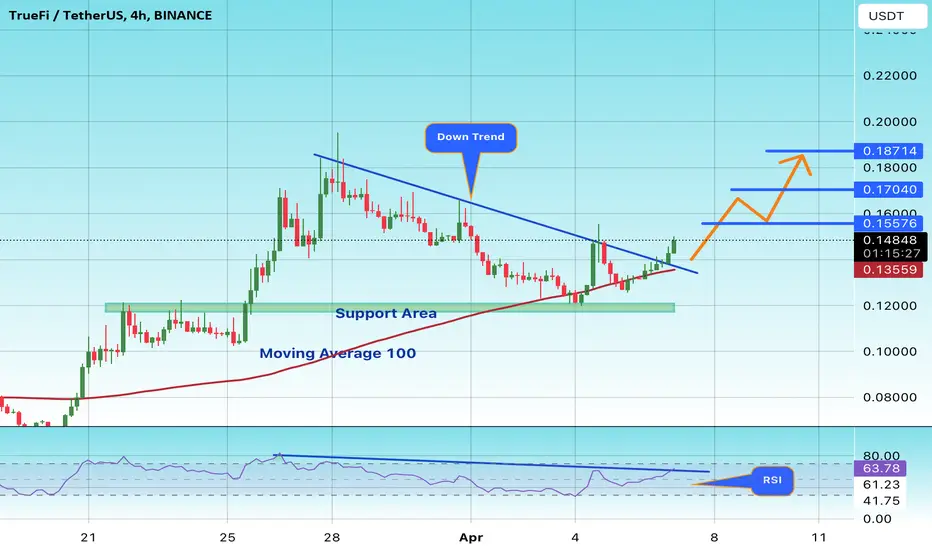
#TRU/USDT#TRU
We have a downtrend on a 4-hour frame, the price is moving within it and adhering to its limits well, and it has just been breached to the upside.
We have a major support area at Saad 0.1200
We have a higher stability moving average of 100
We have a downtrend on the RSI that is about to break higher
Entry price is 0.1490
The first target is 0.1550
The second goal is 0.1700
the third goal is 0.1870
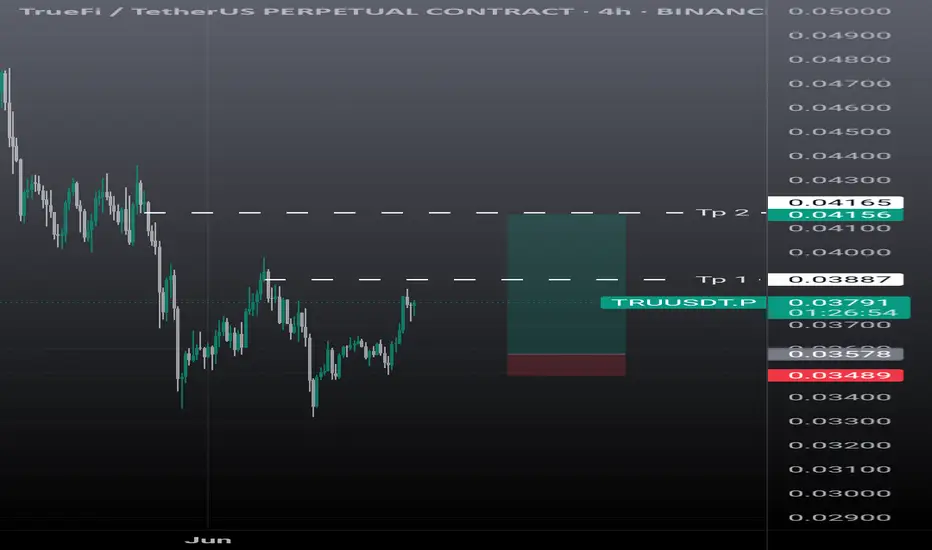
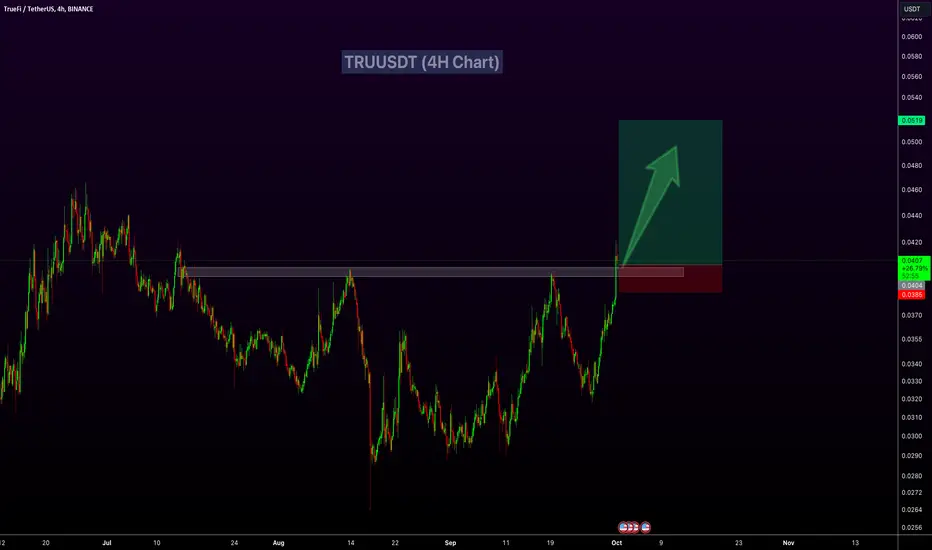
TRUUSDT Breakout Confirmed!TRUUSDT Technical Analysis Update
Buy zone: Below $0.0405
Stop loss: $0.0384
Take Profit 1 : $0.0435
Take Profit 2 : $0.0465
Take Profit 3 : $0.0520
Thanks
Hexa
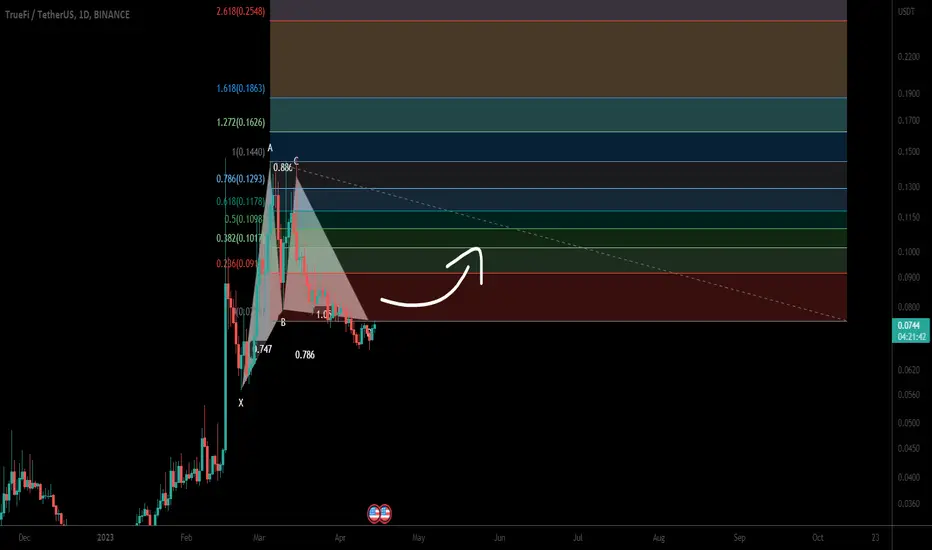
TrueFi (TRU) formed bullish Gartley for upto 127% moveHi dear friends, hope you are well and welcome to the new update on TrueFi (TRU) with US Dollar pair.
Previously we caught a nice pump of TRU as below:
Now On a 4-hr time frame, Tru has formed a bullish Gartley pattern.
Note: Above idea is for educational purpose only. It is advised to diversify and strictly follow the stop loss, and don't get stuck with trade
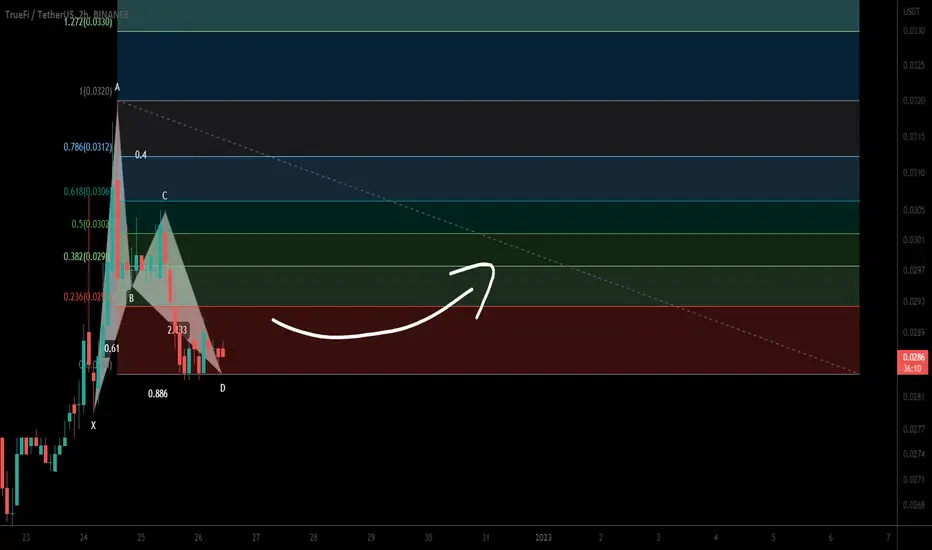
TrueFi (TRU) formed bullish BAT for upto 11.50% moveHi dear friends, hope you are well and welcome to the new update on TrueFi ( TRU ) with US Dollar pair.
Previously we caught a nice trade of TRU:
Now on a 2-hr time frame, TRU has formed a bullish BAT pattern.
Note: Above idea is for educational purpose only. It is advised to diversify and strictly follow the stop loss, and don't get stuck with trade
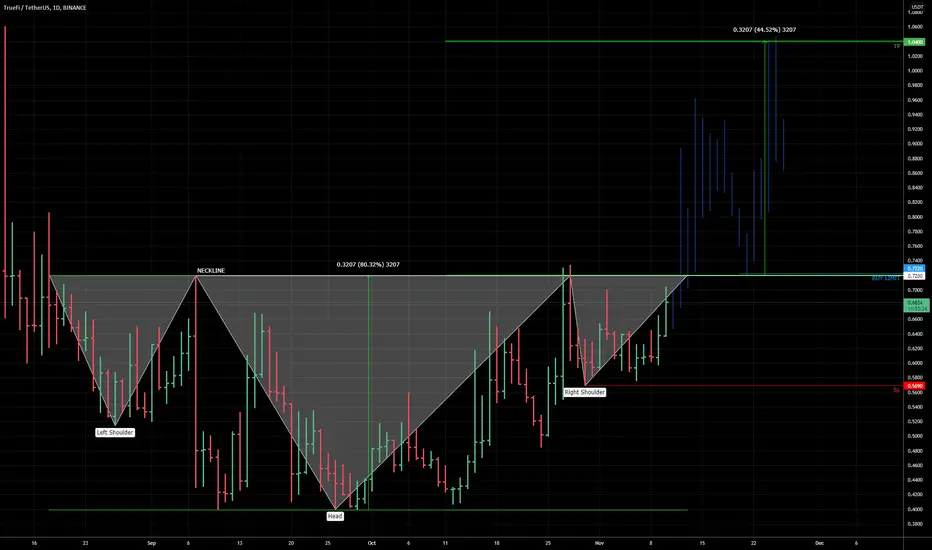
TRU inverted H&S If you missed my previous TRU idea...
...then there could be another chance to get in as TrueFi is forming Inverted Head and Shoulders 🤷 and if price breaks up I think there is chance for run to 1.04 and even higher. Will set the BUY LIMIT order to catch the pullback to Neckline (testing it from above).
ENTRY : Backtest of the broken Neckline @ 0.722
SL : Right Shoulder @ 0.569
TARGET : Inverted H&S target projection @ 1.040
RRR : 2
INVALIDATION : when SL level hit
Check my other stuff in related ideas.
Please like👍, comment🗣️, follow me✒️, enjoy📺!
⚠️Disclaimer: I'm not financial advisor. This is not a financial advice. Do your own due dilingence.