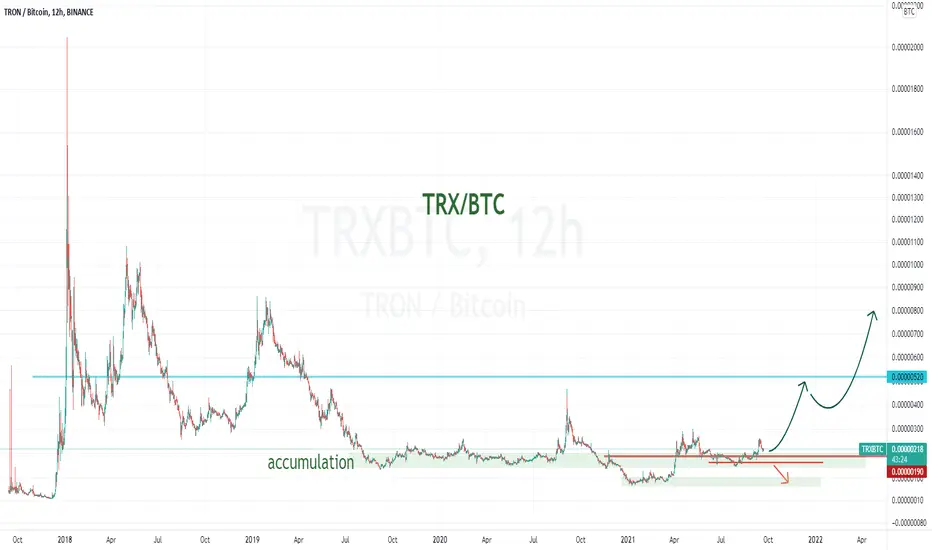
TRXBTCTRX is having a good trading session with BTC. In this chart, we have seen the strong position of buyers at every sharp uptrend even with the weak stance of sellers overtime. In it's up coming bull run do you think TRX will continue to keep sharp uptrends against BTC? please share your thoughts.
TRXBTC
TRX/USDT (Test Weekly Key Level?)💎Technical Analysis Summary💎
TRX/USDT
-After a good bounce from EMA23 two weeks ago
-TRON is likely to retest its weekly key area of support
-Due to BTC Dominance increasing value these few past days
-Many altcoins are pulling back from their recent gains or lows
-But looking at the long term view for TRX
-As long as this EMA and a key area is holding
-There are still chances for the Bulls to recover back up
-For now, we will have to see for any bullish reaction in the green zone
-It is not a good time yet to buy heavily on altcoin when they are showing weakness
-I'm currently out of any swing positions and will look for re-entry soon
-Be careful everyone especially those holding any altcoins
-Please book in some profit or have a stop loss always ready
⚠️Please always read the description⚠️
Thanks for donating 💰 via Tradingview coins TheDeFiPool 🙏🎉
``````````````````````````````````````````````
If you need help🙋 don't hesitate to
Send me a message here PolarHusk 😊
``````````````````````````````````````````````
Trading Involves High Risk ⚠️
Not Financial Advice 💸
Exercise Proper Risk Management 💱
``````````````````````````````````````````````

TRXUSDT , In the exactly way of 1st target ...Hello guys
According to our last analysis we shown on chart buy zone area and exactly that zone was activated and with ascending cover candle we can take long position and buy TRX and wait until 1st target , and this time the market exactly is moving like our prediction and in the way of first Tp , we should wait for take new position after first Tp reach we can update chart for others target and we will publish new chart
And others things is in these 2-3 days Justin Sun is in dubai in Seminar of blockchain , this is a good news that can jump the price
Be patient and enjoy your profit
Previous analysis
Be with us and sleep comfortably
Good Luck
Abtin

#TRXUSDT is on a dawn of the rise again??Tron is the most used USDT transfer protocol due their low transfer costs.
Thats why we believe that Tron is a fundamental cryptocurrency on the ecosystem.
We seem also a dip on #TRXBTC on daily chart ( have EMA200 resistance )
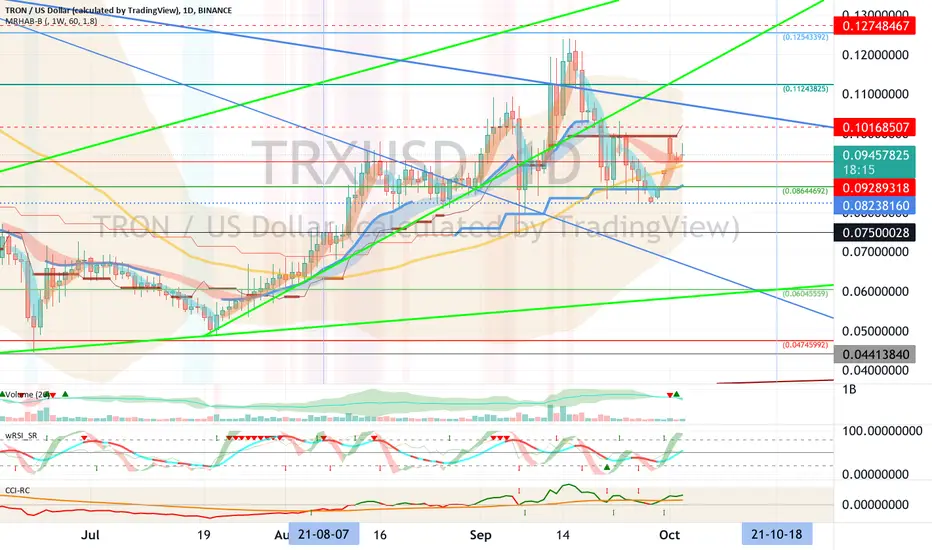
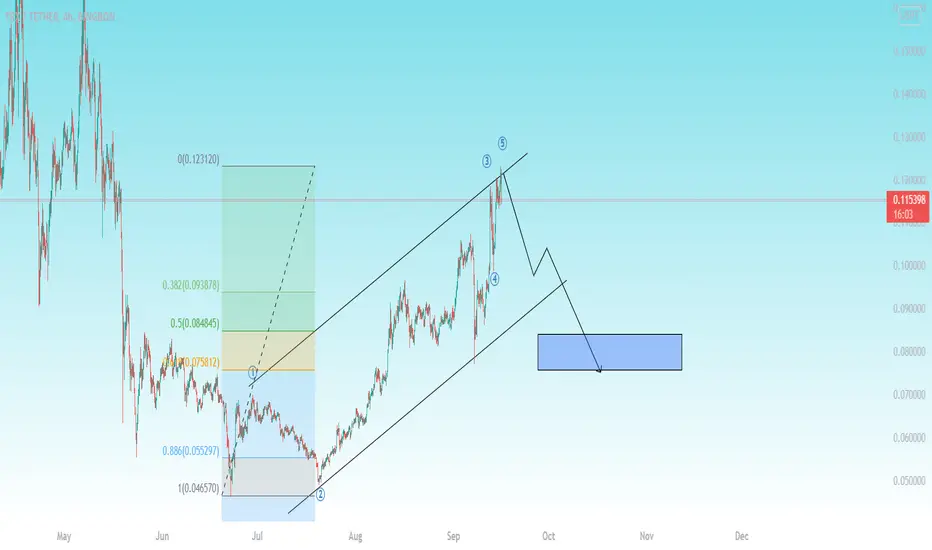
Currently #TRXUSDT is 0,095 level but there is 2 screnarios that we pinned down on the chart with ghost lines;
1 - #TRXUSDT Breaks the 0,975 resistance and goes till 0,106 and made a corection till 0,101 then go up acording to the formed channel and reach the 0,115 level.
2 - #TRXUSDT resistance of 0,0975 wil persist for a while ( meanwhile #TRX will accumulate) and form a channel between 0,09 ~ 0,975, after competed its accumulation period ( based on the daily #TRXBTC chart) the price will rica till 0,1 then 0,105 levels.
BINANCE:TRXUSDT , BINANCE:TRXBTC
It was not a investment advice , it is published only for educational purposes.


TRXUSD - In Case Of Alt SeasonHi there,
There are more than rumors that TRON Network it's becoming more and more knowledgeable in crypto transactions.
High Social Volumes deserves a perspective of price.
Check out the profile for more.
Thank you,
This is not a trading advice,
St.Gex

TRON (TRX) - October 4Hello?
Welcome, traders.
By "following", you can always get new information quickly.
Please also click "Like".
Have a nice day.
-------------------------------------
(TRXUSD 1W Chart) - Mid-Long-Term Perspective
Above the 0.04413840 point: The uptrend is expected to continue.
(1D chart)
First support section: near point 0.08644692 (section 0.08238160-0.09289318)
Second support section: 0.04745992-0.06045559 section.
Resistance section: 0.11243825-0.12543392 section.
Above the 0.09289318 point is the high point, so if the price is maintained above this point, it is expected that there will be a movement to create a new wave.
A short-term Stop Loss is needed if the first support is falling.
------------------------------------
(TRXBTC 1W Chart) - Mid-Long-Term Perspective
Over the 259 Satoshi-318 Satoshi section: Expected to create a new wave.
(1D chart)
First support section: 194 Satoshi-207 Satoshi section.
Second support section: 154 Satoshi-165 Satoshi section.
A short-term Stop Loss is needed if the first support is falling.
If it declines in the second support zone, a Stop Loss is required to preserve profit and loss.
The first resistance section: near the 259 Satoshi point.
Second resistance section: near the 318 Satoshi point.
------------------------------------------
We recommend that you trade with your average unit price.
This is because, if the price is below your average unit price, whether it is in an uptrend or in a downtrend, there is a high possibility that you will not be able to get a big profit due to the psychological burden.
The center of all trading starts with the average unit price at which you start trading.
If you ignore this, you may be trading in the wrong direction.
Therefore, it is important to find a way to lower the average unit price and adjust the proportion of the investment, ultimately allowing the funds corresponding to the profits to regenerate themselves.
------------------------------------------------------------ -----------------------------------------------------
** All indicators are lagging indicators.
Therefore, it is important to be aware that the indicator moves accordingly with the movement of price and volume.
However, for the sake of convenience, we are talking in reverse for the interpretation of the indicator.
** The MRHAB-O and MRHAB-B indicators used in the chart are indicators of our channel that have not yet been released.
(Since it was not disclosed, you can use this chart without any restrictions by sharing this chart and copying and pasting the indicators.)
** The wRSI_SR indicator is an indicator created by adding settings and options to the existing Stochastic RSI indicator.
Therefore, the interpretation is the same as the traditional Stochastic RSI indicator. (K, D line -> R, S line)
** The OBV indicator was re-created by applying a formula to the DepthHouse Trading indicator, an indicator disclosed by oh92. (Thanks for this.)
** Support or resistance is based on the closing price of the 1D chart.
** All descriptions are for reference only and do not guarantee a profit or loss in investment.
(Short-term Stop Loss can be said to be a point where profit and loss can be preserved or additional entry can be made through split trading. It is a short-term investment perspective.)
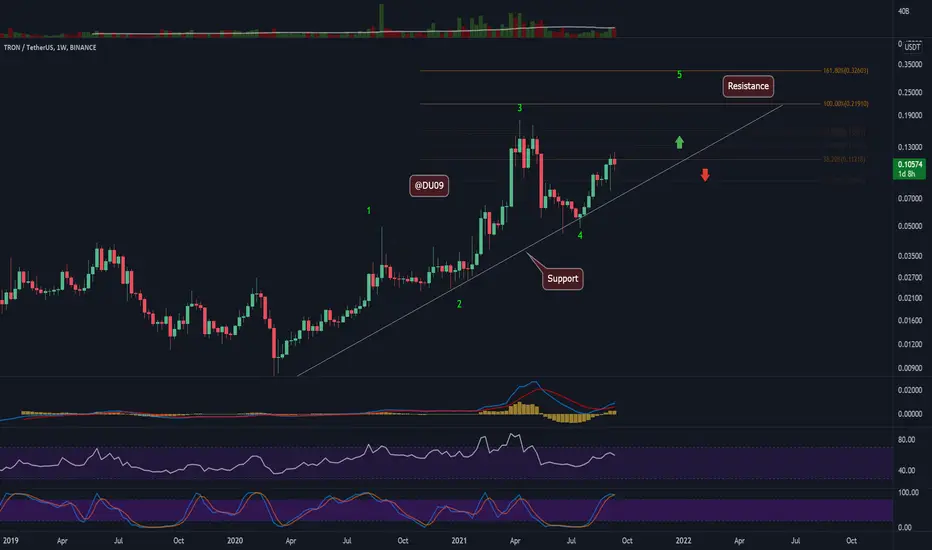
Tron TRXUSD - Huge channel + Elliot Wave- On the chart we can see an incomplete Impulse Elliott Wawe (5th wave).
- Rounding bottom or cup and handle is also printing on the chart.
- Volume is very bullish and also RSI is prepared for another pump!
- Target is 1:1 fib trend-based extension + top of the ascending channel + 5th elliott wave
- For expected duration of the trade, probability, stop loss, profit target, entry price and risk to reward ratio ( RRR ) - please check my signature below ↓
- Huge bullish volume is also one of the positive signs!
- If you want to see more of these ideas, hit "Like" & "Follow"!

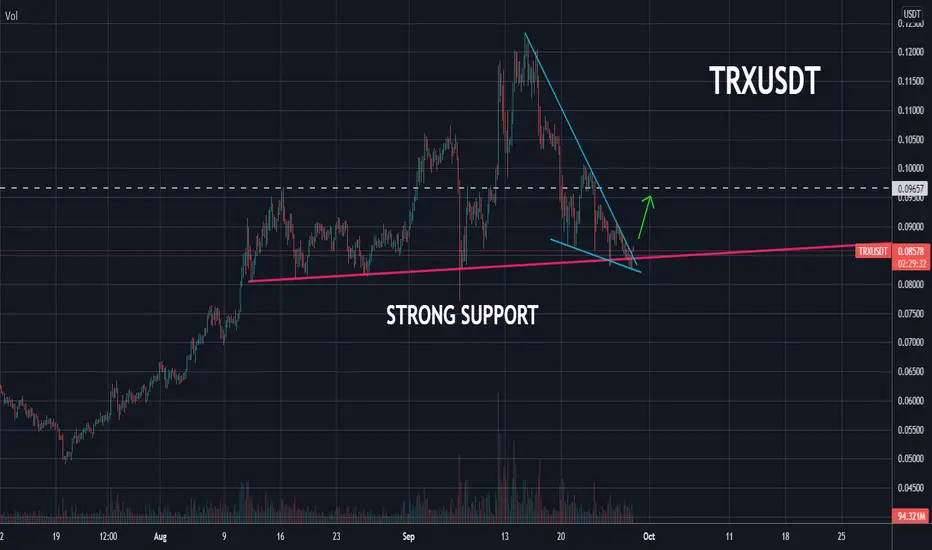
TRON Breaking Out Off Strong Support - Good Potential LongI really like the potential of this long entry as TRON breaks out off of strong support. Reason being is that even if the price reverses after the breakout, good support is there. TRXUSDT has one of the stronger USDT charts out there following BTC's collapse. It could indicate that the bulls are ready to push the price higher. The only caveat that could foil this plan is if BTC continues to sell off so have your SL ready below support just in case.
TRX to the moon?🔥🌙hi guys hope you doing great ,as you can see on the chart trxusdt has broken upward the long term trendline and now its going to make a pullback and start for an uptrend.

Cryptocurrencies, Bitcoin, Daily Chart, Trading Signal, BTC,TRXOn special request from TRX holders. Head and shoulders on the 4HR timeframe not looking good. Best to exit and repurchase at lower price targets. TRX likely to bottom out at $.05

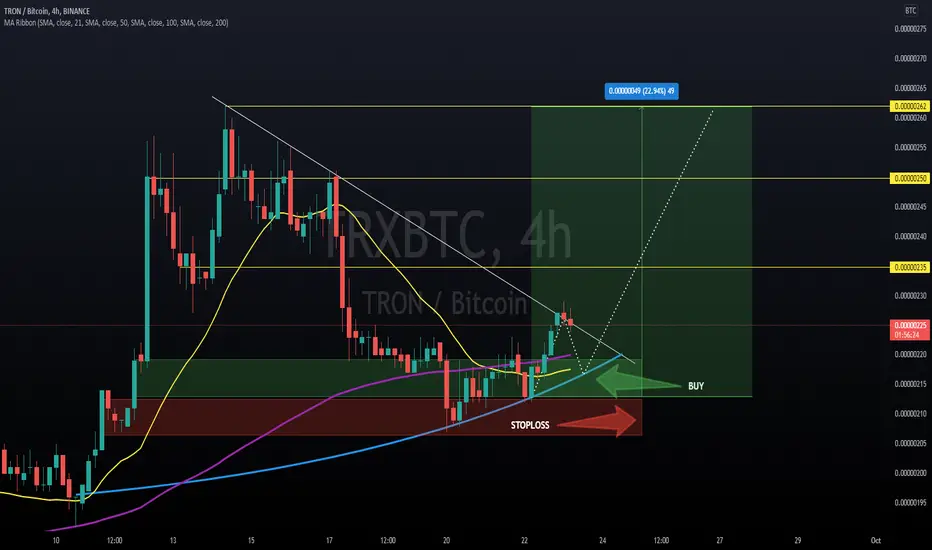
TRX/BTC 4HOUR UPDATE trx/btc trade setup
2x to 5x
trx/btc long entry :-213,219
traget:-235,250,262
stoploss :- 205,
Remember: This is not a piece of financial advice. All investment made by me is under my own risk and I am held responsible for my own profit and losses. So, do your own research before investing in this trade.
happy trading ...
thank you...
TRX/BTCWe are waiting for October. You also need to watch Litecoin, most likely it will be the first to show such growth. This can all be a repeat of DODGE and then we can say that the alt season will begin.
TRX Breakout and RetestTRXBTC has broken out of its triangle and retest it today. There is a potential to see it goes up.
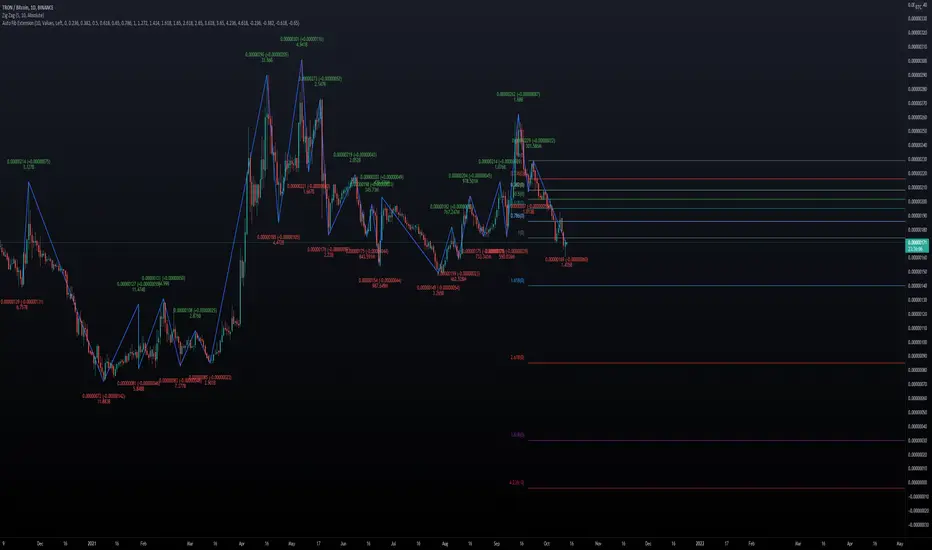
TRX/USD - Path to $0.20 🚀TRON macro view looks bullish as the trend is clearly up (higher lows).
If we count the waves, we seem to have completed all waves apart from the last fifth wave up. Once that is done, we may have a longer cool-off.
Price appears to be around half-way towards the top on this last wave. It's hard to guess the top, but I'd bet anywhere around $0.20 is a good place to secure profit. Some possible resistance levels are on the chart.
I don't exclude another re-test of support which would present a good buy opportunity before the last pump up. Then we need to re-assess the chart.
On weekly timeframe, indicators are bullish but I don't like the lacking volume. Hence, why on daily it does look like tron wants to re-test our support before we push higher again. So best to buy then if you are interested in longing Tron. If this plays through, you can double your entry, not bad.
Like and follow if you liked this idea!
TRON at a 13% Discount - Potential Entries Before Next Leg UpA quick post that I thought was worth mentioning. Tron reset the RSI correcting ~13% since last night. When I saw that it was sitting on a confluence of support level from several different trends, I couldn't control myself and bought some more TRX at this 222 sat level. Bitcoin just had a little shakeout to $46750, but maintained it's bull flag. If it can show some strength and have a solid breakout beyond $48,000, I think we can expect a bullish continuation from TRX. The price could really fly if it breaks out against BTC.

TRON Ready for another 200% move from here..?#TRX/USDT TA Update:-
$TRON currently trading at $0.119
Which is 18% up from our lower entry.
In the LINE chart also breakout and Retest also confirmed.
Now Waiting for Big move from here.
Stop Loss same at :- $0.09
Targets:- $0.152/$0.214/$0.313
If break $0.152 then we can see new All time high.
Support:- $0.1
Resistance:- $0.152

Tron TRXUSD - Ascending channel + Elliott Wave- On the chart we can see an incomplete Impulse Elliott Wawe (5th wave).
- Rounding bottom or cup and handle is also printing on the chart.
- Volume is very bullish and also RSI is prepared for another pump!
- Target is 1:1 fib trend-based extension + top of the ascending channel + 5th elliott wave
- For expected duration of the trade, probability, stop loss, profit target, entry price and risk to reward ratio ( RRR ) - please check my signature below ↓
- Huge bullish volume is also one of the positive signs!
- If you want to see more of these ideas, hit "Like" & "Follow"!

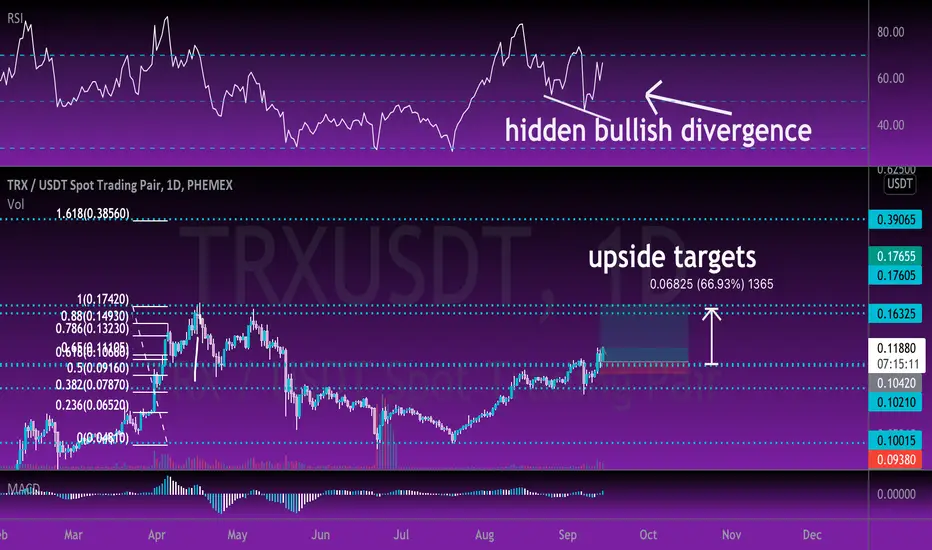
Tron TRX Ready to MOON LONG NOW !!??? TRON TRXTaking a look at price action you can see that the most recent pullback was a retest of key support and resistance and on top of that we formed hidden bullish divergence on the daily time frame !!
A short term break and rest of our most recent high which lines up with an area of support is holding strong
In my view holding this level could allow us to run up to the next level of resistance
If we execeed that level expect TRX to ATH 30 cents !!!!!
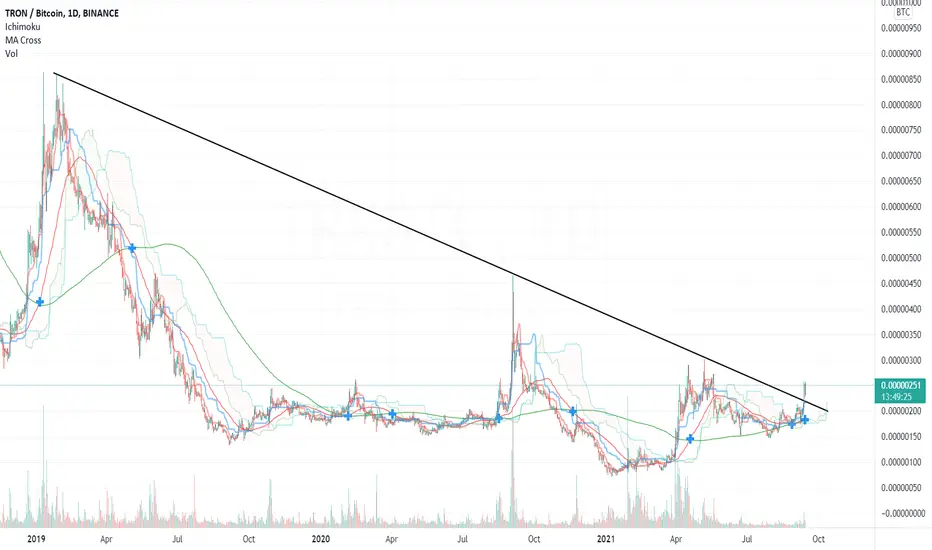
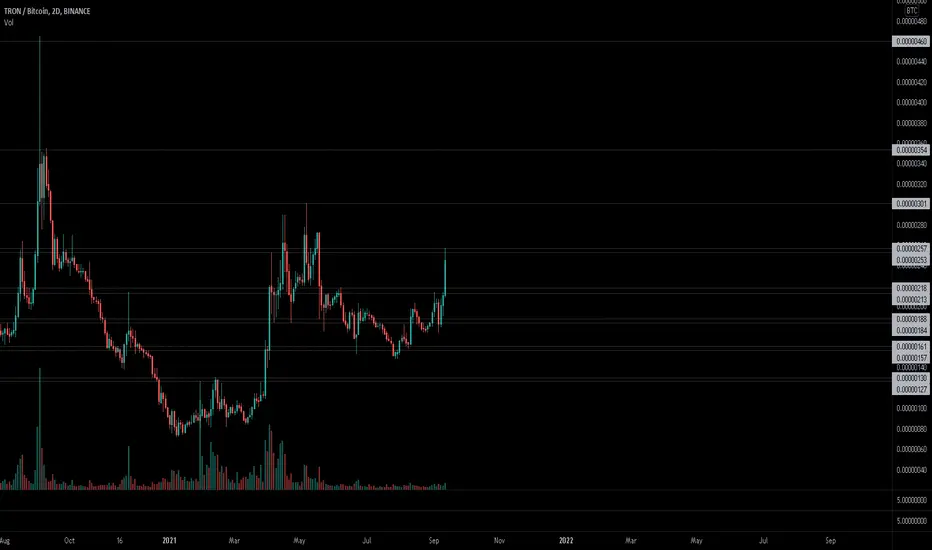
$TRX, Testing last level (~257 sats) prior YTD high$TRX
Testing last level (~257 sats) prior YTD high
Daily showing the highest volume since May.. 😏
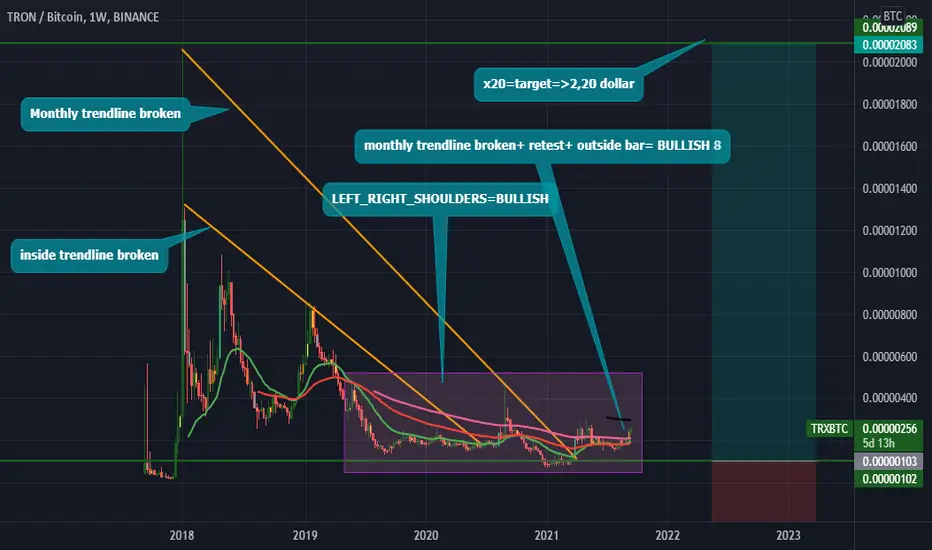
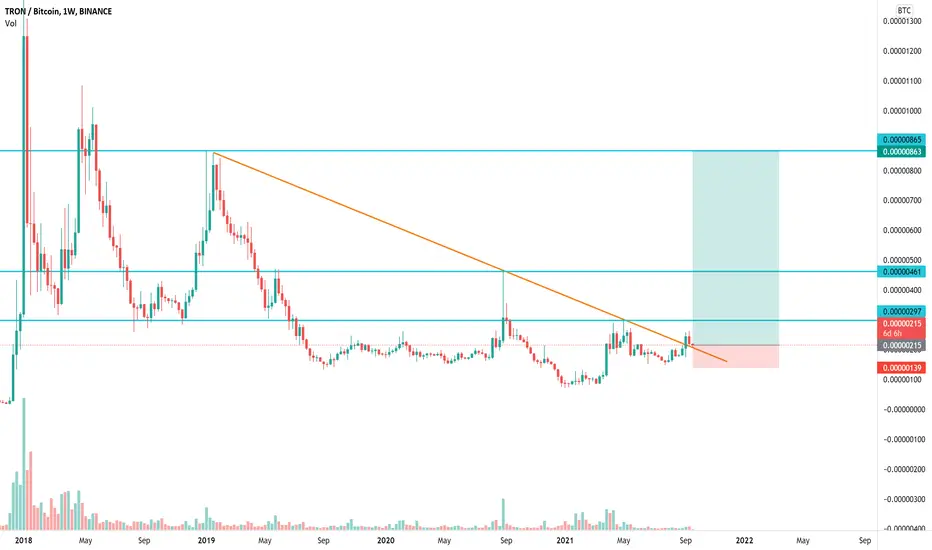
TRXBTC Broken Monthly trendline+retestAs you see on the monthly trendline we've broken trendline and retested with a nice outside bar( orange bar) which is very bullish the next months.
My target is around 2.20 dollar.
Am I crazy to follow this ? No, because Tron is a volatile coin and it can go really fast when altcoin season starts.
Remember , when everyone start to desbelieve, then it will start to rise.
Like, share and comment what your predictions are.