Need to check if it can be supported around 0.07679-0.07760Hello?
Traders, welcome.
If you "Follow", you can always get new information quickly.
Please also click "Boost".
Have a good day.
-------------------------------------
(TRXUSDT chart)
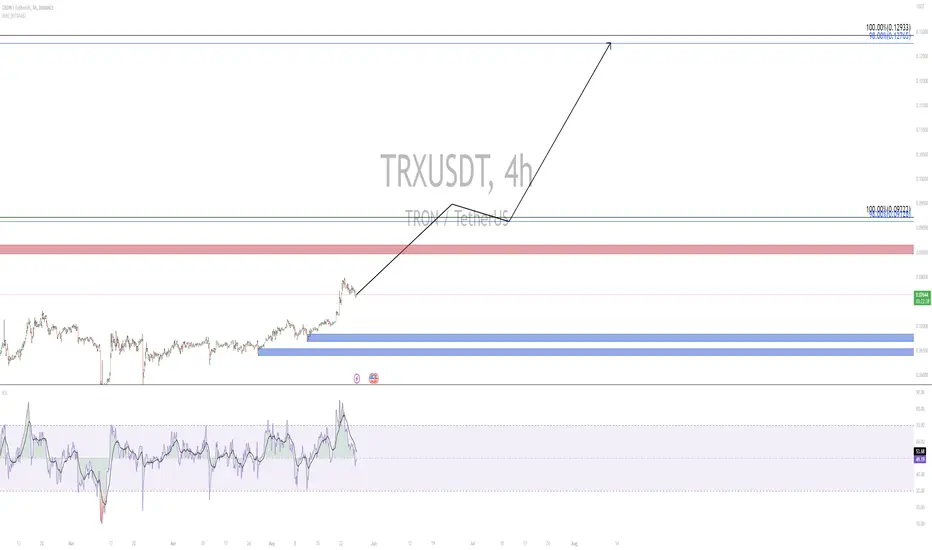
The key is whether it can get support around 0.07679-0.07760 and rise above 0.08051.
If not, and it goes down,
1st: 0.07288-0.07192
2nd: 0.06427-0.07025
You need to make sure that it is supported in the vicinity of the 1st and 2nd above.
-------------------------------------------------- -------------------------------------------
** All descriptions are for reference only and do not guarantee profit or loss in investment.
** Even if you know other people's know-how, it takes a considerable period of time to make it your own.
** This is a chart created with my know-how.
---------------------------------
TRXBTC
TRX/USDT 1DAY UPDATE BY CRYPTOSANDERS !!Hello, welcome to this TRX/USDT update by CRYPTO SANDERS.
CHART ANALYSIS:- Tron (TRX) extended a recent bull run for a fourth day, with today’s move taking the token to its highest point since last Sunday
Following a low of 0.08221 on Thursday, TRX/USD climbed to an intraday high of 0.08417 earlier in today’s session.
Tron bulls appear to be targeting a resistance level at 0.0860, which was last hit during last Saturday’s peak of 0.0943.
Since hitting that 20-month high TRX has mostly consolidated, however bullish momentum seems to be gradually returning.
This comes after the relative strength index (RSI) moved beyond a ceiling of its own at 63.00, and is now tracking at 64.84.
If the current sentiment remains, TRX could reach 0.0860 in the coming days.
I have tried to bring the best possible outcome to this chart.
Hit the like button if you like it and share your charts in the comments section.
Thank you

TRX TRONUSD UPWARDS POWERFULL BULL TRENDWhat is TRON?
TRON’s tagline is to “decentralize the web,” and its ecosystem consists of several decentralized applications, some of which are quite well known. However, its primary purpose is to decentralize the content creation and distribution industry, which has received criticism for its censorship and unfair revenue distribution. To this end, TRON provides several tools alongside its protocol to ensure more democratic content creation processes.
Some examples of centralized platforms that have censored videos and held a particularly strong revenue distribution control include YouTube. Indeed, the latter has censored several videos related to the cryptocurrency industry. Monetization is also a commonly discussed pain point related to YouTube. For many whose income depends largely on content, this can have a serious impact on their lives.
The TRON network actually features a number of cryptocurrencies, including BitTorrent Token (BTT), JST, and a TRC-20 based version of the Tether (USDT) stablecoin. TRON has outlined a set of Dapps that work with these tokens, and with BTT at least, that includes BitTorrent Speed, BitTorrent File System, and DLive.
Just (JST) is TRON’s DeFi-focused asset that powers a suite of related services. Within its remit is a stablecoin called JustStable (USDJ); JustLend, a lending platform; and JustSwap, a means to exchange to TRC-20 tokens.
What makes TRON stand out?
On the face of it, there isn’t much that separates TRON from its competitors. After all, all of them could just as well build Dapps that support the same goal as that of TRON. Indeed, many of them already do.
However, with a more focused approach on this matter, TRON perhaps stands a chance to gain ground in this specific niche. With interoperability becoming a focal point of general blockchain development, this could perhaps further cement TRON’s position as a content-focused network.
The unique selling point of TRON is that content on the network can be accessed by anyone, anywhere, with the prerequisite of an internet connection. This helps transcend censorship measures imposed by governments or companies. Several countries with totalitarian governments restrict websites and platforms, and TRON can help in this battle against censorship.
Technical Analysis:
Price has memory. That is a key concept in technical analysis.
One of the basic tenets of the study of price history is “support broken, tends to act as resistance.” The opposite is also a technical analysis maxim, “resistance broken, tends to act as support.” Have you ever considered why you see this play out on a chart so often?
It is simple, it is because of the “anchoring bias.” Briefly, the anchoring bias is the human tendency to rely heavily on the first piece of information encountered when making decisions and then use that initial piece of information to make future decisions.
Think of the price you may have personally paid for a stock. You tend to base your future decisions about that stock based on your purchase price. We calculate risk from that level and we measure our return based on that entry price. For better or worse, we are “anchored” to the price we paid.
Price charts are used in an attempt to understand the collective reasoning and psychology of the participants so we can objectively prepare our trading plan. In the case of traditional (horizontal) support being broken and then acting as subsequent resistance, the more participants who are “anchored” to a price level, the greater a move will become when there is a break of that price point. When price breaks a major level of support, the “trapped longs” will have a propensity to look to get out at “breakeven” the supply from these participants helps to form resistance.
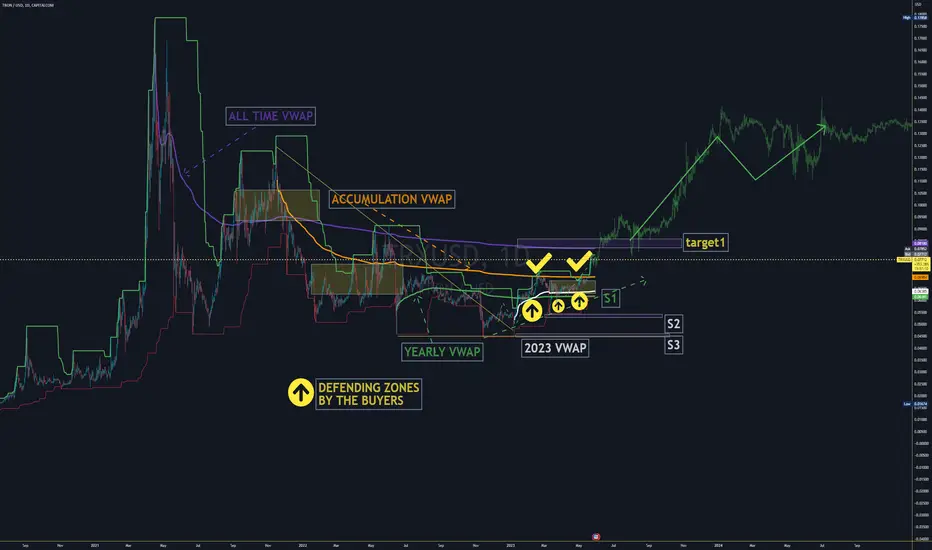
In a trending market, the classic horizontal support and resistance levels are not always obvious. If we want to measure price memory from an “event” the Anchored Volume Weighted Average Price tool is the most effective means to accomplish this task.
First, let’s define an “event.” In the markets, I consider a significant event to be any date from which price movement began or reversed. A short list of such events could be: earnings dates, week to date, month to date, year to date, FDA announcements, Fed announcements or just simple swing highs and lows.
YELLOW ARROWS: These VWAPS were anchored off of significant pullback lows, notice how buyers emerged to defend these levels on subsequent pullbacks. Notice that the longer the anchor point is on the chart, the less sensitive to current price action it will become.
The AVWAP is not just useful on longer term timeframes, it can also reveal some key insights about market behavior on intermediate and shorter-term timeframes
After gapping lower, buyers took control of the TRX and the AVWAP from that swing low provided intraday support on a panic selloff
As buyers became more aggressive on the gap higher, this AVWAP was briefly violated in early December, but then proved to be a good support level as prices stabilized near 0.59
Because of its moving property, the AVWAP can be analyzed in ways like a traditional moving average. Some considerations when using this indicator include; direction and slope of the AVWAP, how far above or below price action is in relation to the AVWAP, etc.
A robust indicator such as AVWAP can be implemented into any trading analysis or strategy. Experiment with various anchor points in you targeted markets and stocks and you will immediately recognize its value. As a stand-alone study or when viewed with other oscillators and indicators, the AVWAP is likely to become one of your favorite analysis tools.
S1 0.61
S2 0.54
S3 0.48
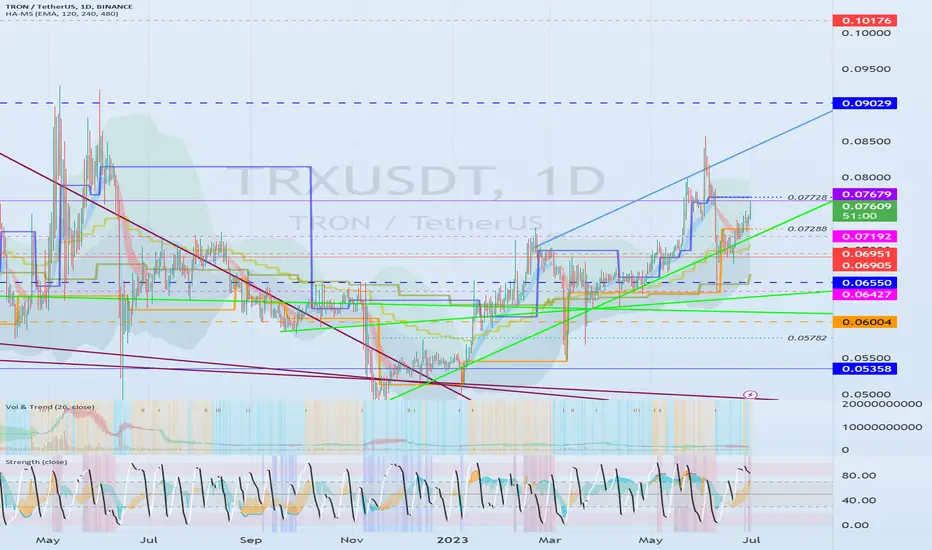
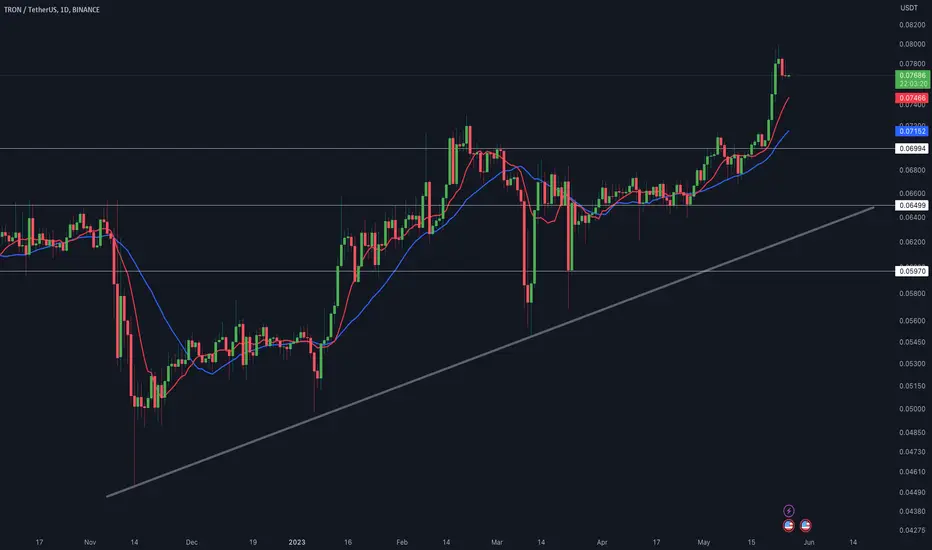
On May 9th 2023 the Donchian Channel breakout has been confirmed by high volatility and volume, RSI +68,a strong sign that the breakout is valid and promissing to start the uptrend
TRX ANALYSIS (4H)Hi, dear traders. how are you ? Today we have a viewpoint to SELL/SHORT the TRX symbol.
For risk management, please don't forget stop loss and capital management
When we reach the first target, save some profit and then change the stop to entry
Comment if you have any questions
Thank You

If it rises above 0.07728, a sharp rise is expectedHello?
Traders, welcome.
If you "Follow", you can always get new information quickly.
Please also click "Boost".
Have a good day.
-------------------------------------
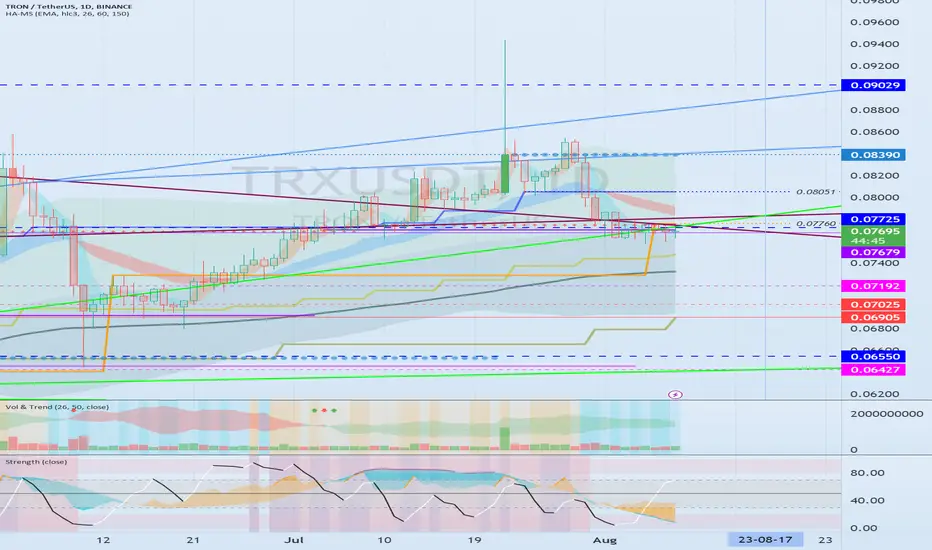
(TRXUSDT chart)
Looking at the 1M and 1W charts, it is expected to continue its upward trend as it has risen above the respective HA-High indicators.
(1D chart)
However, since it is located below the HA-High indicator on the 1D chart, the important question is whether it can be supported by rising above 0.07728.
If support is confirmed by rising above the HA-High indicator on the 1D chart, it is expected to rise to around 0.09029.
If it rises above the HA-High indicator, it is likely to break the previous high.
However, since the volatility is highly likely to form, careful trading is required.
The HA-Low indicator on the 1D chart is formed at the 0.07288 point.
So, we need to see if we can get support and rise around 0.07192-0.07288.
-------------------------------------------------- -------------------------------------------
** All descriptions are for reference only and do not guarantee profit or loss in investment.
** Even if you know other people's know-how, it takes a considerable period of time to make it your own.
** This is a chart created with my know-how.
---------------------------------
TRX NEW UPDATE (1D)Hi, dear traders. how are you ? Today we have a viewpoint to SEL/SHORT the TRX symbol.
For risk management, please don't forget stop loss and capital management
When we reach the first target, save some profit and then change the stop to entry
Comment if you have any questions
Thank You

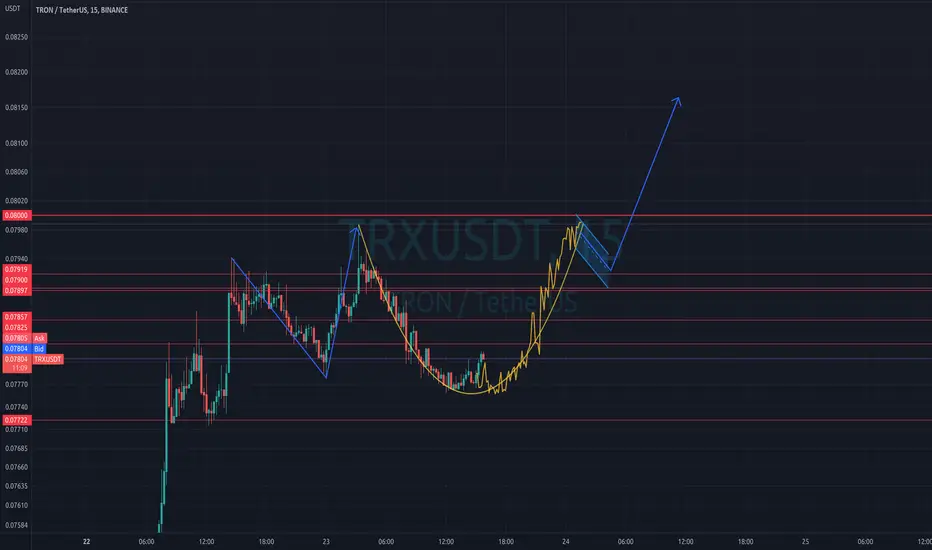
trxusdt are you rdy ?🧨😉Hello, today's analysis is the analysis of the TRX currency. For the TRX trend, we see an upward trend. In this upward trend, it will see and must see 2 targets. We have specified the targets 0.09128 and 0.12765 for you. that you can take a good profit from this upward trend. be successful and victorious.
TRX/USDT 1DAY UPDATE BY CRYPTOSANDERS !!Hello, welcome to this TRX/USDT update by CRYPTO SANDERS.
CHART ANALYSIS:- Tron (TRX) was slightly higher on Thursday as the coin moved back to one-year highs.
TRX/USD climbed to an intraday high of 0.07819 earlier today after hitting a low of 0.07651
The move came as prices recovered after yesterday's fall, resulting in profit booking.
the upside came as the 14-day Relative Strength Index (RSI) found a support point.
The floor above was at the 70.00 level, which is already deep in overbought territory.
Price strength now tracking 70.42, bears may try to send the coin higher in the coming days.
I have tried to bring the best possible outcome to this chart.
Hit the like button if you like it and share your charts in the comments section.
Thank you
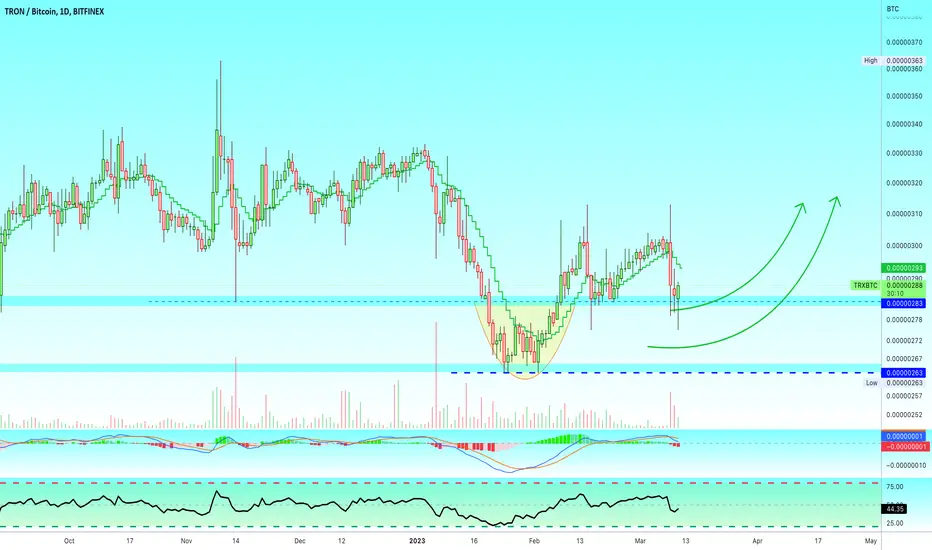
🔥 TRX Pumping On Zero Fee Bitcoin Trading: Great Long Term PlaySince the 22nd of March this year, the BTC/TUSD pair is tradable on Binance with zero fees. TUSD is the stable coin connected to TRX (Tron).
Ever since the zero fee trading went live, TRX has been outperforming Bitcoin by quite a margin. As seen on the chart below, the TRX/BTC pair has been pumping for weeks now, whilst the majority of tokens have been losing value against Bitcoin.
TRX is not some new hot token of the moment, so there's little reason for it to pump organically, so my assumption is that zero fee BTC/TUSD trading has increased demand for TUSD, and thus increased demand for TRX since it's an algorithmically pegged stablecoin (like LUNA and USTC).
As long as this zero fee trading is in effect, I'd wager that the demand for TRX will only increase from here, especially when the "real" bull-market will start and volume will increase next year or so.
Do you think TRX is a good long-term play, or is this pump temporary? Share your thoughts 🙏

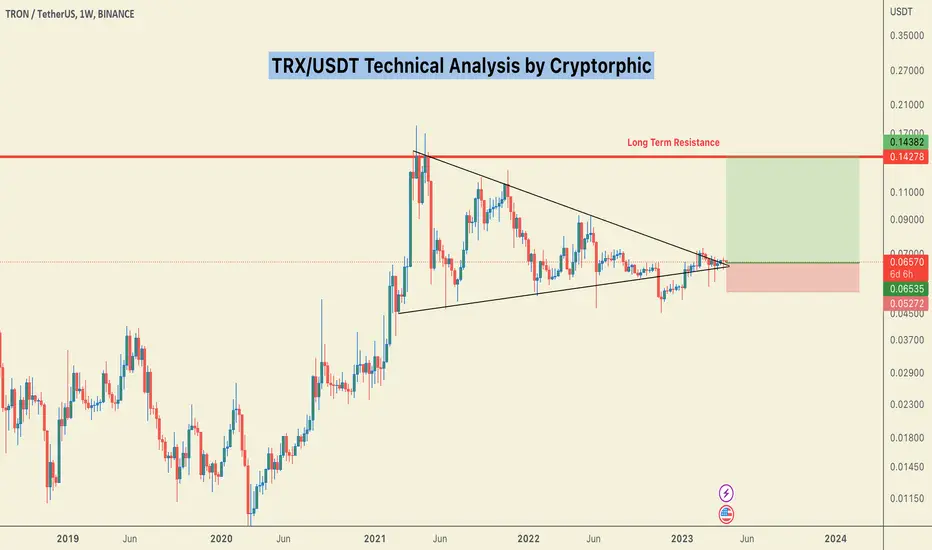
Tron Adam & Eve ProjectionTRX is on its way to print an Adam & Eve pattern. It's definitely set to test the local ATH and as a result print a cup & handle pattern too.
This is NOT FINANCIAL ADVICE
TRX/USDT 1DAY UPDATE BY CRYPTOSANDERS !!Hello, welcome to this TRX/USDT update by CRYPTO SANDERS.
CHART ANALYSIS:- Tron (TRX) rose close to an eleven-month high to start the week, following a recent four-day bull run.
TRX/USD rose to a peak of 0.07841 earlier in the day, which comes a day after trading at a low of 0.07271.
As a result of Monday’s move, TRON climbed to its strongest point since June 10 last year.
One of the catalysts of the surge appears to be a breakout that transpired on the relative strength index (RSI).
The index moved beyond the ceiling of 69.00, and as of writing, is tracking at 77.17.
Now in overbought territory, there could be some profit-taking, however, a target of $0.080 still remains a possibility.
I have tried to bring the best possible outcome to this chart.
Hit the like button if you like it and share your charts in the comments section.
Thank you

TRX PATTERNhi, dear traders. how are you ? Today we have a viewpoint to BUY/LONG the TRX symbol.
For risk management, please don't forget stop loss and capital management
When we reach the first target, save some profit and then change the stop to entry
Comment if you have any questions
Thank You
TRON/USDT 1DAY UPDATE BY CRYPTO SANDERS !!Hello, welcome to this TRON/USDT update by CRYPTO SANDERS.
CHART ANALYSIS:- TRON (TRX) soared as much as 2% on Wednesday as the token moved closer to breaking into the top 10 of cryptocurrencies.
TRX/USD climbed to an intraday peak of 0.07031 in the first session after hitting a low of 0.06841 on Tuesday.
As a result of this jump, TRX is now trading slightly above the long-term resistance at 0.070.
It appears that the bulls may aim to not only break above this range but also move up to 0.072, which will take the coin to a three-month high.
One of the main hurdles stopping this move is the Relative Strength Index (RSI), which is currently tracking at 59.67, below the 60.00 resistance.
If and when price strength moves beyond this point, more bulls will likely re-enter the market.
Hit the like button if you like it and share your charts in the comments section.
Thank you

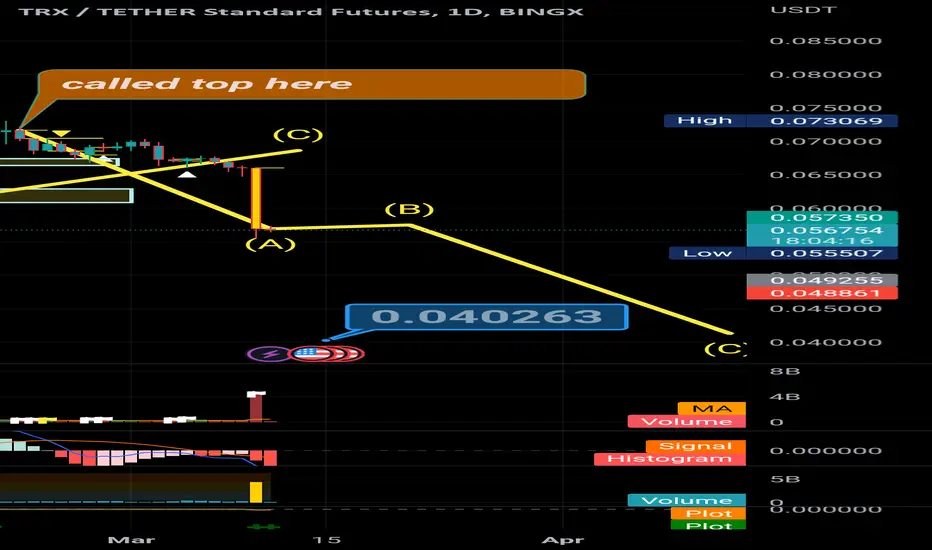
TRX Tron Double Top Chart PatternTRX Tron has formed one of the most obvious and bearish chart pattern out there: the Double Top.
The double top chart pattern is a bearish reversal pattern that is commonly observed in technical analysis of financial markets. This pattern typically forms after an extended uptrend, indicating that the market may be losing momentum and could potentially reverse its direction.
The pattern is characterized by two distinct peaks that are formed at approximately the same price level, separated by a period of consolidation or retracement in between. The two peaks are often referred to as the "left shoulder" and the "right shoulder," while the period of consolidation in between is referred to as the "neckline."
Once the second peak is formed and the price breaks below the neckline, it is considered a confirmation of the double top pattern. This break below the neckline indicates that the buyers are no longer able to push the price higher, and the sellers may have regained control of the market.
The Price Target of this pattern for TRX Tron on this particular pattern is $0.054!
Looking forward to read your opinion about it!

TRX : NEW UNEXPECTED BREAKOUT COMING?TRX did stays for a long time stable, but some patterns showed a possibility of a breakout.
IS TRX going to break out into the short term with 30% UP?
TRX is a coin where the volume is stable, and this is for a long time, will the new trend pattern make here a change in it?
We will follow the trend to see if it's able to break out as it shows.
Tron TRX Price Targets after the FOMC meeting this weekThe upcoming FED meeting on May 3rd could cause a further decline in the crypto market due to the potential rate hike and ongoing unease around banking system developments.
The outlook for the crypto market after the upcoming FED meeting on May 3rd is bleak.
Fears of a deep credit crunch caused by Silicon Valley Bank's collapse have not yet materialized, and the financial situation is much steadier.
Additionally, inflation remains elevated, and with evidence of stubbornness in underlying inflation, it could be in the 4% to 5% range, far above the 2% inflation target. The markets are pricing in a 25bp Fed Funds rate hike to 5.25% at the May FOMC meeting, and given the steadiness in financial markets, persistence in price pressures, and continued decent activity, this could contribute to a further downturn in the crypto market.
TRX/USDT short
Entry Range: $0.065 - 0.070
Price Target 1: $0.055
Price Target 2: $0.045
Price Target 3: $0.030
Stop Loss: $0.074

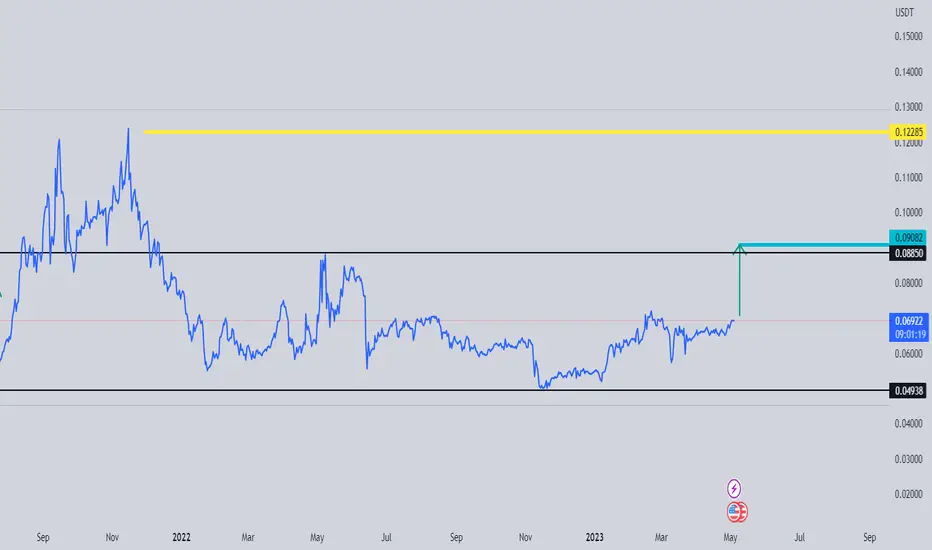
#TRX/USDT on the verge of a Breakout in Weekly.This coin has been trading sideways since June 2022.
A breakout is likely.
Zooming in on the Daily Chart A clear Breakout is visible.
The upcoming weekly close will clear more doubts eventually.
A weekly close above the .07 level will trigger a Bullish rally.
Recommended Entry:- .061 to .066
Targets:- 0.088, 0.097, 0.114, 0.126, 0.1412
Stop loss:- 0.05272
Please observe the chart for more details.
Let me know what you think in the comments.
DO HIT THE LIKE BUTTON IF YOU WANT TO SUPPORT MY CONTENT.
Thank you so much for your support.
#PEACE
TRX Tron | Binance US to Delist Justin Sun's TRX Next Week !!If you haven`t sold TRX Tron here:
Then you should know that Binance US, the American division of the world's top cryptocurrency exchange Binance, has declared that it will delist TRON (TRX) from its trading platform next week, on April 18.
Binance made the decision to delist TRON in response to the US Securities and Exchange Commission's (SEC) recent crackdown on the cryptocurrency magnate.
In its press release, the regulatory authority accused Justin Sun and his three wholly-owned companies, namely Tron Foundation Limited, BitTorrent Foundation Ltd, and Rainberry Inc, of defrauding investors by selling unregistered securities. Sun is also accused of performing "extensive wash trading" and organizing a scheme to pay celebrities to promote TRX and BTT without revealing their compensation.
Additionally, the SEC charged a number of celebrities, including Jake Paul, Ne-yo, and Lindsay Lohan, with illegally endorsing TRX and BTT without revealing their pay.
According to Elliott Wave theory, I expect for a retracement tp $0.052 level.
Looking forward to read your opinion about it.

Tron TRX Price Targets after the Ethereum Shanghai upgradeEthereum’s Shanghai upgrade is scheduled to launch on April 12.
The upgrade will make more than 18 million ether, worth approximately $34Billion, withdrawable, possibly causing a sudden crypto market supply dump.
This is my scenario for Tron:
TRX/USDT short
Entry Range: $0.062 - 0.067
Price Target 1: $0.055
Price Target 2: $0.045
Price Target 3: $0.030
Stop Loss: $0.074

TRX CAN DROP AGAINHi, dear traders. how are you ? Today we have a viewpoint to SELL/SHORT the TRX symbol.
For risk management, please don't forget stop loss and capital management
When we reach the first target, save some profit and then change the stop to entry
Comment if you have any questions
Thank You

Get ready for Tron LegendOne of the cheapest transfer methods between exchanges is trx. We think it will see the value it deserves very soon.
✳️ TRON vs BTC Changes Pattern | Potentially A Bullish SignalThis pair has been moving inverse to Bitcoin but now it seems to be moving together with Bitcoin... This is a big change.
When the dynamic of some pairs changes, this can signal that the overall market dynamic is changing as well or is about to change.
✔️ TRXBTC while in the bearish cycle moved inverse to Bitcoin.
✔️ TRXBTC now changing to become correlated with Bitcoin.
Can this tells us that Bitcoin is now entering a bullish phase?
Possibly.
We will have to wait and see but since the 1st of February, something changed.
The signal has been noted.
Namaste.
Trx in big troubleMassive red candle in there volume and a huge dunno gives us the energy to go to .04