TRXETH


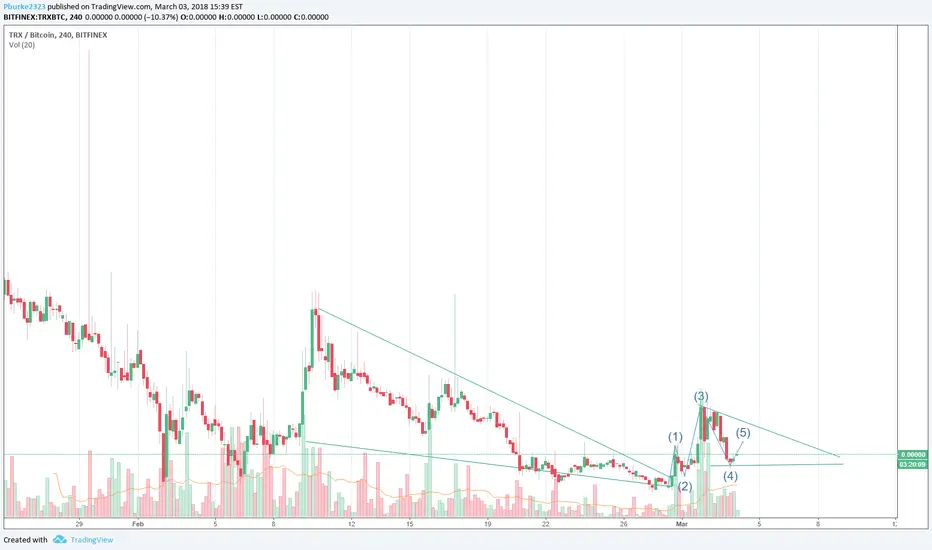
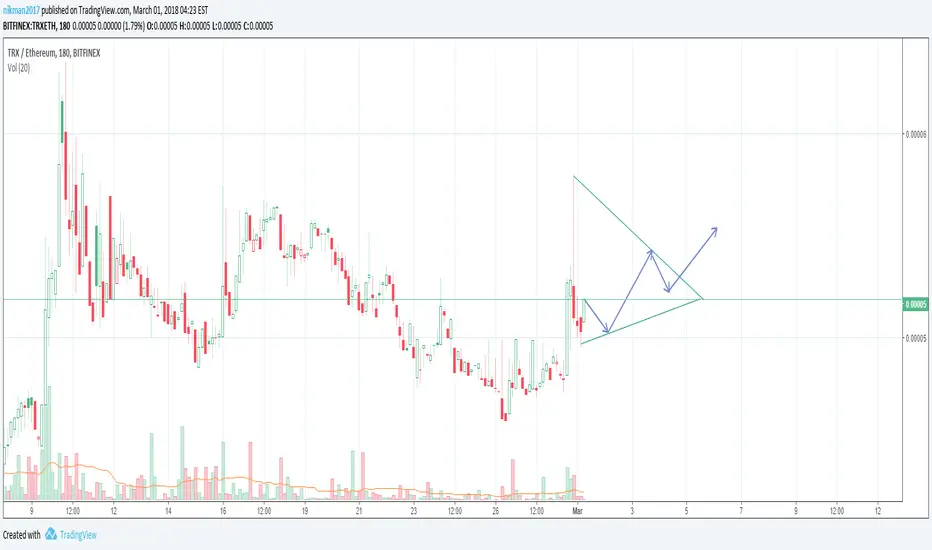
TRX - The sleeping giant, waiting to be awaken by BTC.We have a clear symetrical triangle, that previously looked like a head and shoulders pattern. As this depletes the sellers back closer the support line, we can see a break out may be imminent. While the degree of breakout is unclear due to BTC being the driving force in the market right now, there is a slight possibility in this being a decently sized 1-5 EW pattern. If we have seen the first two waves, as marked, we could be in for some fireworks for an upcoming wave 3. This is all speculative at this point, but has a possibility of occuring if BTC can stabilize for a bit. The volume has dropped a bit, but is still enough to produce such a pattern, if conditions are favorable. Will post an update tomorrow night, as we see what unfolds.

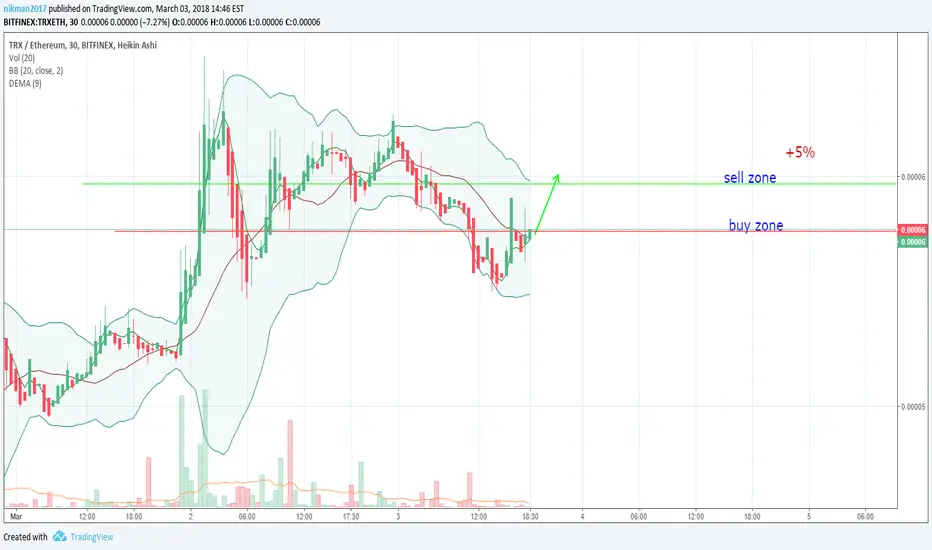
TRX - Breakout possible, if conditions are favorable.If you check my previous post, the pattern is holding true. This is a slightly downward facing triangle, that currently is squeezing out the last of the sellers before another breakout point. I think this coming breakout point will be more significant, as BTC is stabilizing above 11.5k. Watch the 4 hour charts to see this squeeze a little further until the apex point. The breakout is very likely as it hits the apex, but how the breakout looks will remain to be seen. So far, we've seen a breakout, and then an even smaller right triangle each time, but one of these could give to a new ATH if the volume if 1) the volume is significant enough, and 2) BTC has stabilized. BTC is the driver right now, and if it remains in it's current up-trend, we can expect the alts to continue to suffer until people decide to pull from BTC and invest in the alts. Either way, things still look good for TRX, and we'll just have to wait a bit longer for a meaningful breakout.
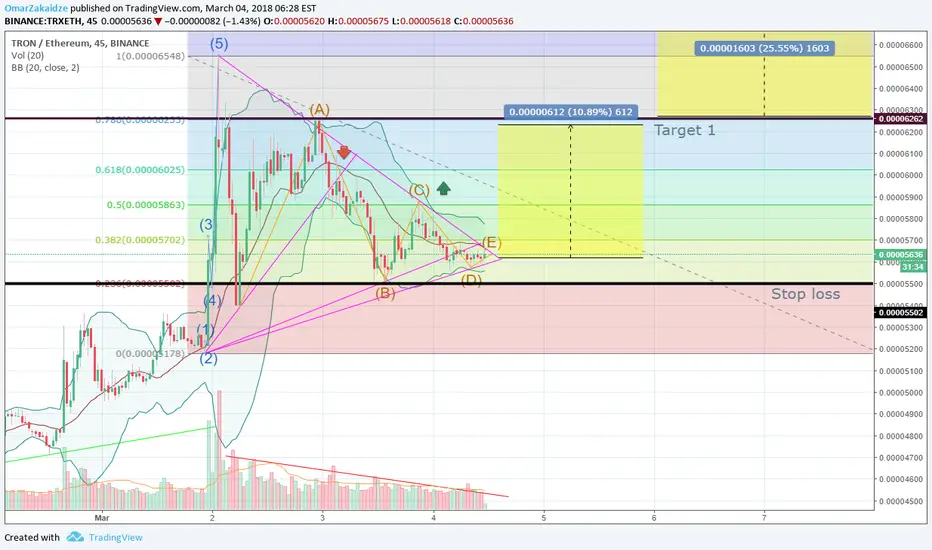
TRX, starcoin or shitcoin ?Yesterday my analysis was a little bit biased but now, I made some corrections, added the stop loss. I hope we are going to reach the target 1 in the next days and be on the way to the second target.
Omar
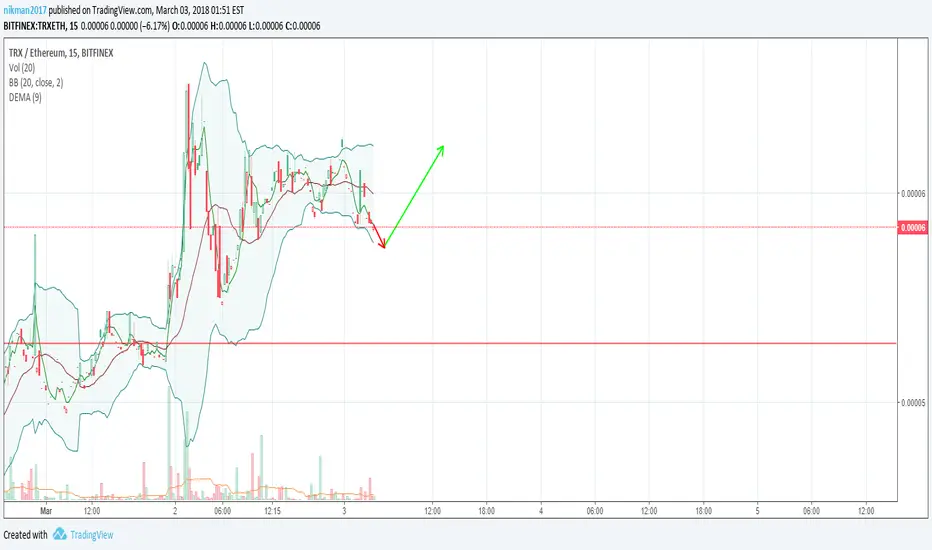
TRX - It's day will come!Previously I had posted that while we broke out at the apex of a right triangle, we could be looking at another slightly downward triangle, which is noticeably smaller than the last. We also may be in wave 3 (which we know is generally the longest. If we are, and we approach the top of the triangle, we'll need significant volume to break through that resistance point. If that happens, we could be off to the races to finish wave 3 before a correction. If the focus remains on BTC for the time being, and not there isn't enough volume/buyers to break the resistance, we're likely to see it bounce off the resistance, and remain inside the triangle until more sellers are depleted. This could take us to the apex point of this smaller triangle before the next attempted breakout.
A second and more likely scenario as time passes is that we're just about to complete a head and shoulders pattern, which will drop us back to support levels in the next day or two, and from there we'll see a bounch off the floor, and a pattern that may mimic the further elliot wave pattern shown to the right of the first one.

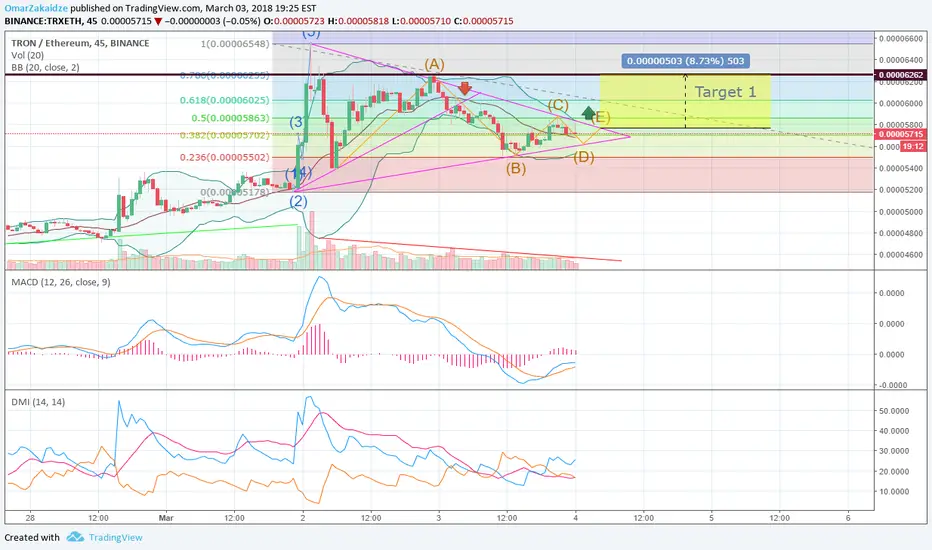
TRX Breaking out or not ?In the first triangle, TRX wasn't ready to break out. Now we're in a second triangle so let's see what happens.
I've fixed a target for the next days. It could be the start of a new small bullish era.
Omar
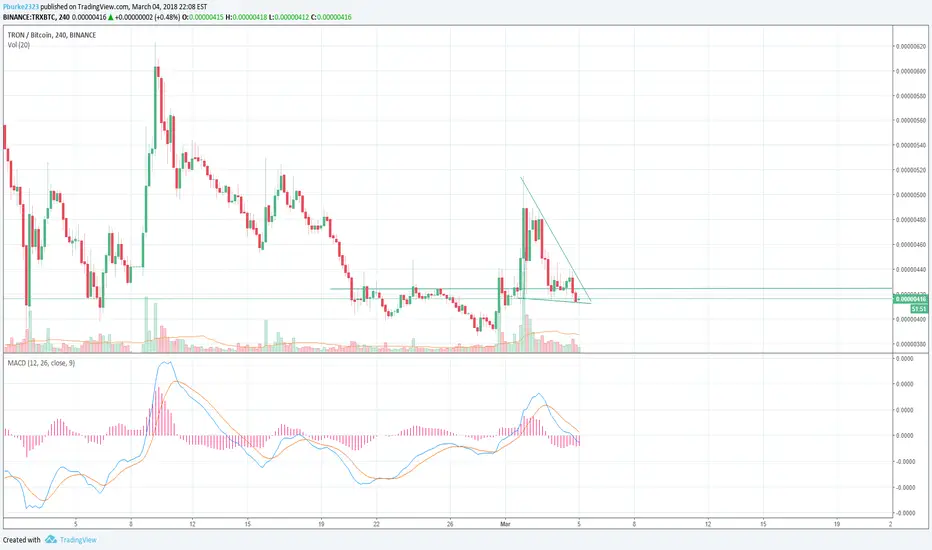
TRX - May need a bit longerTRX (Tron) did break out of the last downward pointing triangle, as expected. Sellers were too depleted by that point, as we can see by squeeze occurring toward the apex of that triangle. It broke out slightly, with some large volume, but since has trended back into a pattern that may be another, albeit smaller downward pointing triangle. If this is the case, we may see targets within the triangle over the next week, while more sellers get squeezed out again. Notice previous to the last triangle, there were others prior, and each time they have reduced in size and duration. If this pattern continues to play out, we can expect it to be shorter than the last, and another possible breakout at the apex. For the breakout to be substantial this time, we will need bitcoin to stop climbing, as nearly all alts right now are bleeding due to people taking money out of them, and riding the bitcoin wave.
HOW MY SCREEN LOOKS FOR TRADES TRXTRON SHOWING A OBVIOUS CUP AND HANDLE PATTERN. YOU CAN READ THIS EASILY ON MACD.... I HIGHLIGHTED IT IN MAGENTA.THIS IS HOW MY SCREEN LOOKS WHEN TRADING IT WILL HELP YOU. LOVE CHRIS MOODYS INDICATORS RSI WITH MACD DRAG THEM ON THE SCREEN AND PULL UP A SHORT TERM CHART AND USE THEM TO EXIT AND ENTER TRADES. GREAT FOR PATTER RECOGNITION.


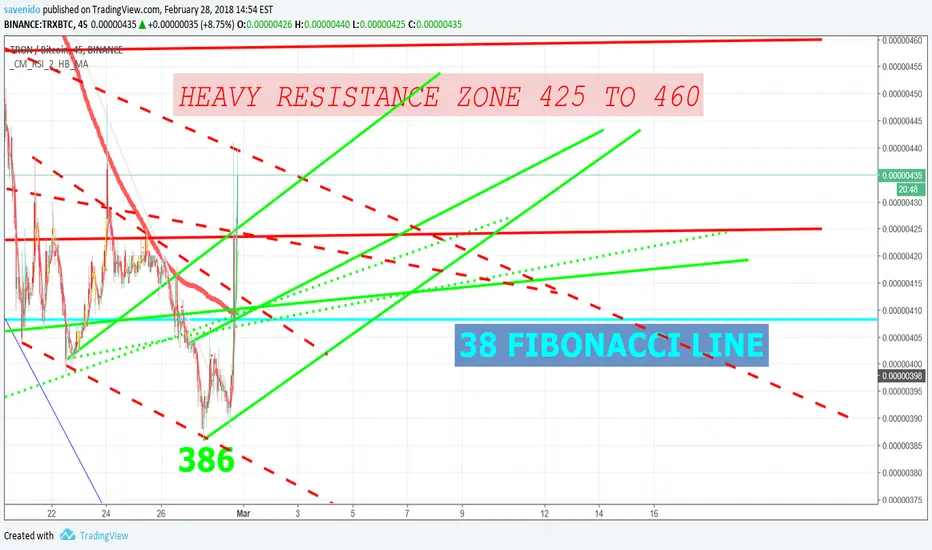
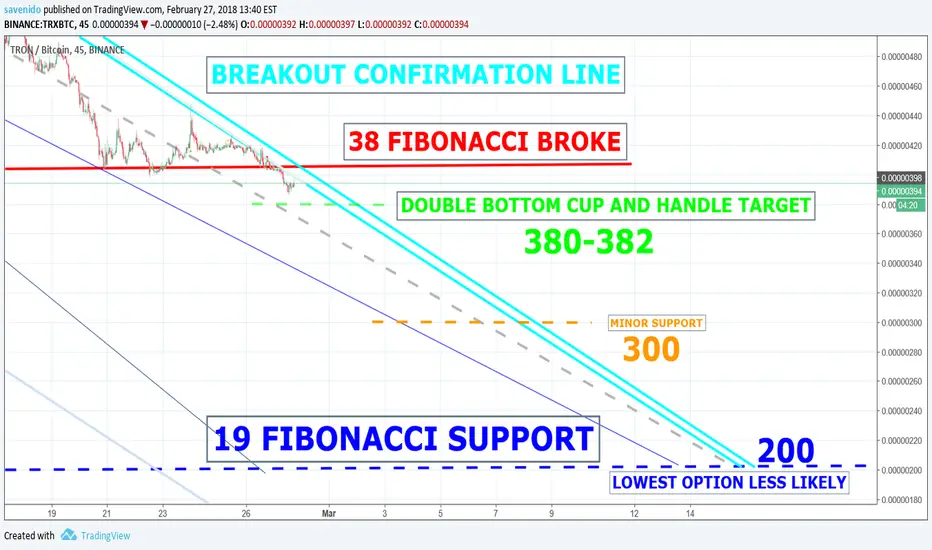
TRX FINAL STAGE IN GOING BEAR TO BULL..... NEW BOTTOM OR DOUBLE?TRX EVERYTHING IS CLEARLY LISTED.... WE BROKE UNDER MAJOR SUPPORT THE 38 FIBONACCI WHICH HAS HELD WELL RELATIVELY.... THE 100 DAY MOVING AVERAGE IS DIRECTLY UNDER THE PRICE ACTION RIGHT NOW AT AROUND 380 COULD BE JUST WHAT WE NEED. HOWEVER BEST TO UNDERSTAND THE OPTIONS. DOTTED GREY LINE IS THE MIDDLE OF THE CHANNEL. WE HAVE HIT BOTTOM TWICE AND TOP TWICE.... WE SHOULD ESSENTIALLY HAVE TO COMPLETE ONE MORE JOURNEY DOWN TO THE BOTTOM CHANNEL. HOWEVER THERE ARE THINGS IN PLAY HERE... BIGGEST NUMBER TO WATCH IS THE 380 LINE IF WE HIT 379 WE DONT HAVE ANY MAJOR SUPPORT IN SIGHT
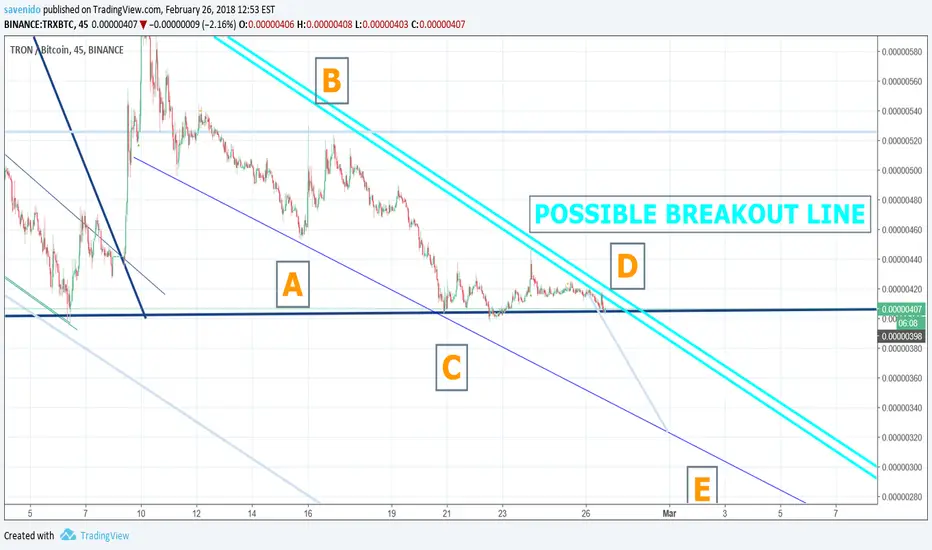
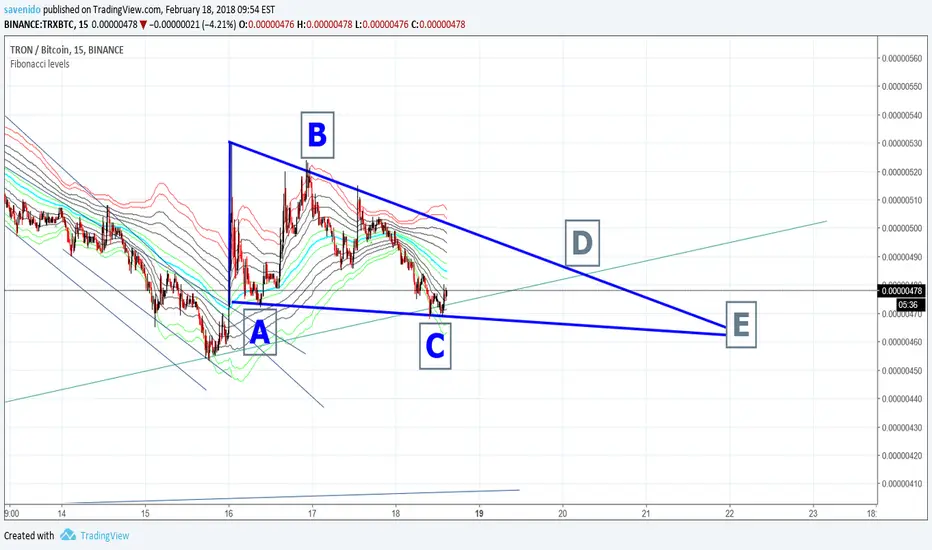
TRON LIKELY GOING DOWN BEFORE UP BUT WATCH THE BREAKOUT LINETRON ABCDE DESCENDING FLAG CAUSING UPWARD BREAKOUT OR BREAKOUT FROM 400 LINE HOLDING WHICH IS UNLIKELY
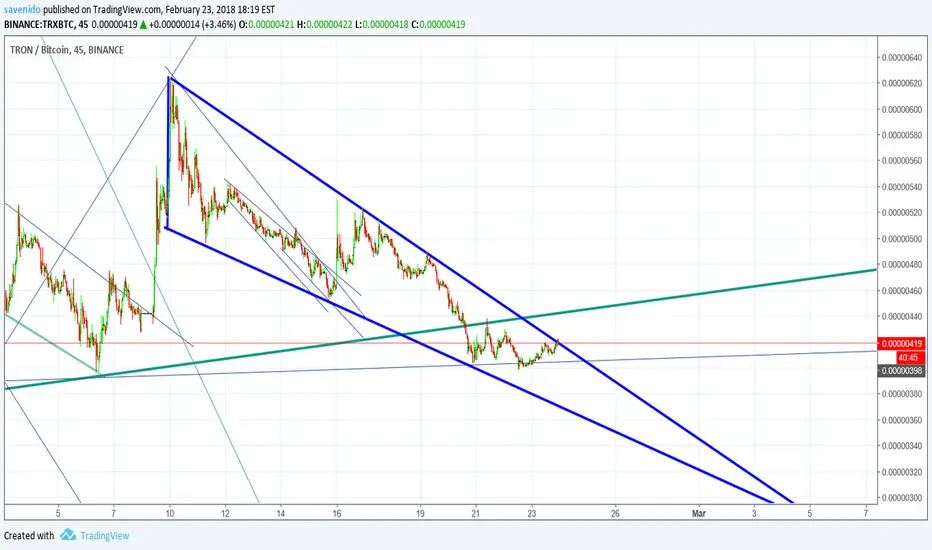
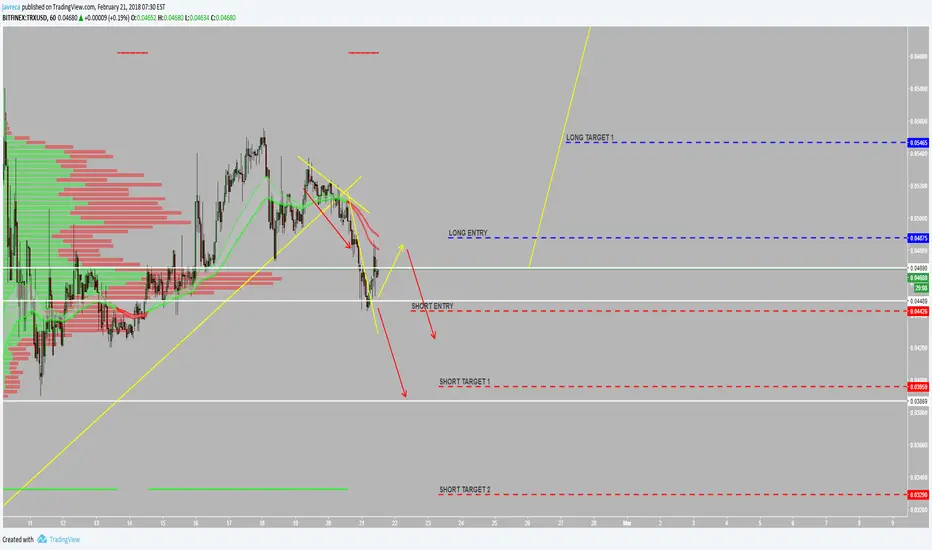
#TRX #TRON multiple targetsLower line channel didn't hold. Price didn't reach our entry point to go long.
New set up: looking to go long at entry point.
If price bounce up but retrace before triggering our long position looking to go short as shown.
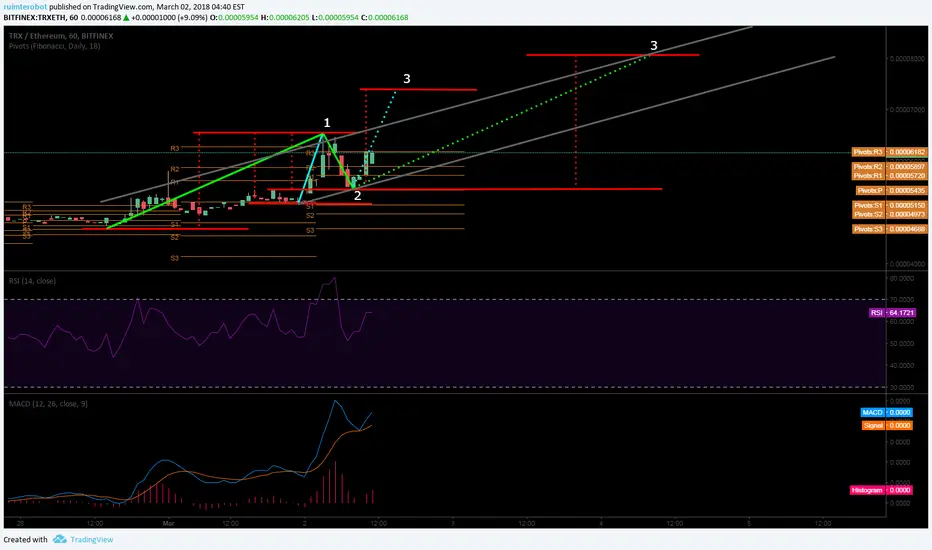
Something big about to happen with TRX?TRX has reached the end of a symmetrical triangle and could go either way.
MACD indicates a positive turn.
See fib levels for wave 3, or red line for strong bottom support of smaller wave A.

TRX TRON TRXBTC TRX/BTC TRXETH TRXUSD TRX/ETHQUICK LOOK AT TRON NOTHING HAPPENING UNTIL WE HIT THE HIGHER DEGREE OF TREND UP IN A WEEK OR SO. BY MARCH 21ST THIS WILL BE AT 25 TO 40 CENTS DEPENDING ON THE PEOPLE SELLING TO GET THERE MONEY BACK ON WAY UP WHO BOUGHT TOO HIGH
#TRON to #HODL or not whales are using #tron to make 10 to 30 percent gains. use this trading range to trade the same way the wahles do until it breaks out. i prefer to #hodl this token. not everything needs to be traded.
with that being said...the chart looks the strongest its ever been. it seems like someone is securing bags for a strong run one day. strong long term hold
